
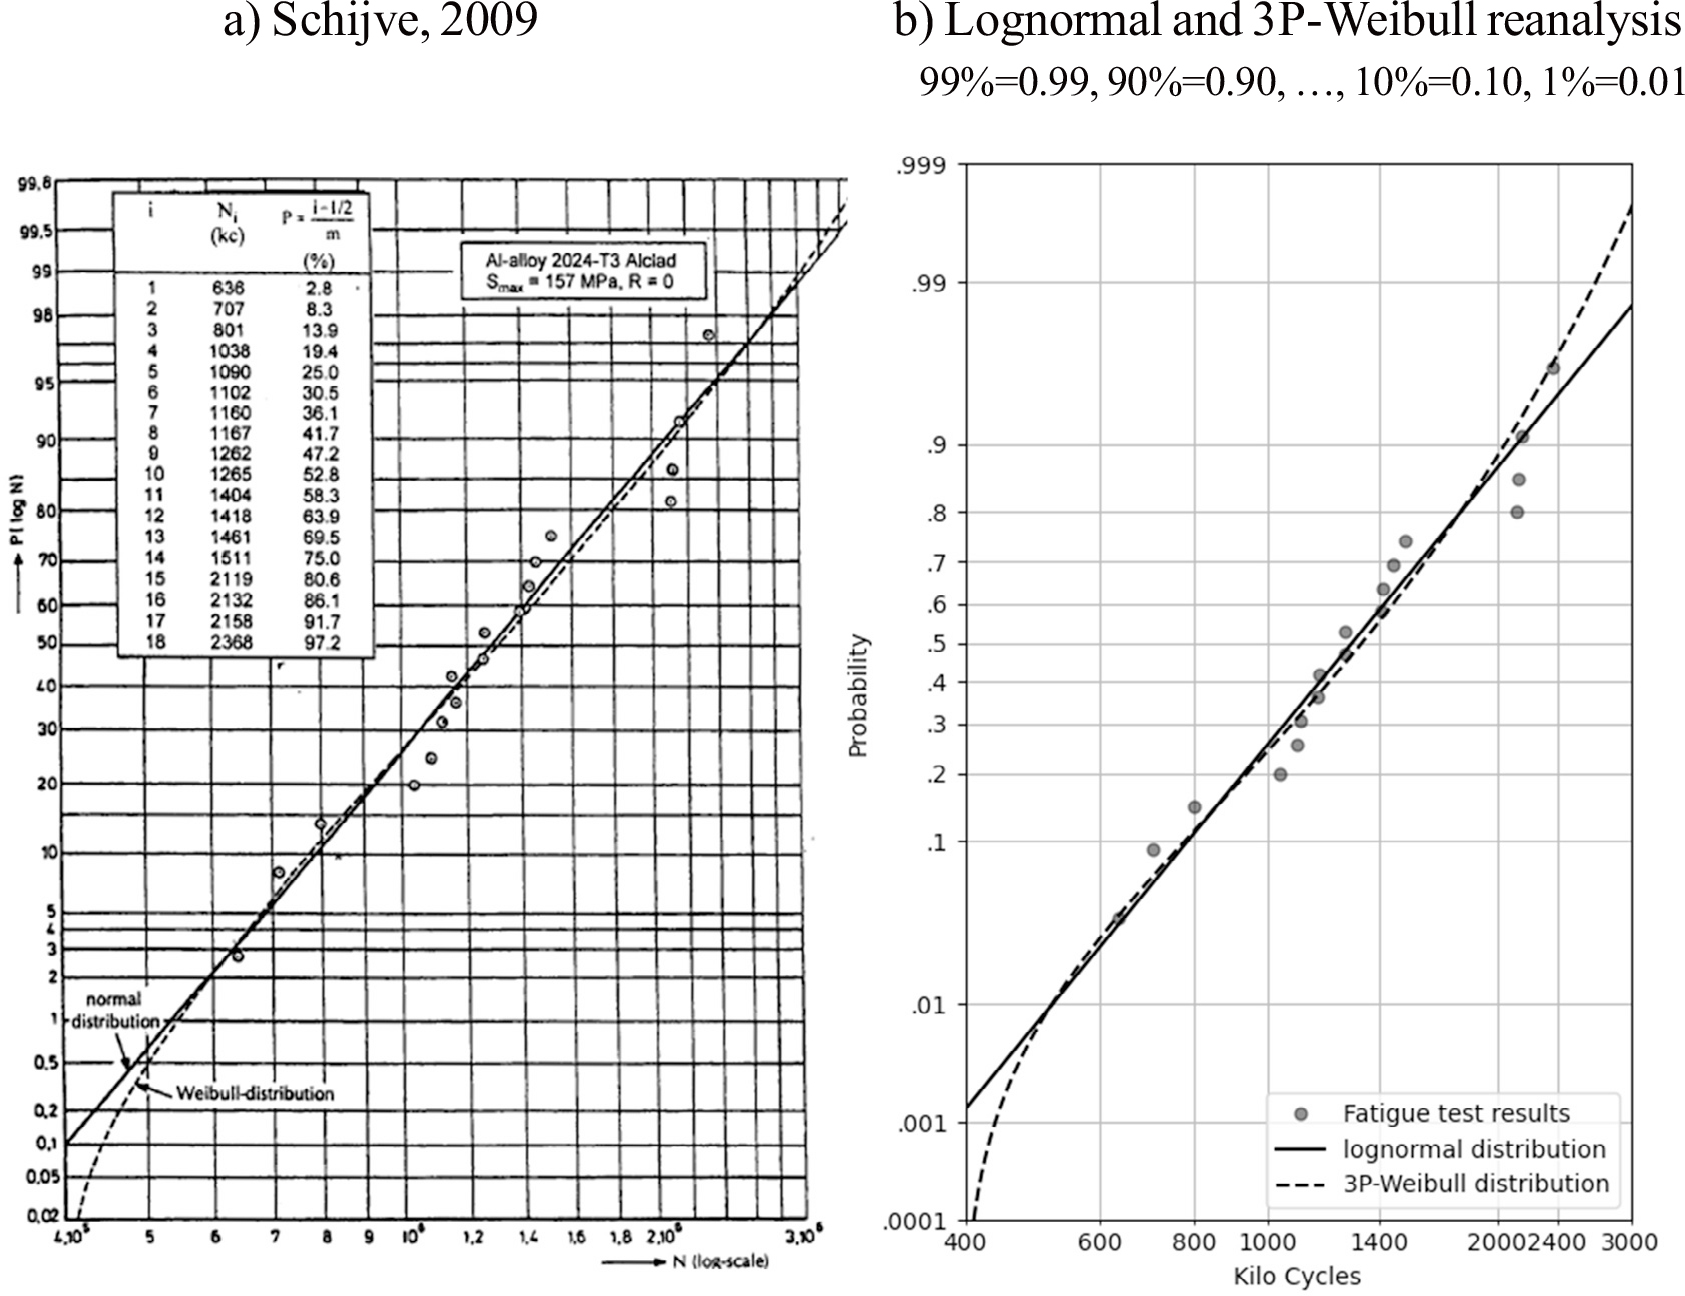
Figure 1.
Lognormal and 3-parameter Weibull distribution of Schijve dataset fatigue test results a) reproduced from Schijve (2009, figure 12.3), and b) reanalysis for this paper.
Table 1.
Fatigue test results in Kilo Cycles (specimen number).
| 636 (13G) | 1160 (13J) | 1461 (12F) |
| 707 (13H) | 1167 (12H) | 1511 (13C) |
| 801 (13K) | 1262 (13A) | 2119 (12C) |
| 1038 (12K) | 1265 (13B) | 2132 (13D) |
| 1090 (13E) | 1404 (12G) | 2158 (12D) |
| 1102 (12J) | 1418 (13F) | 2368 (12E) |
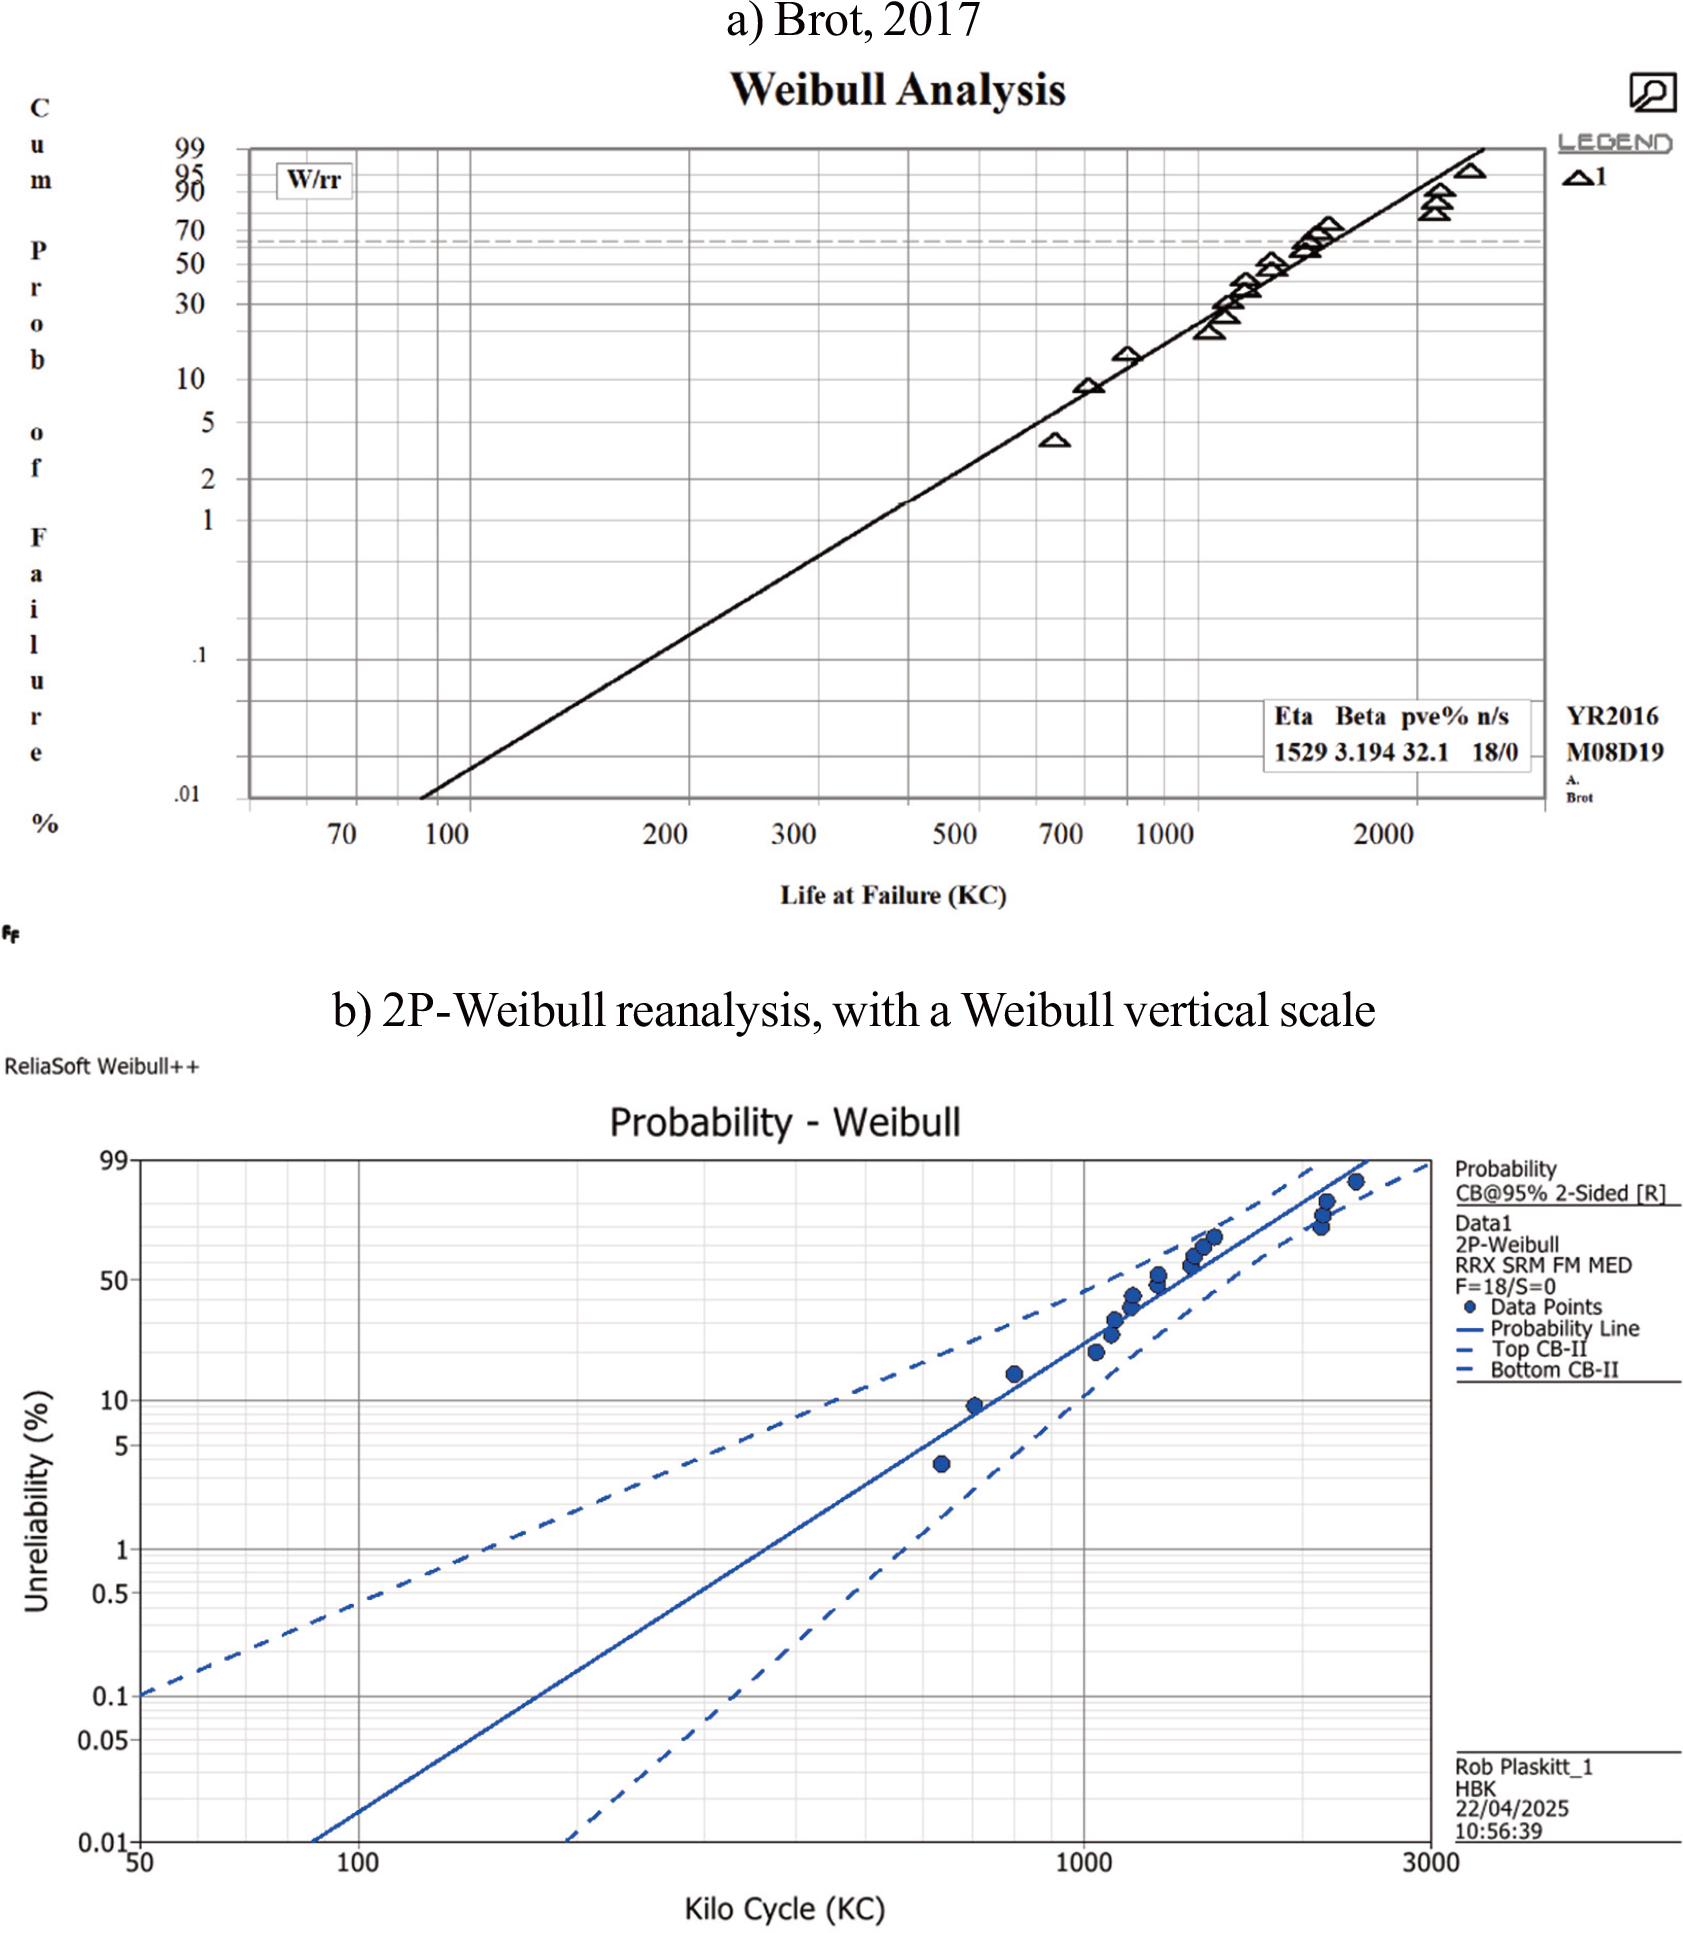
Figure 2.
2-parameter Weibull distribution of Schijve dataset fatigue test results a) reproduced from Brot (2017, figure 18), and b) reanalysis for this paper.
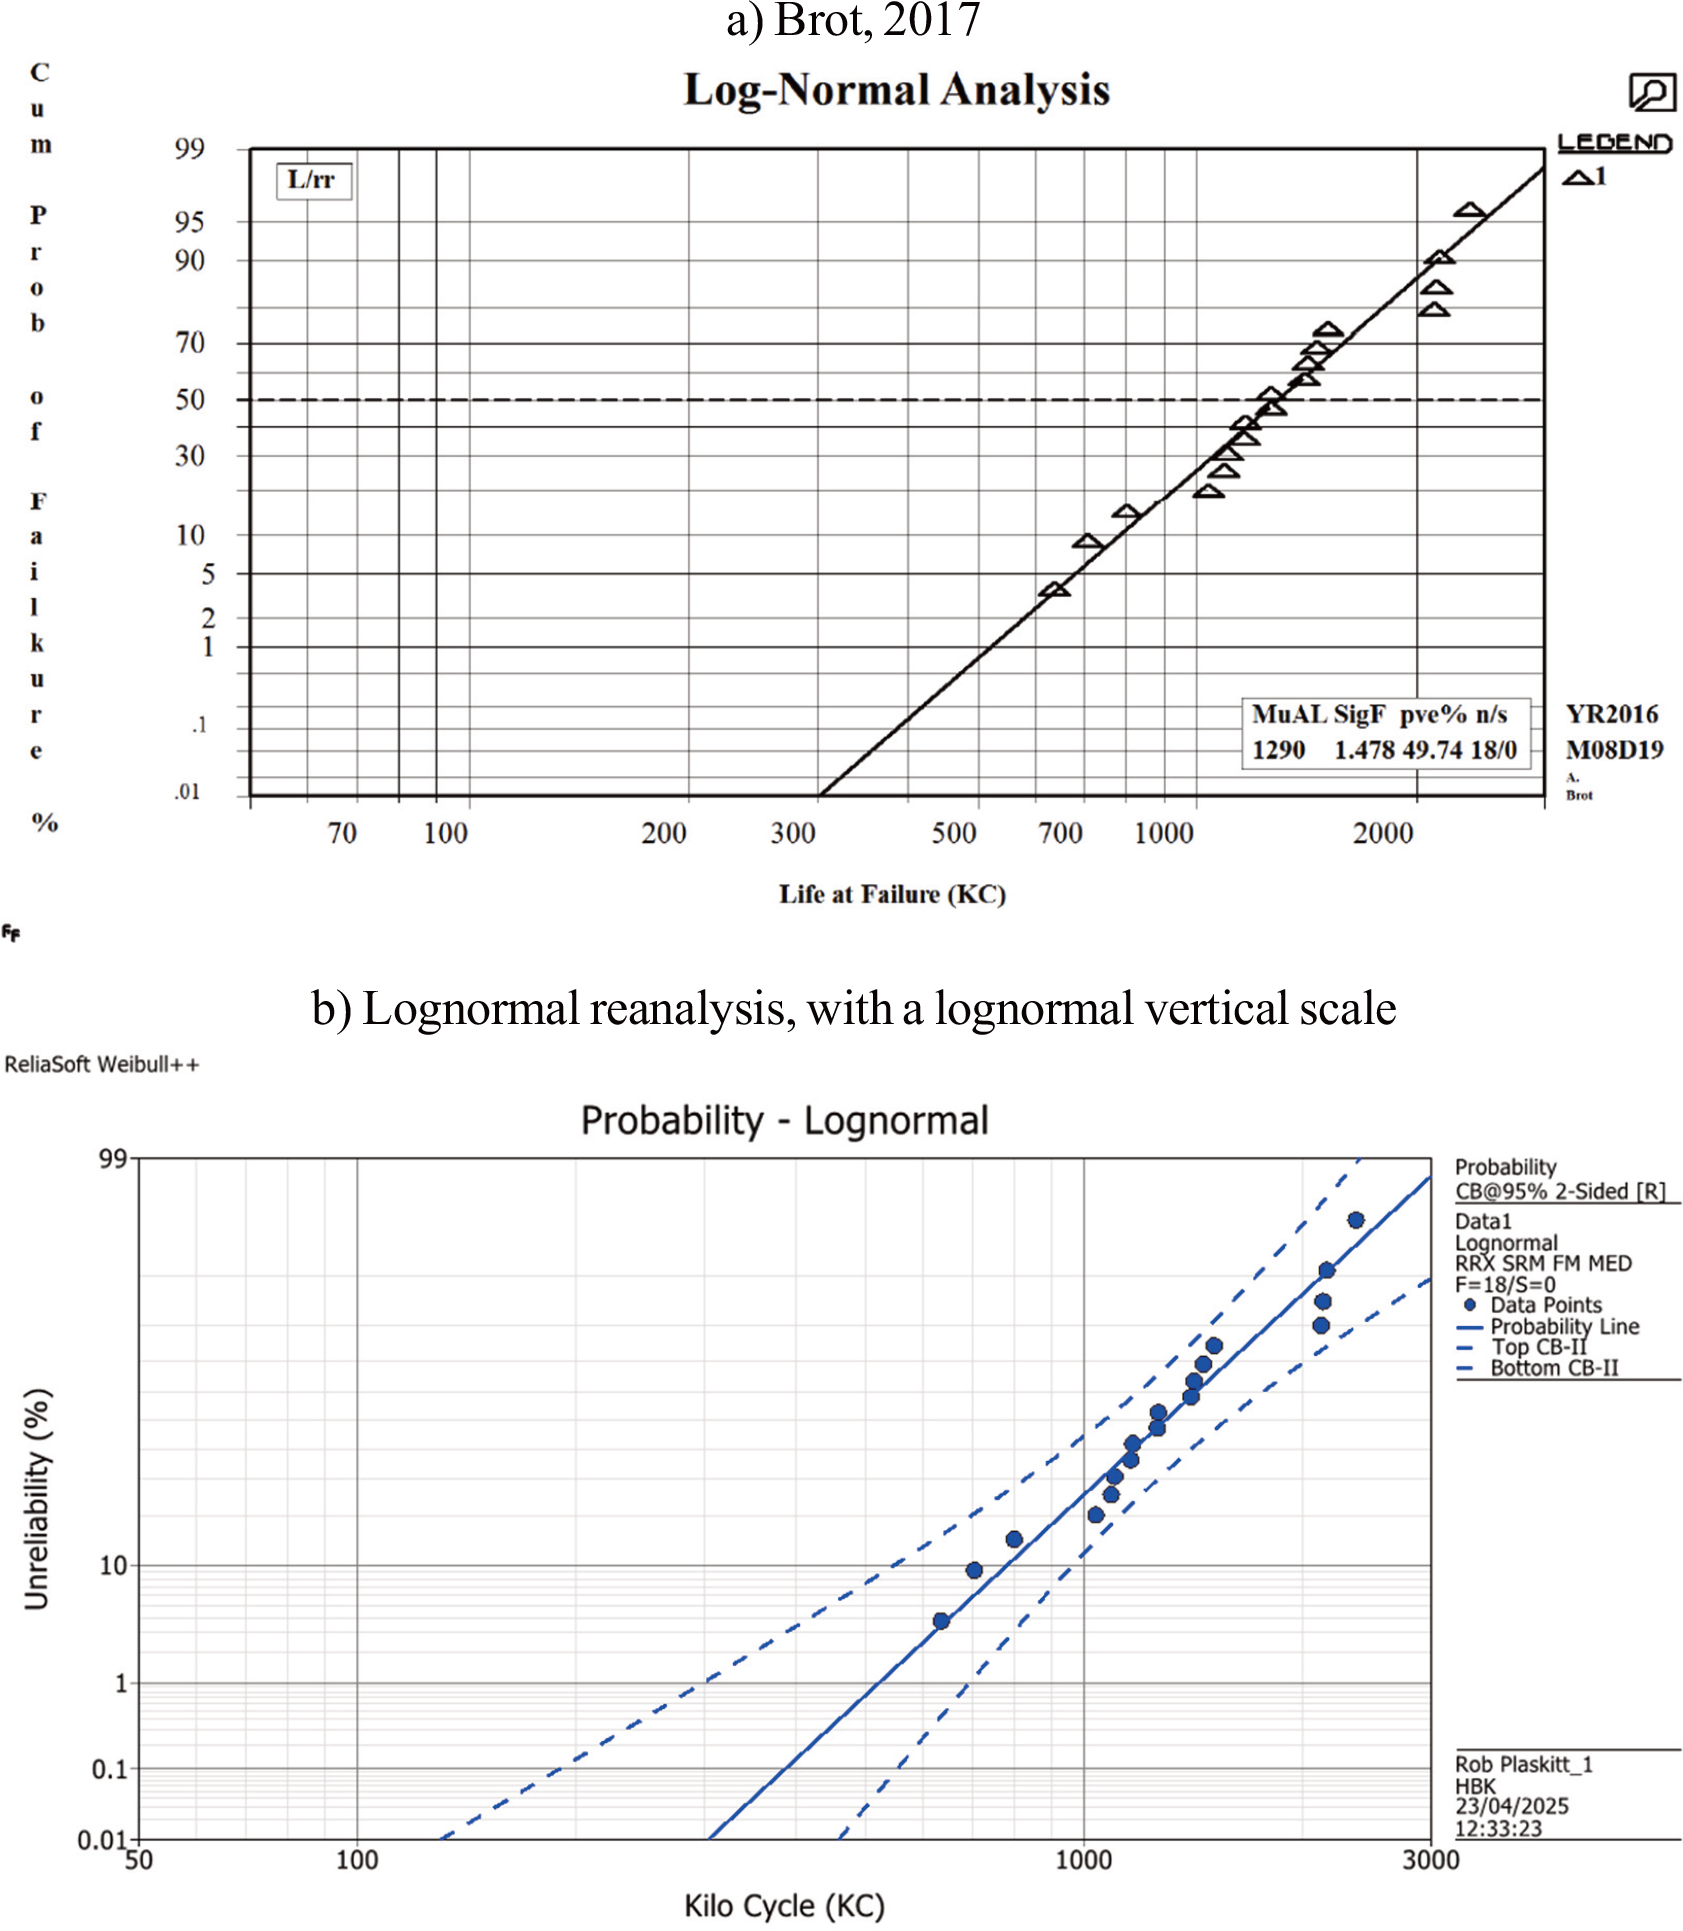
Figure 3.
Lognormal distribution of Schijve dataset fatigue test results a) reproduced from Brot (2017, figure 19), and b) reanalysis for this paper.
Table 2.
Extrapolated fatigue life (Kilo Cycles) at probability of failure at 0.01% (=99.99% reliability).
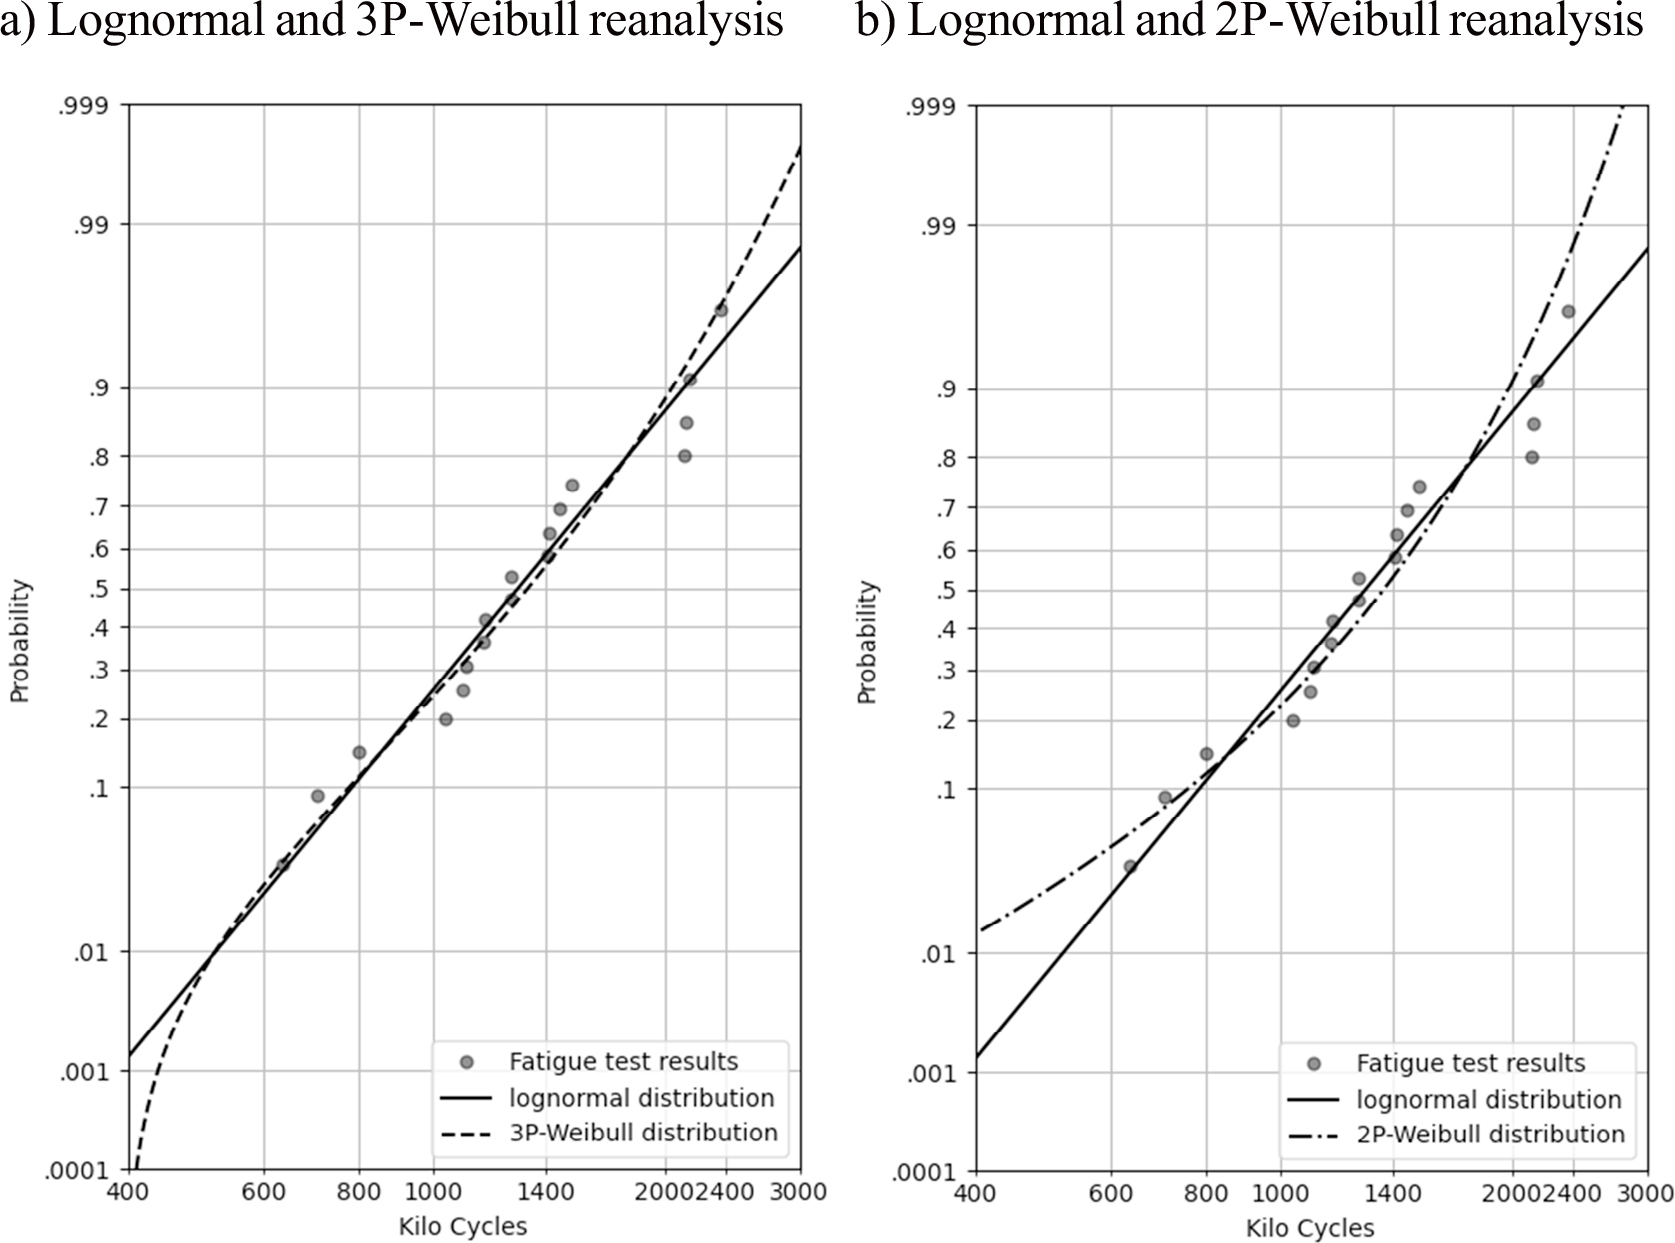
Figure 4.
Lognormal and Weibull distribution of Schijve dataset fatigue test results a) with 3-parameter Weibull as used in Schijve analysis (2009), and b) with 2-parameter Weibull as used in Brot analysis in (2017).
Table 3.
Extrapolated fatigue life (Kilo Cycles) at probability of failure (reliability).
| % Probability of failure (% reliability) | Lognormal | 2-parameter Weibull | 3-parameter Weibull γ (gamma) = 503.4 |
|---|---|---|---|
| 1% (99%) | 521.7 | 363.8 | 582.5 |
| 0.1% (99.9%) | 387.5 | 177.1 | 525.7 |
| 0.01% (99.99%) | 303.4 | 86.3 | 509.7 |
| 0.001% (99.999%) | 245.3 | 42.1 | 505.2 |
| 0.0001% (99.9999%) | 202.8 | 20.5 | 503.9 |
Table 4.
Extrapolated fatigue life normalised to γ(gamma) at probability of failure (reliability).
| % Probability of failure (% reliability) | Lognormal | 2-parameter Weibull | 3-parameter Weibull |
|---|---|---|---|
| 1% (99%) | 1.036 | 0.723 | 1.157 |
| 0.1% (99.9%) | 0.770 | 0.352 | 1.044 |
| 0.01% (99.99%) | 0.603 | 0.171 | 1.013 |
| 0.001% (99.999%) | 0.487 | 0.084 | 1.004 |
| 0.0001% (99.9999%) | 0.403 | 0.041 | 1.001 |
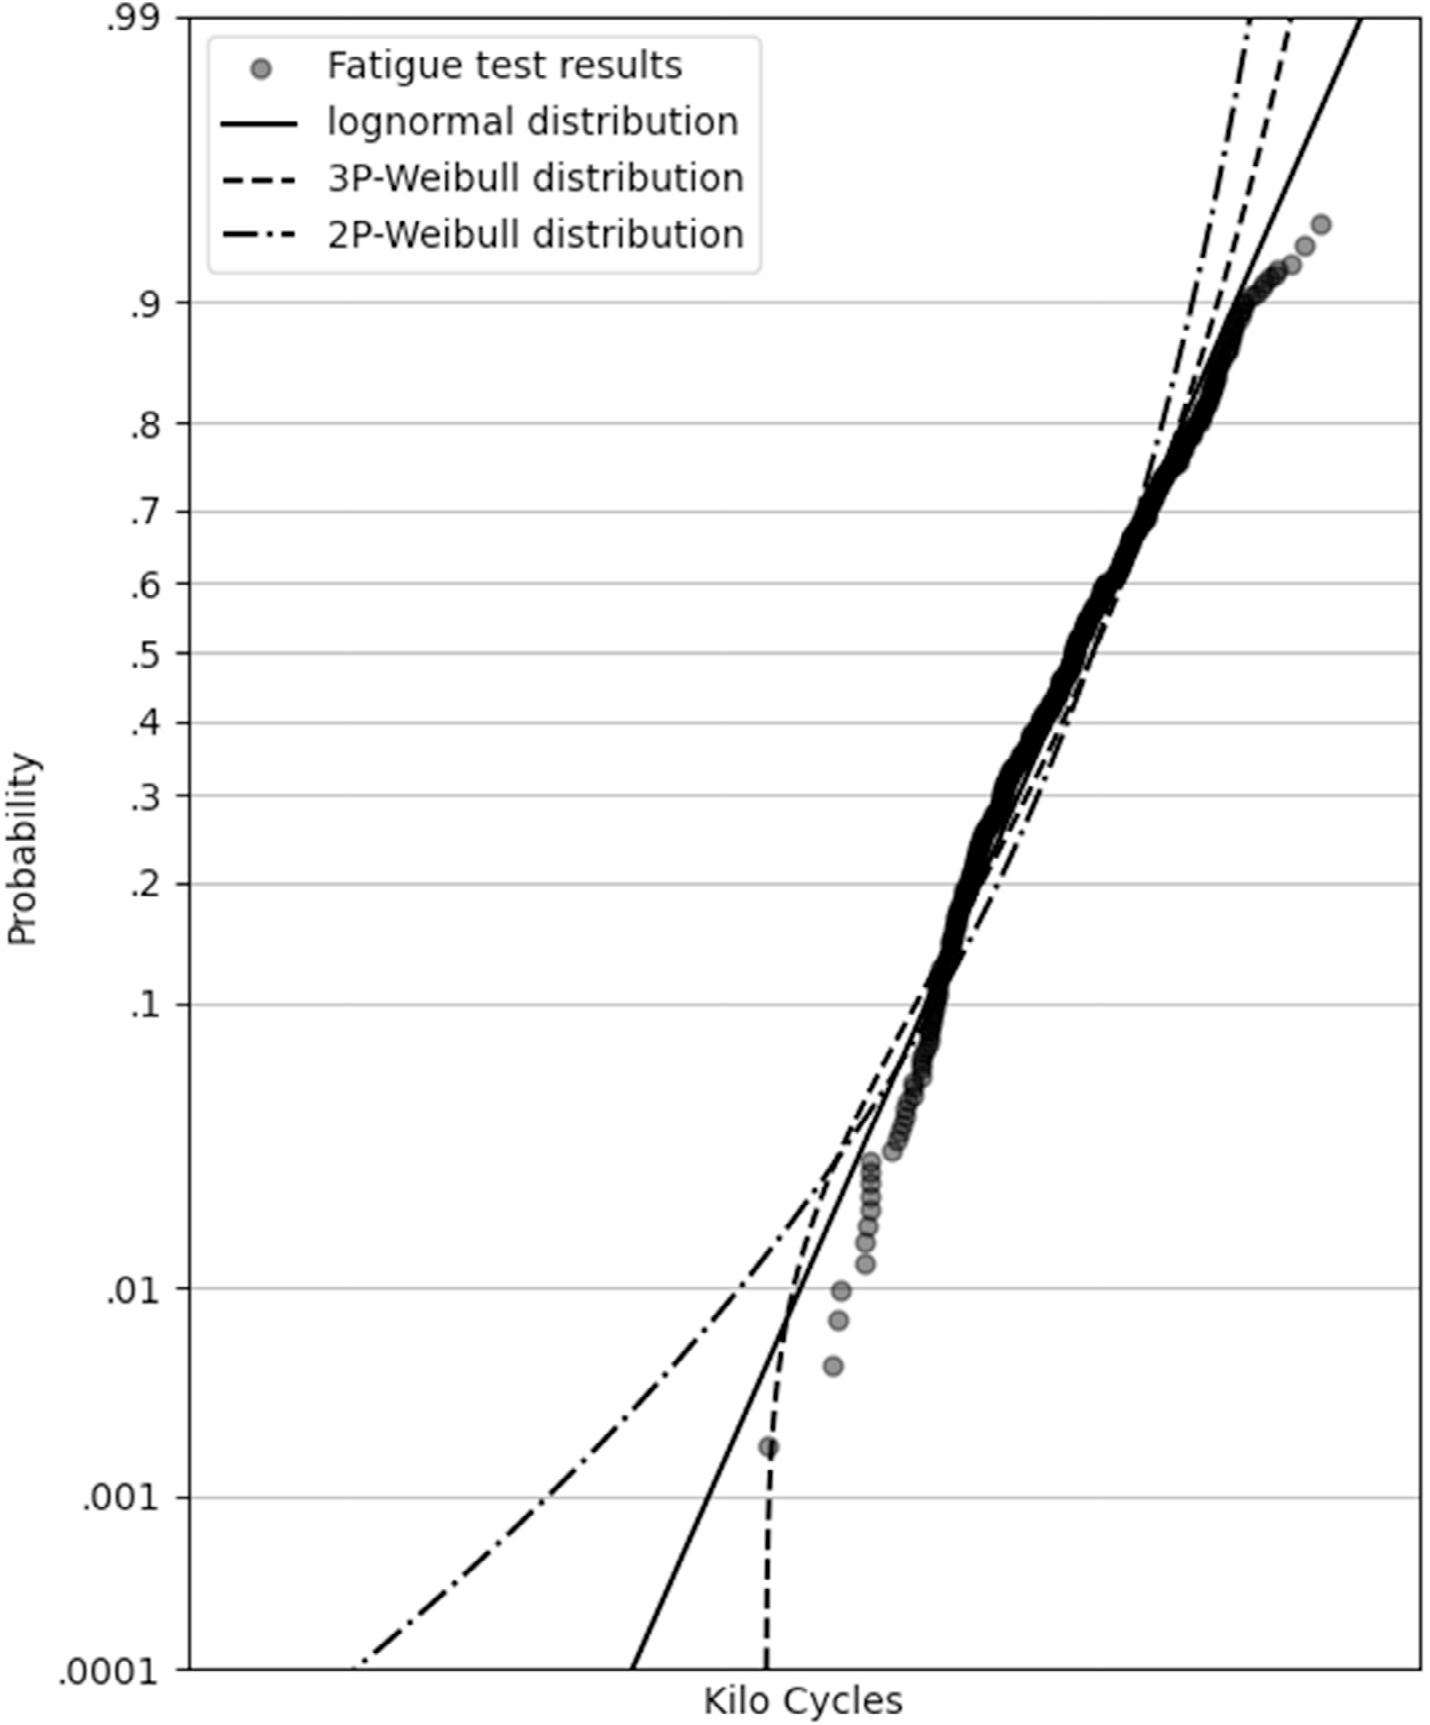
Figure 5.
Lognormal and 2- and 3-parameter Weibull distributions of HBK dataset (logarithmic x-axis with numbers excluded to maintain data confidentiality).
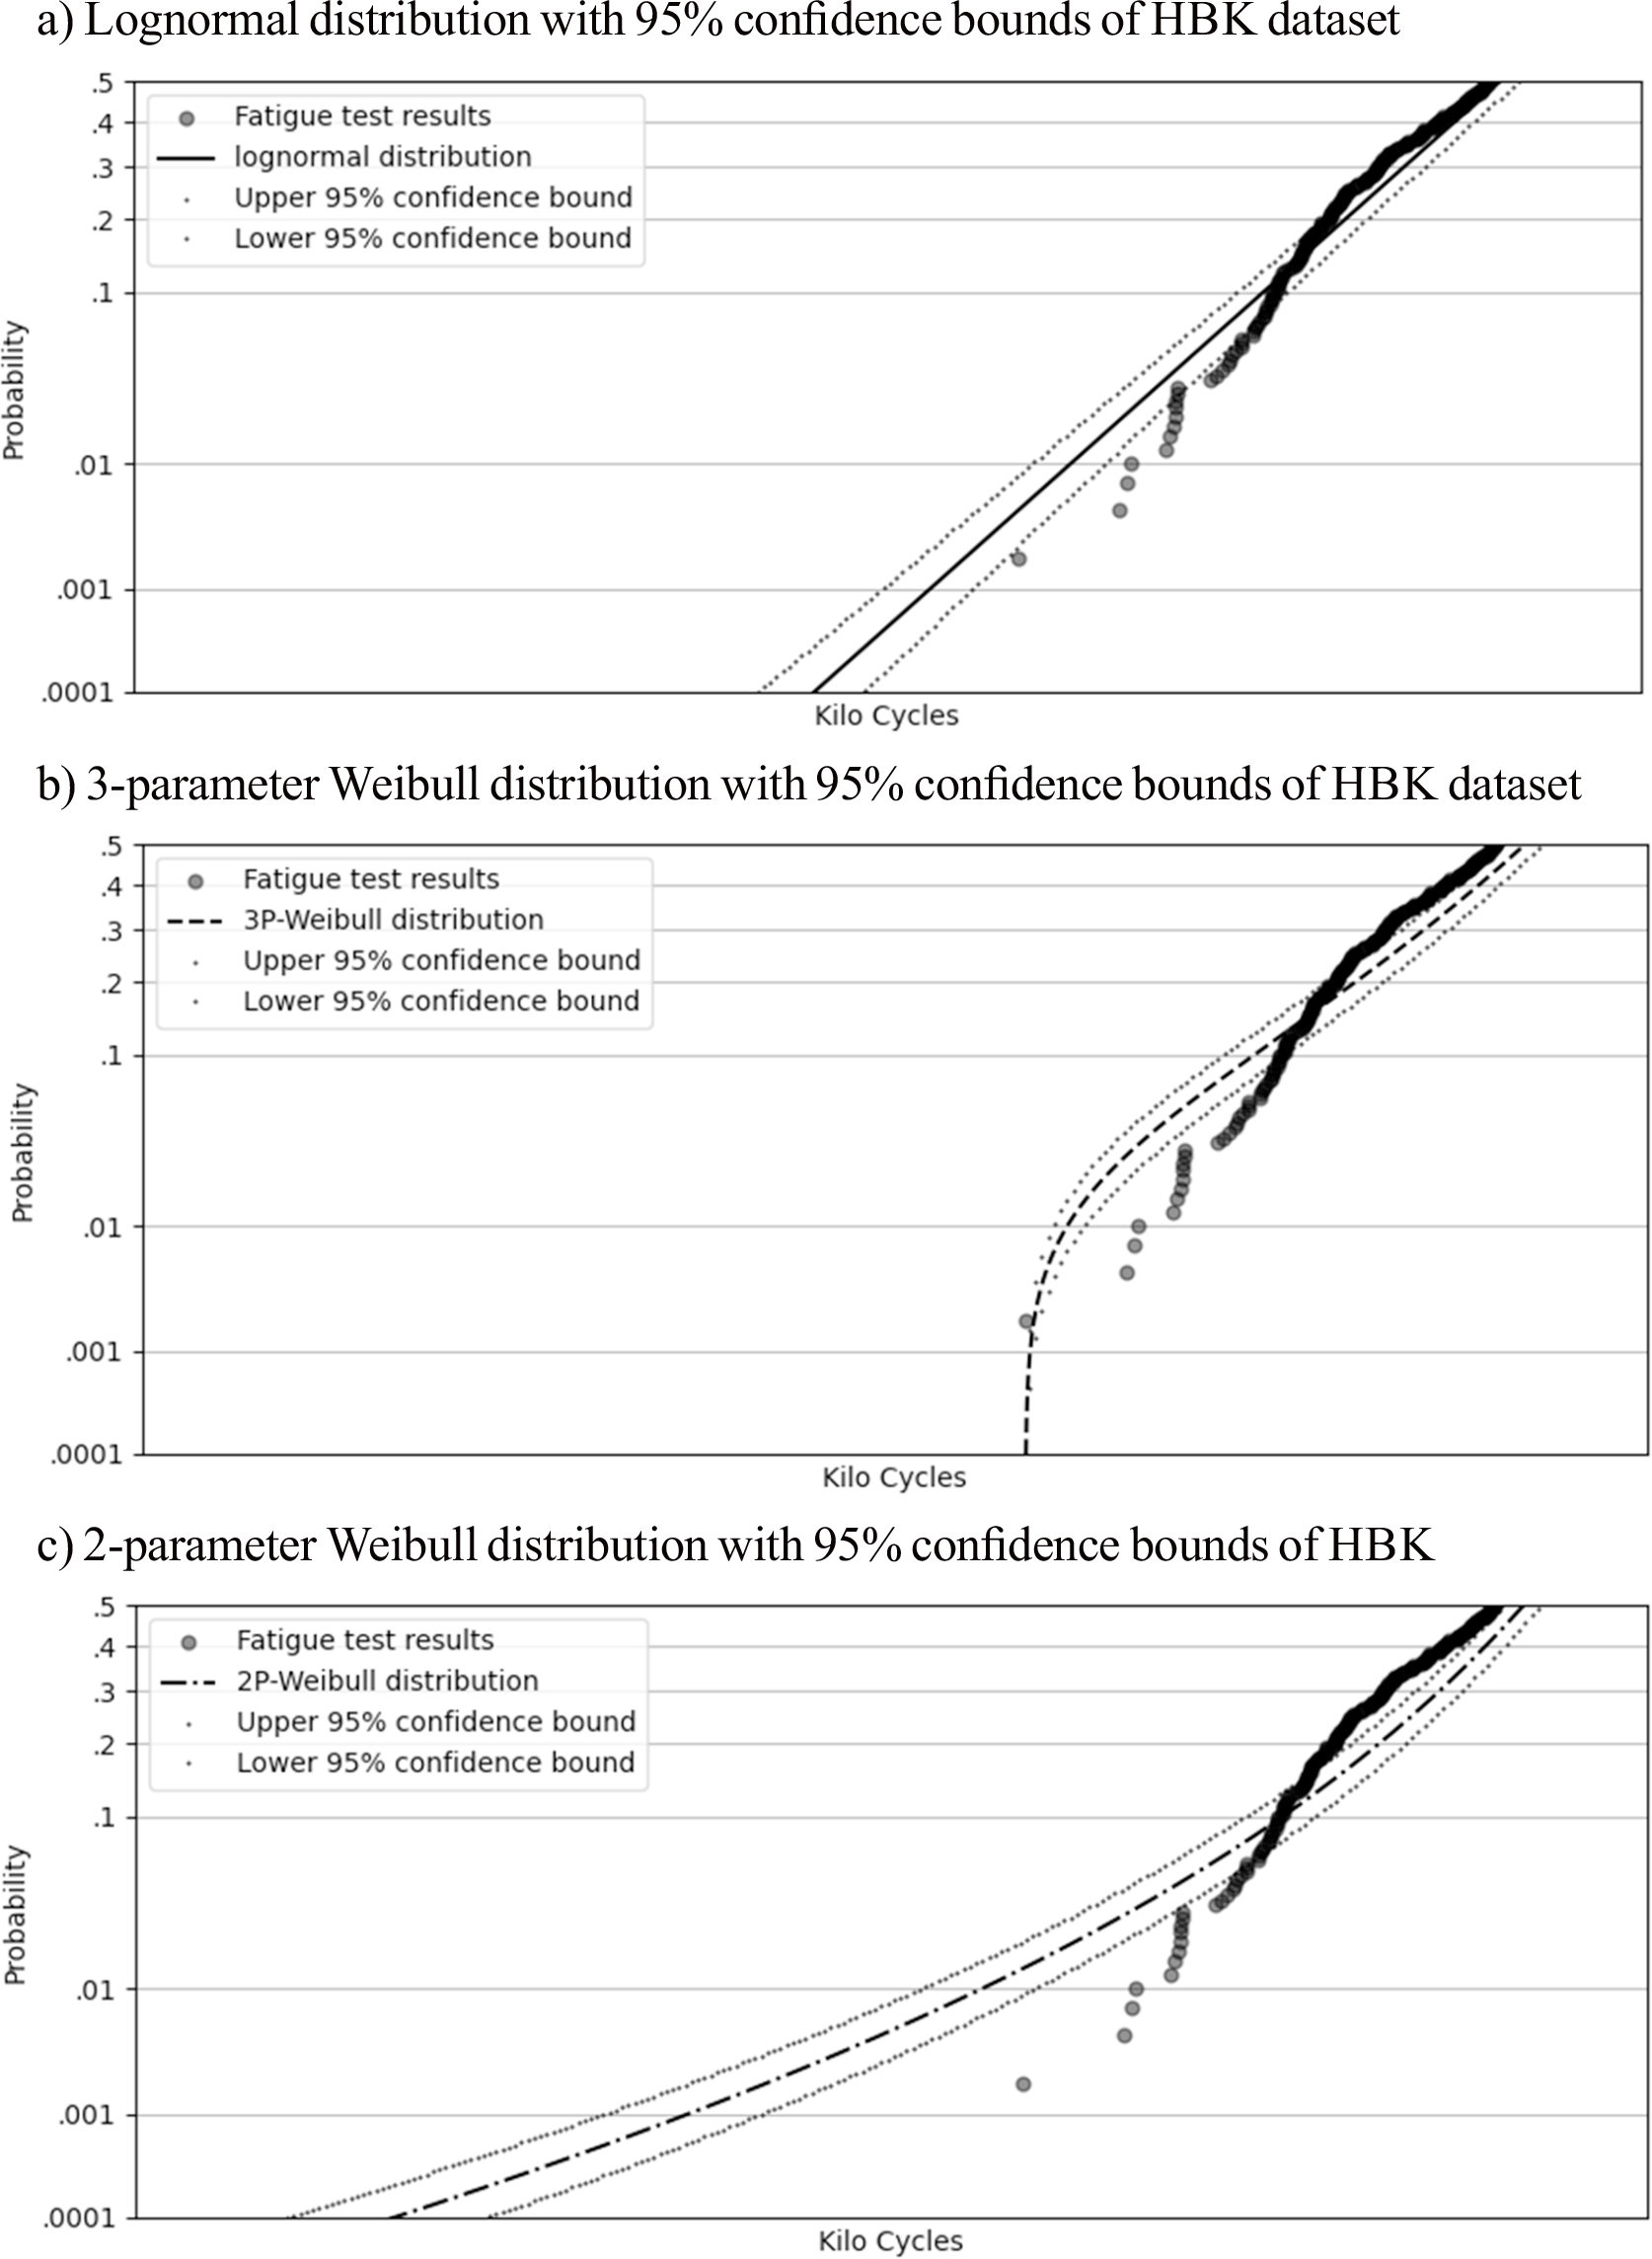
Figure 6.
Lognormal and 2- and 3-parameter Weibull distributions of HBK dataset with confidence bounds for the lower tail of the distributions between 0.01% and 50% (logarithmic x-axis with numbers excluded to maintain data confidentiality).
Table 5.
Extrapolated fatigue life normalised to γ (gamma) at probability of failure (reliability).
| % Probability of failure (% reliability) | Lognormal | 2-parameter Weibull | 3-parameter Weibull |
|---|---|---|---|
| 1% (99%) | 1.383 | 0.786 | 1.293 |
| 0.1% (99.9%) | 0.584 | 0.130 | 1.029 |
| 0.01% (99.99%) | 0.288 | 0.022 | 1.003 |
| 0.001% (99.999%) | 0.155 | 0.004 | 1.000 |
| 0.0001% (99.9999%) | 0.089 | 0.001 | 1.000 |