
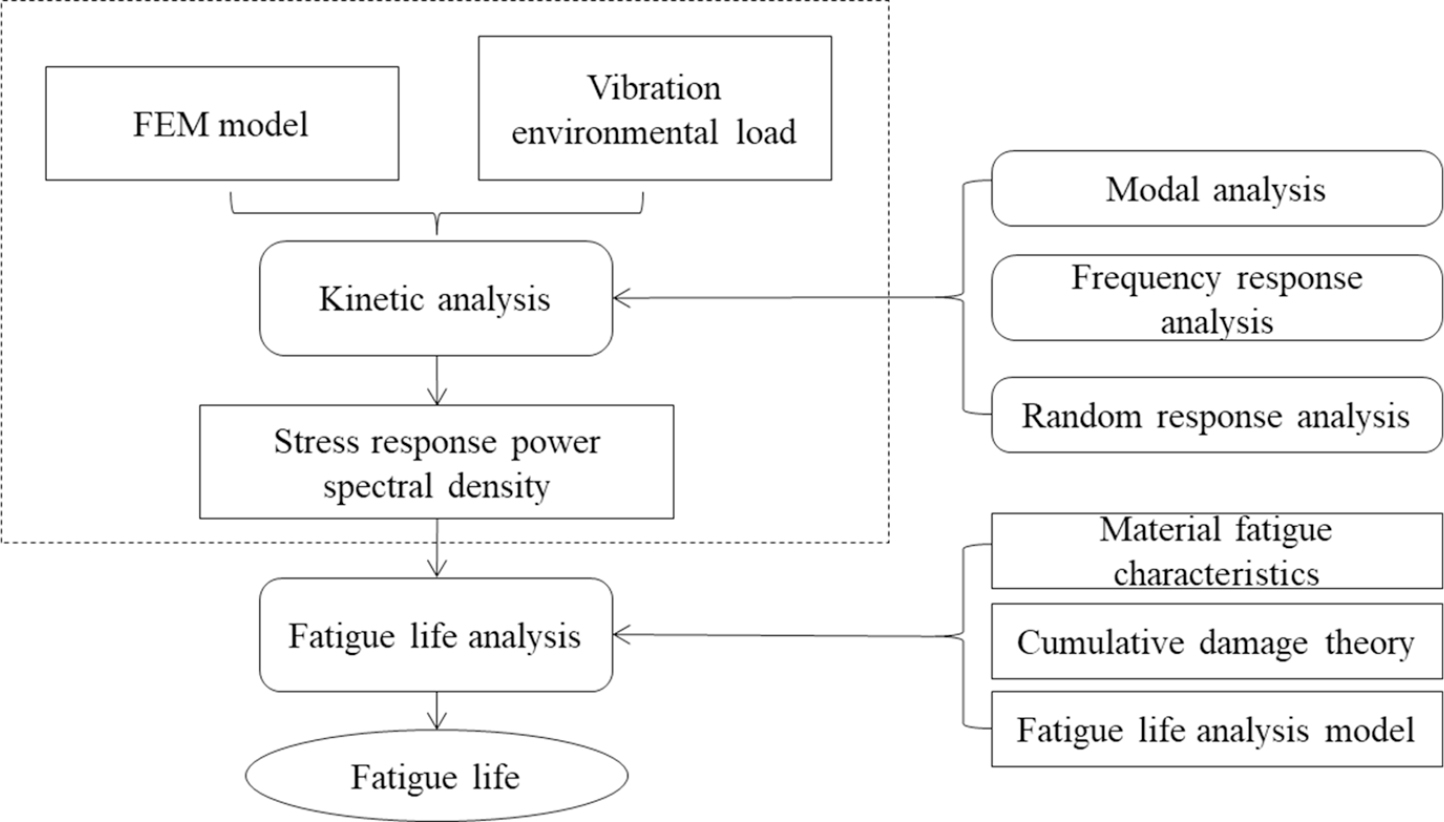
Figure 1.
Frequency-domain method process for vibration fatigue analysis.
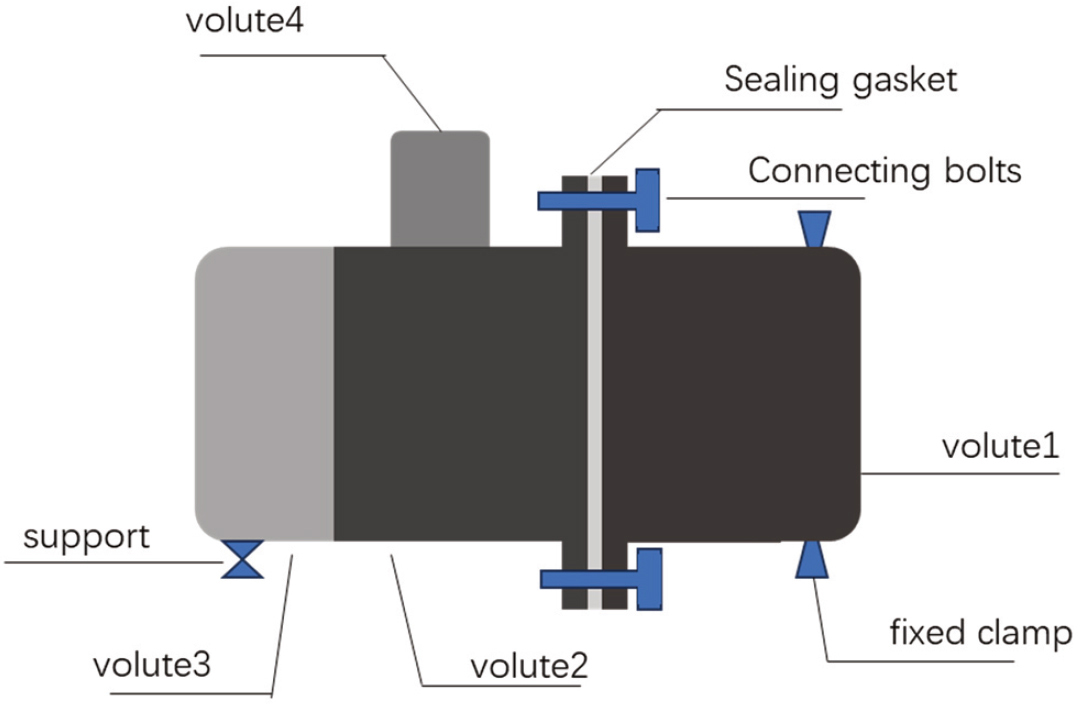
Figure 2.
Schematic diagram of engine fuel accessory structure.
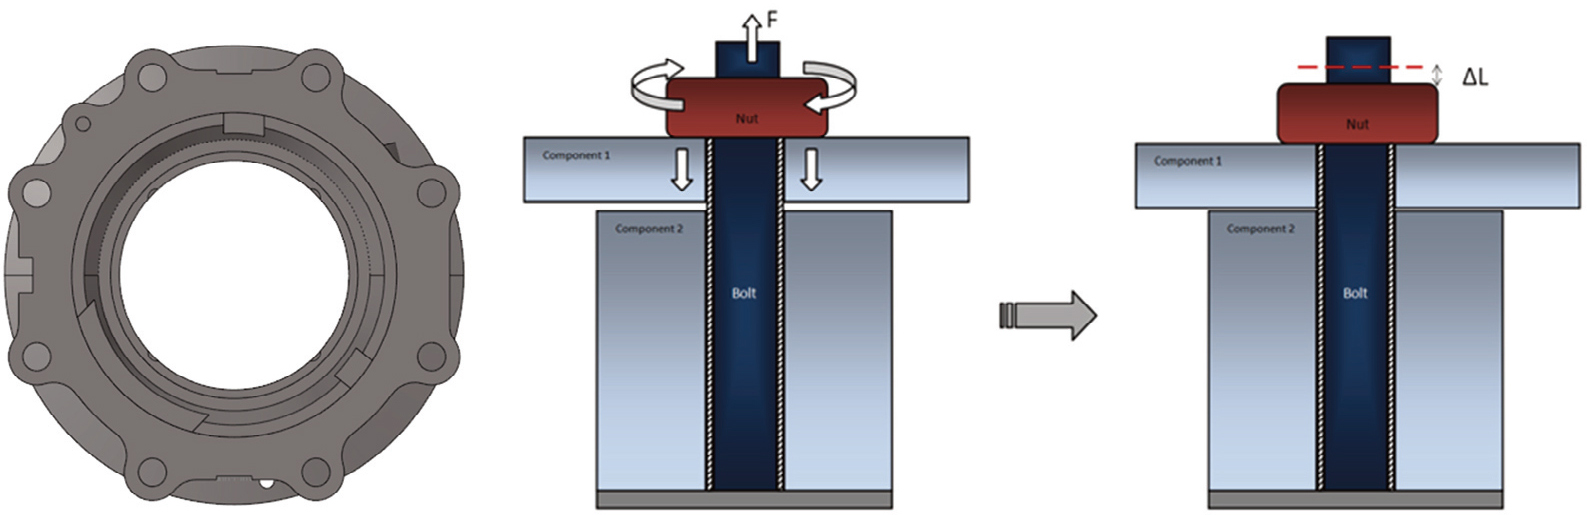
Figure 3.
Distribution and assembly diagram of bolted connections.
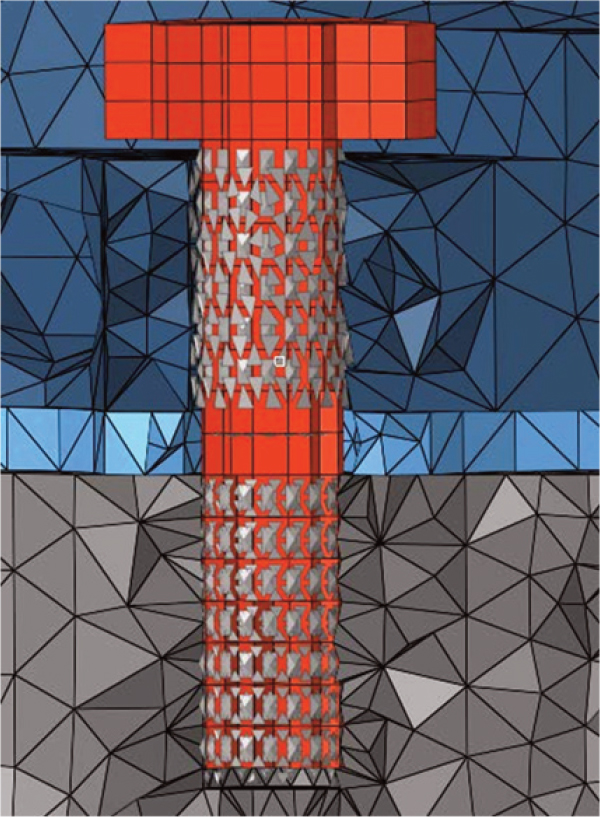
Figure 4.
Schematic diagram of bolt connection details.
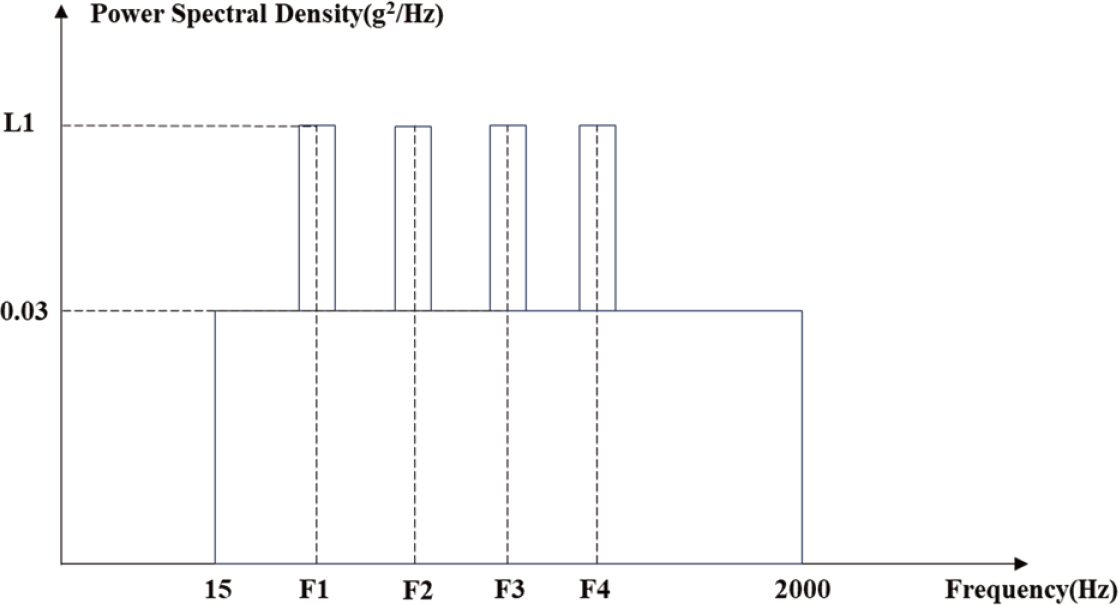
Figure 5.
Vibration excitation spectrum
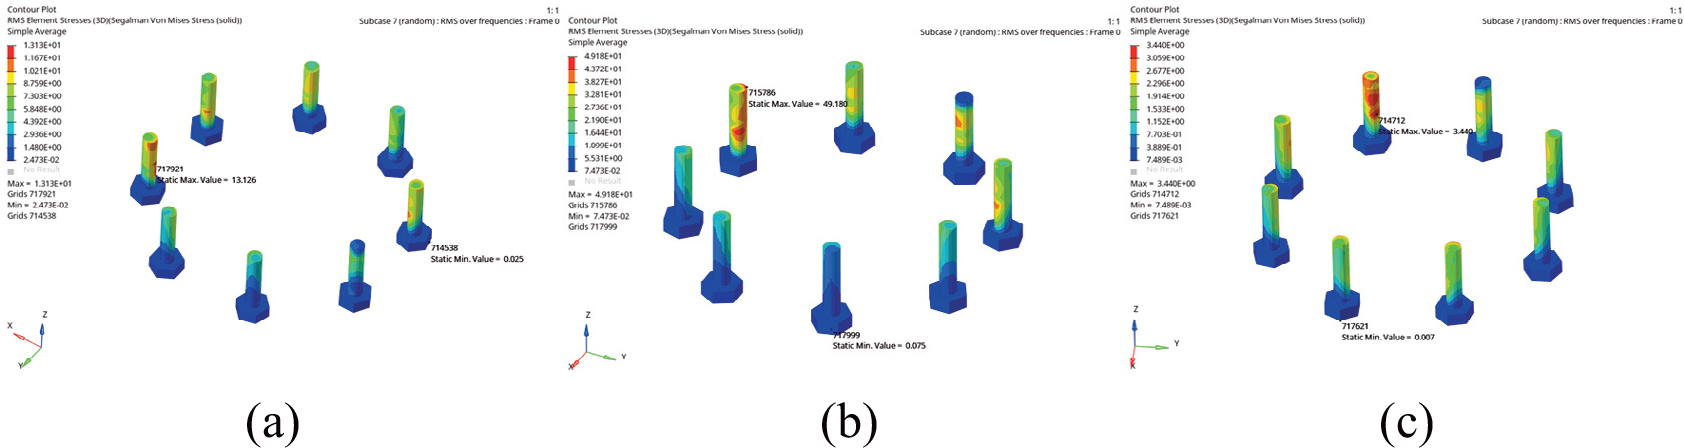
Figure 6.
RMS stress cloud maps of connecting bolts: (a) X-direction, (b) Y-direction, (c) Z-direction.
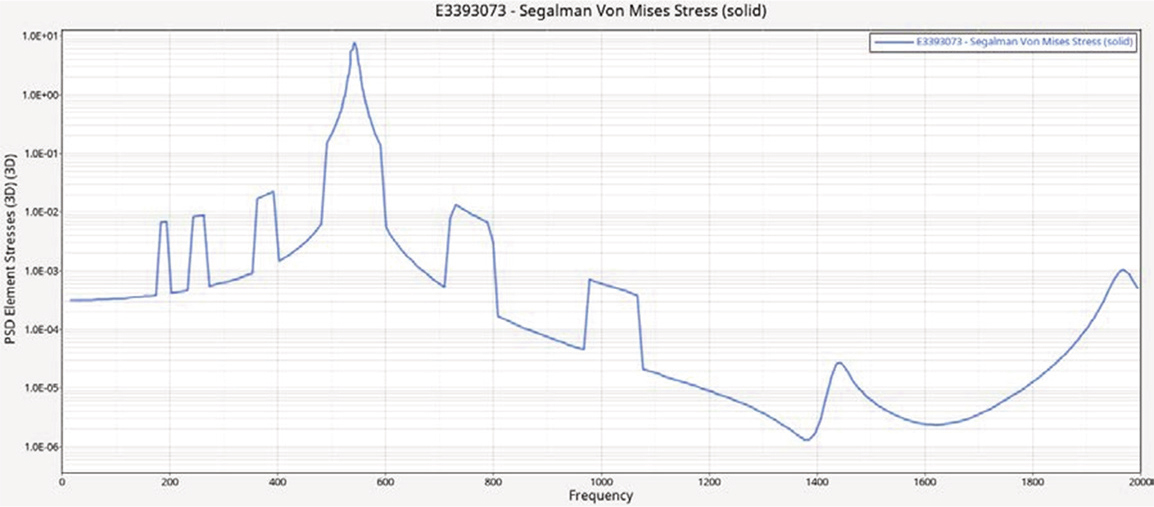
Figure 7.
Stress PSD curve of dangerous points in the X direction.
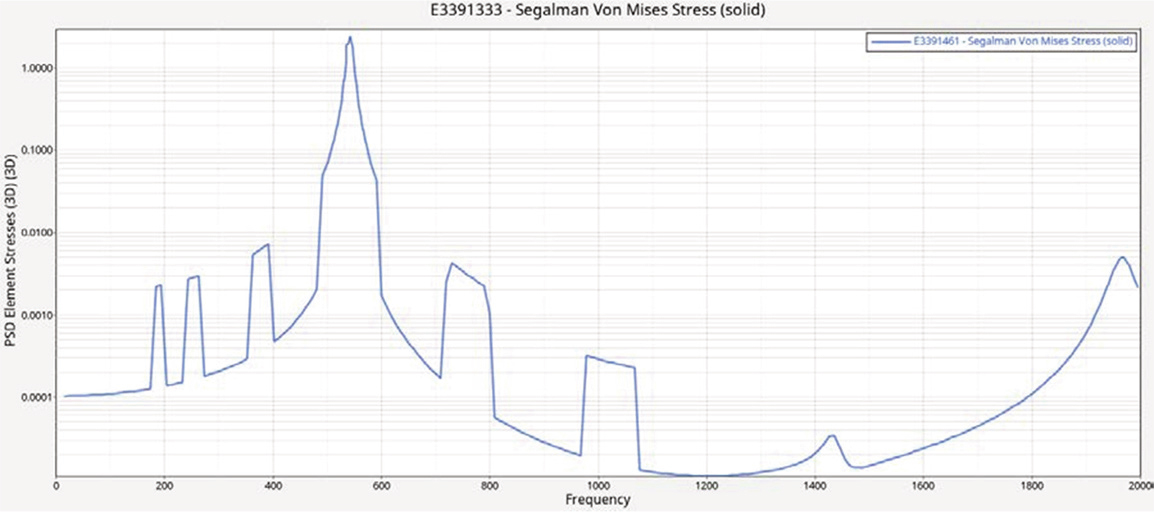
Figure 8.
Stress PSD curve of dangerous points in the Y direction.
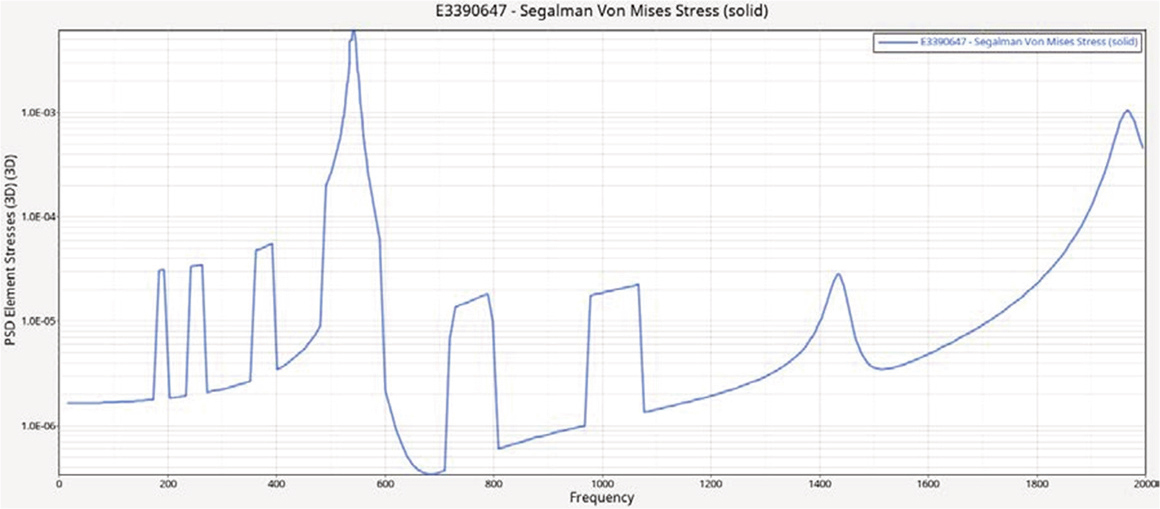
Figure 9.
Stress PSD curve of dangerous points in the Z direction.
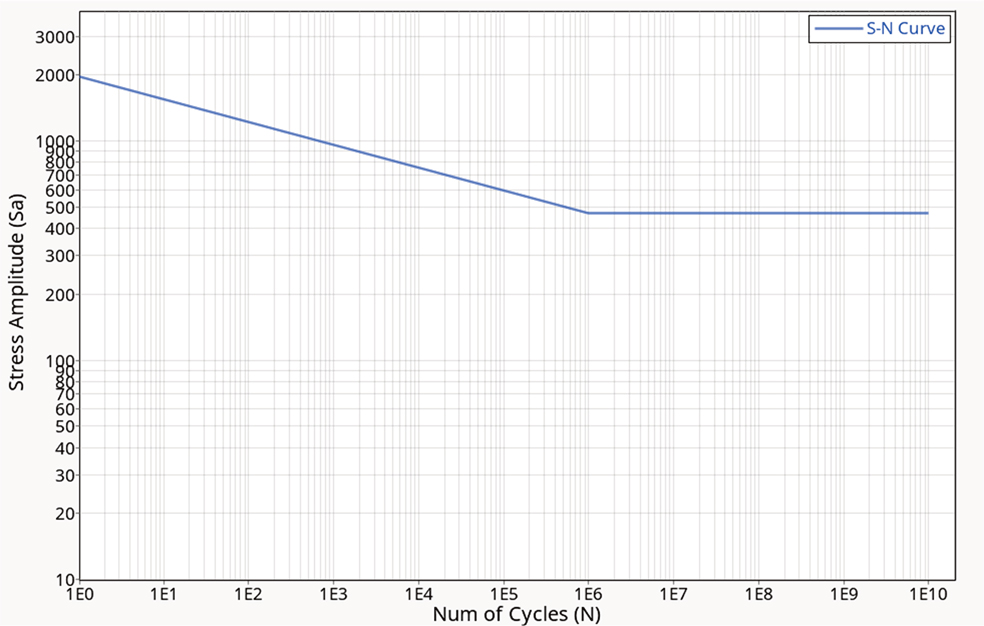
Figure 10.
S–N curve of TC4 material.
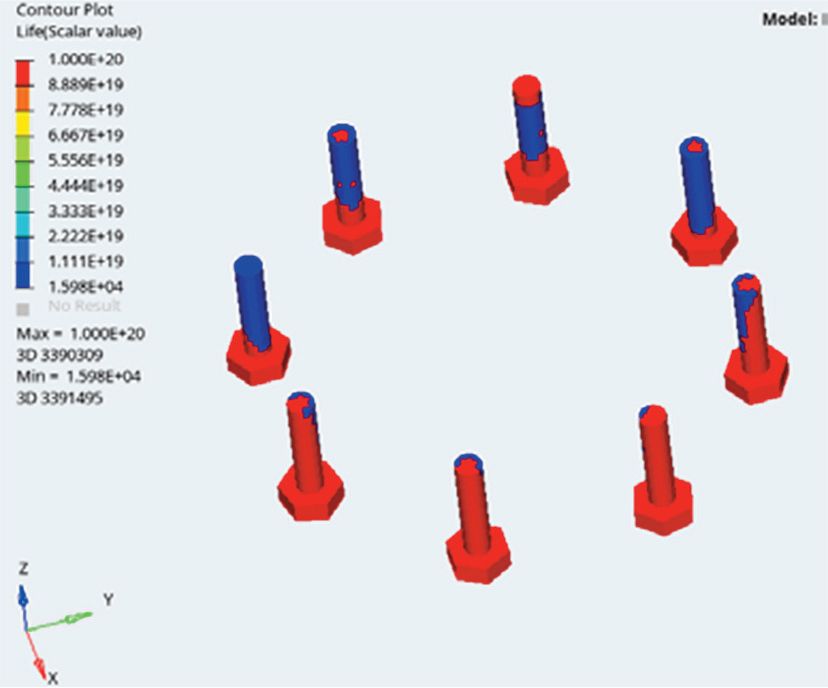
Figure 11.
Fatigue life results of connecting bolts.