
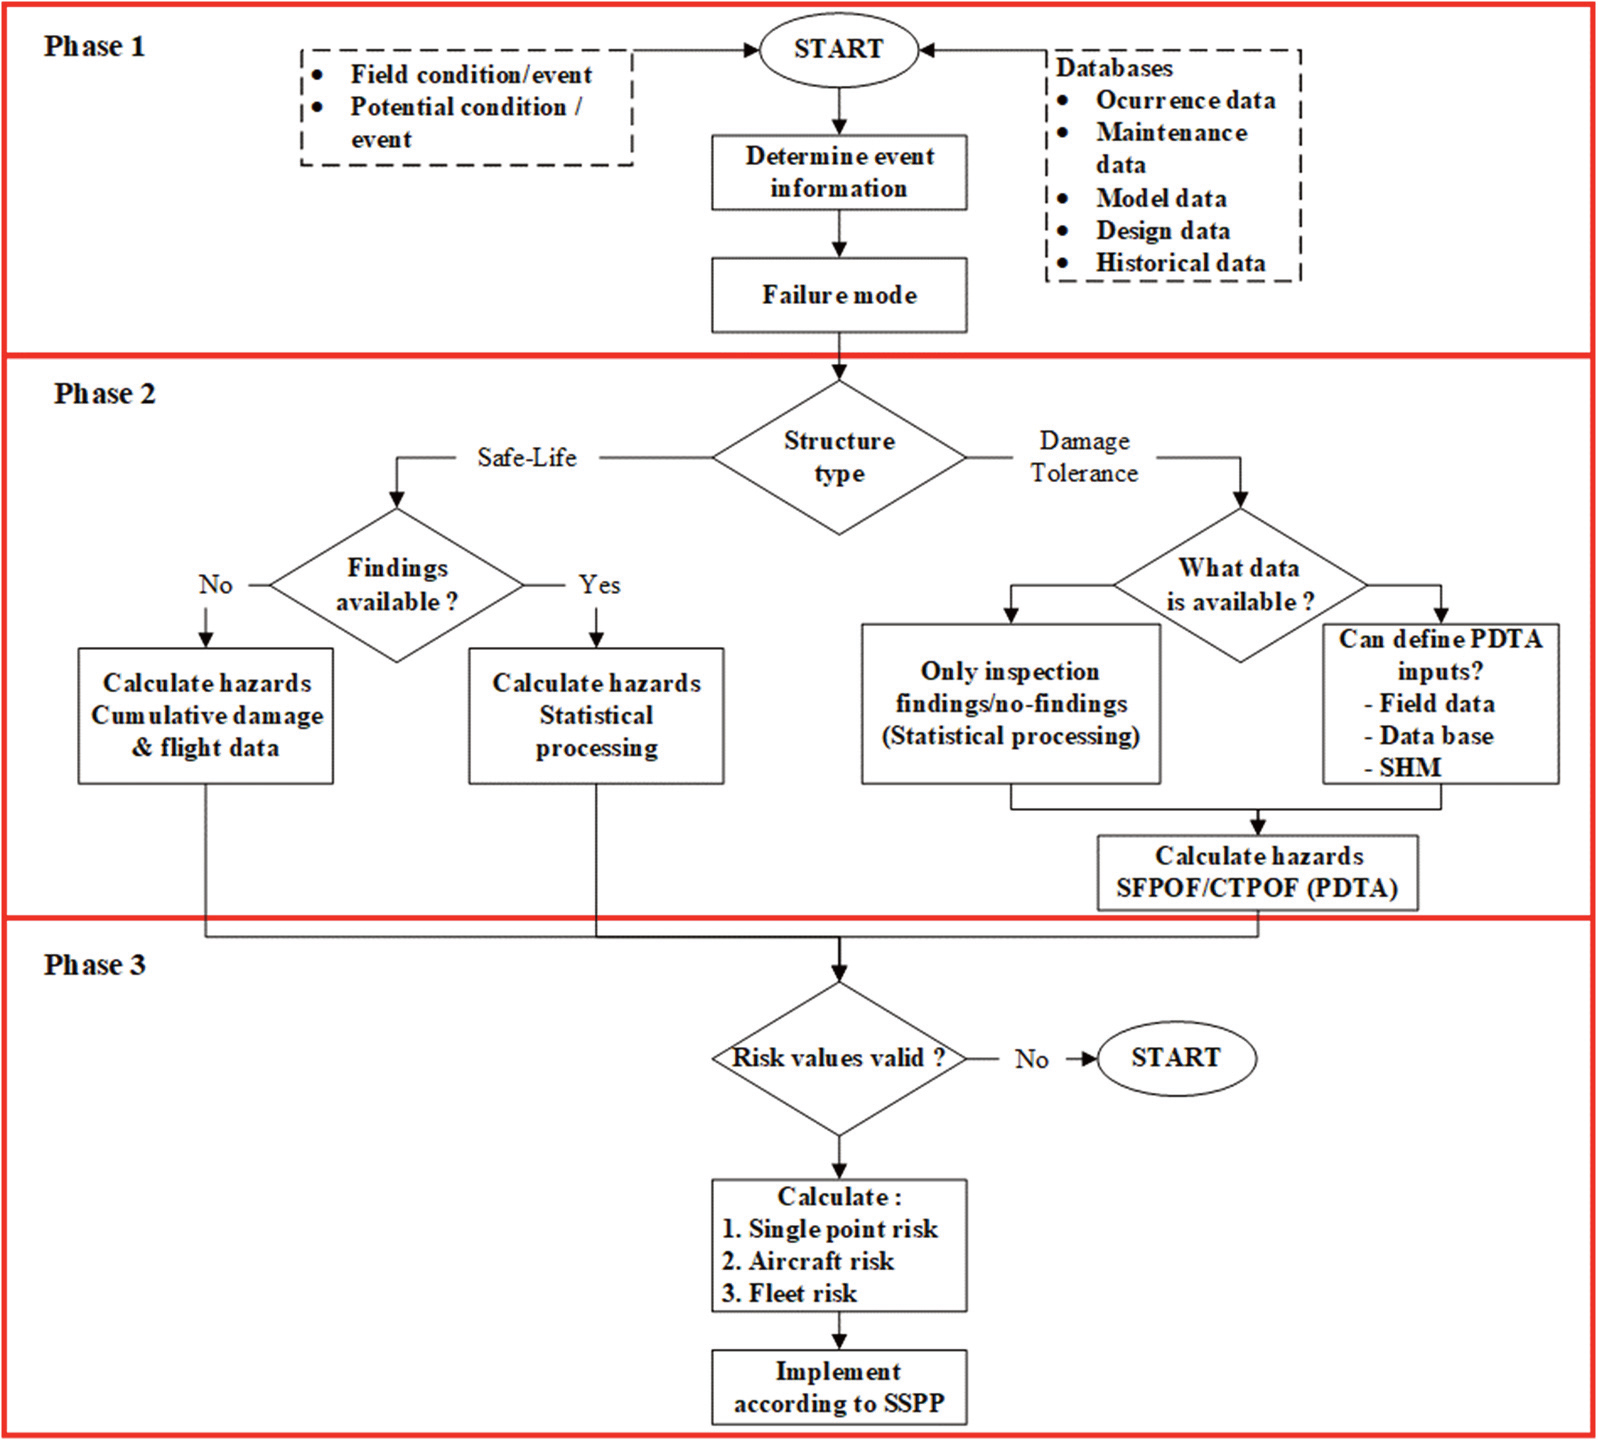
Figure 1.
Risk assessment flowchart.
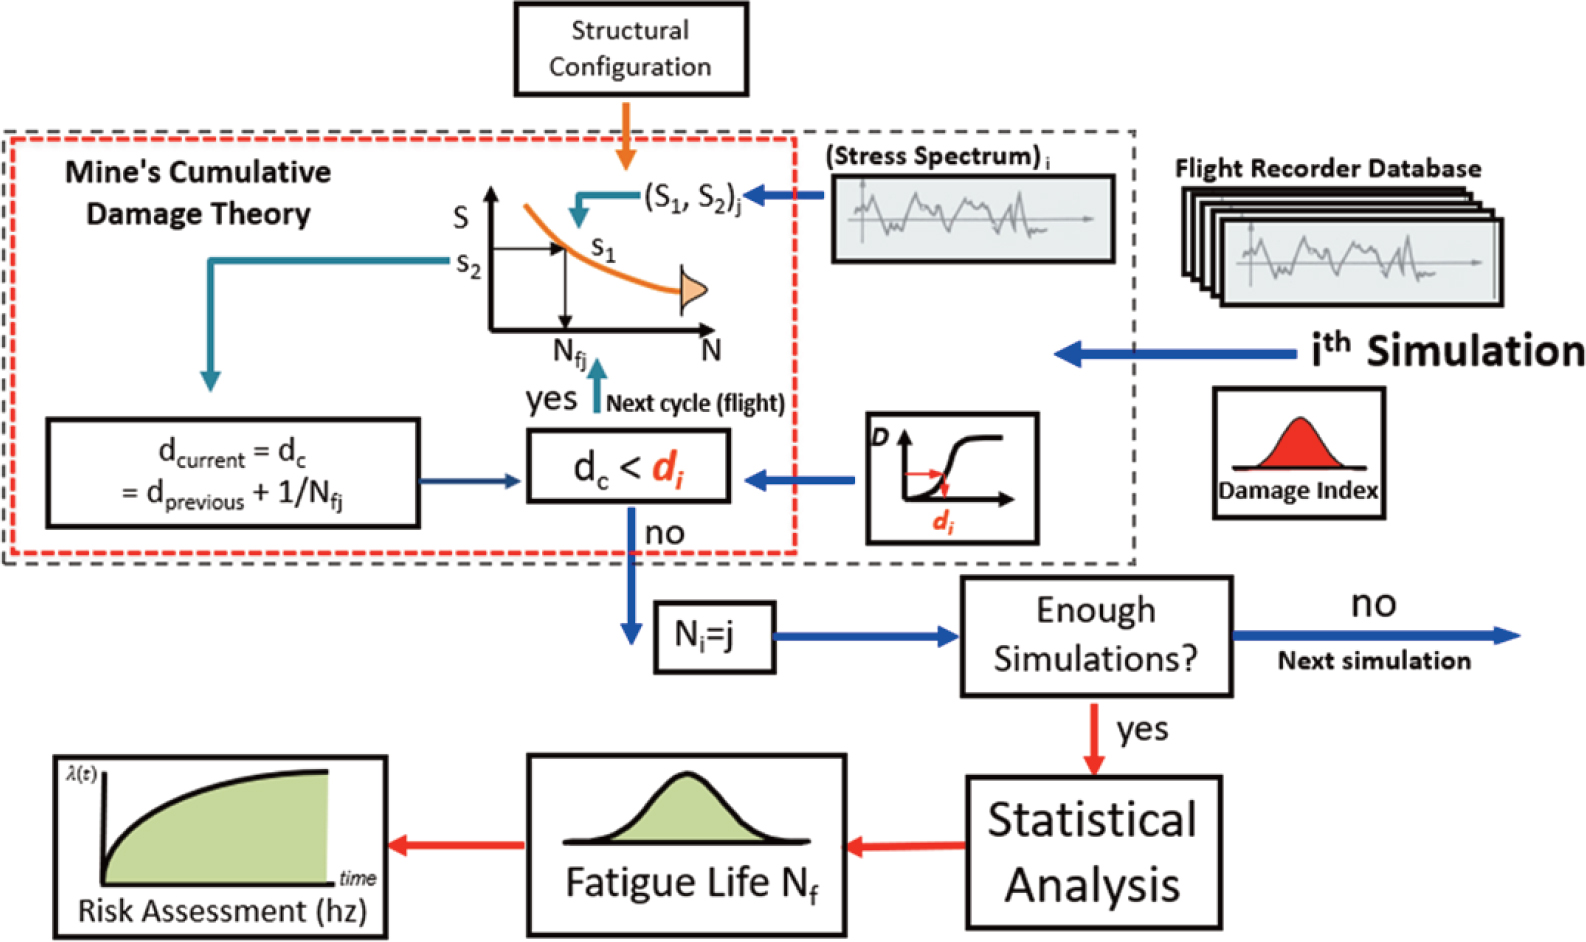
Figure 2.
No findings, probabilistic Safe-Life methodology.
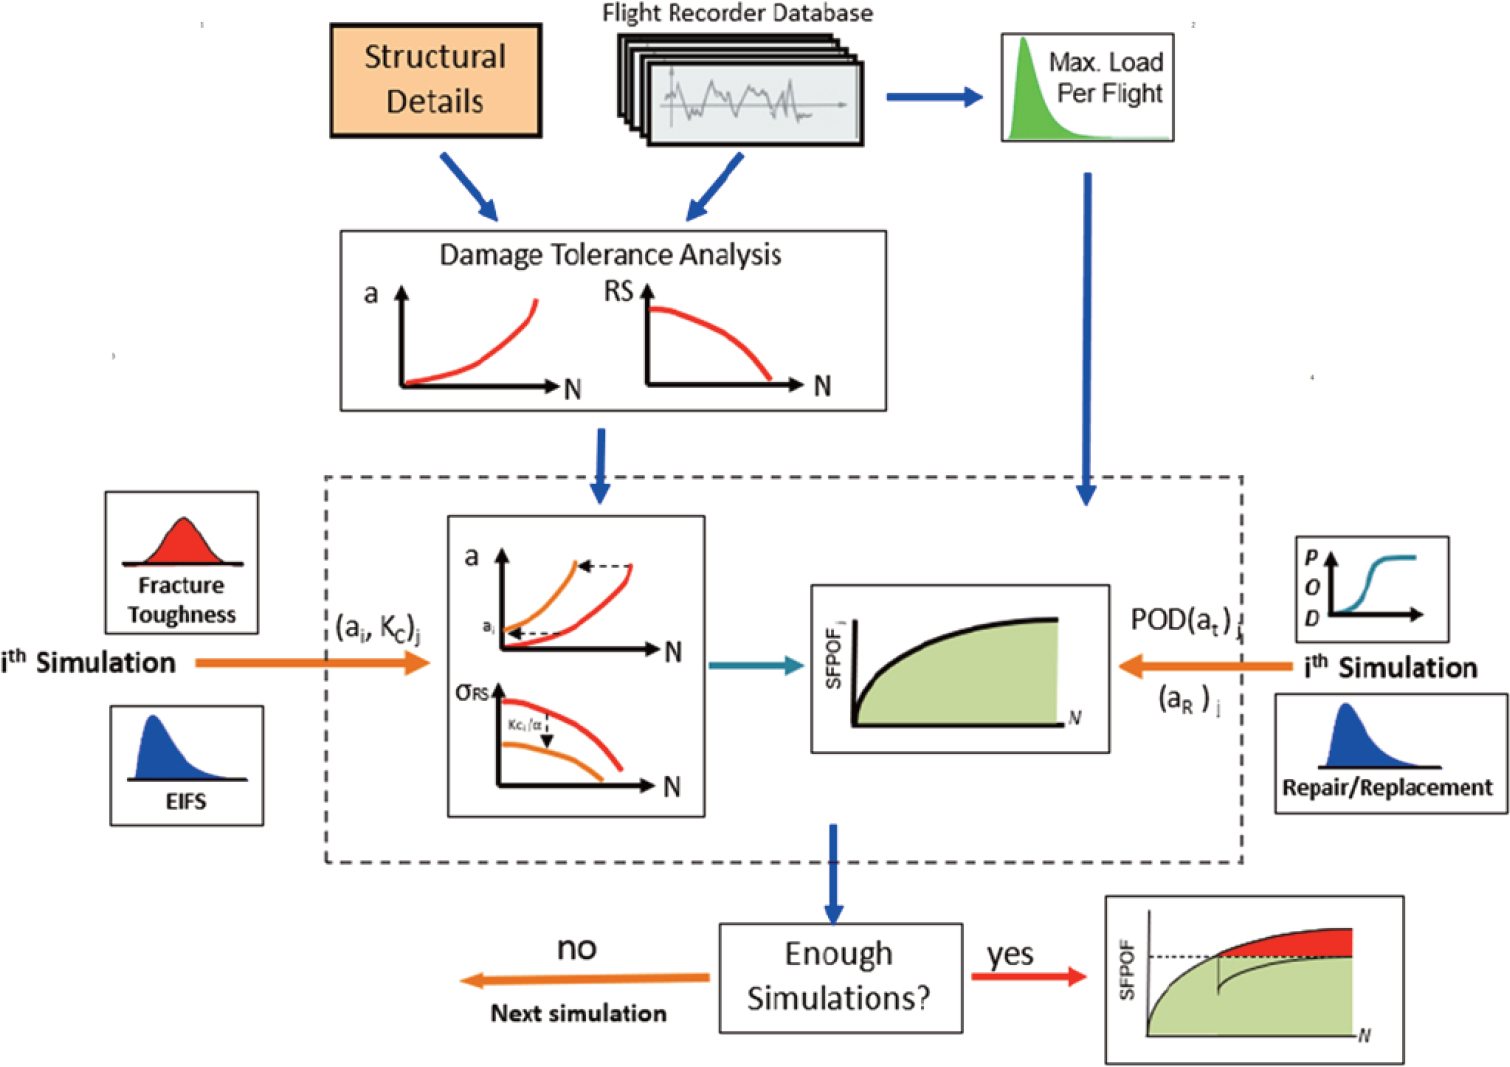
Figure 3.
Damage tolerance PDTA methodology.
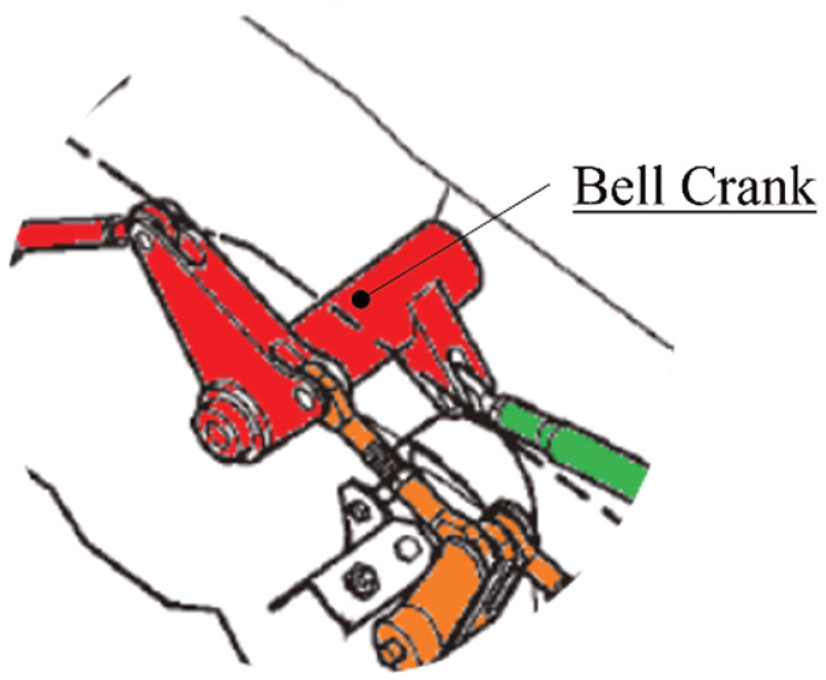
Figure 4.
In-Flight refueling bell crank.
Table 1.
Example of data for Safe-Life analysis (extract).
| Aircraft actual FH | Tail number | Suspension (FH) | Finding (FH) |
|---|---|---|---|
| 5954 | 1001 | 5954 | |
| 6001 | 1002 | 3783 | |
| 5189 | 1003 | 4088 | |
| 6198 | 1004 | 6198 |
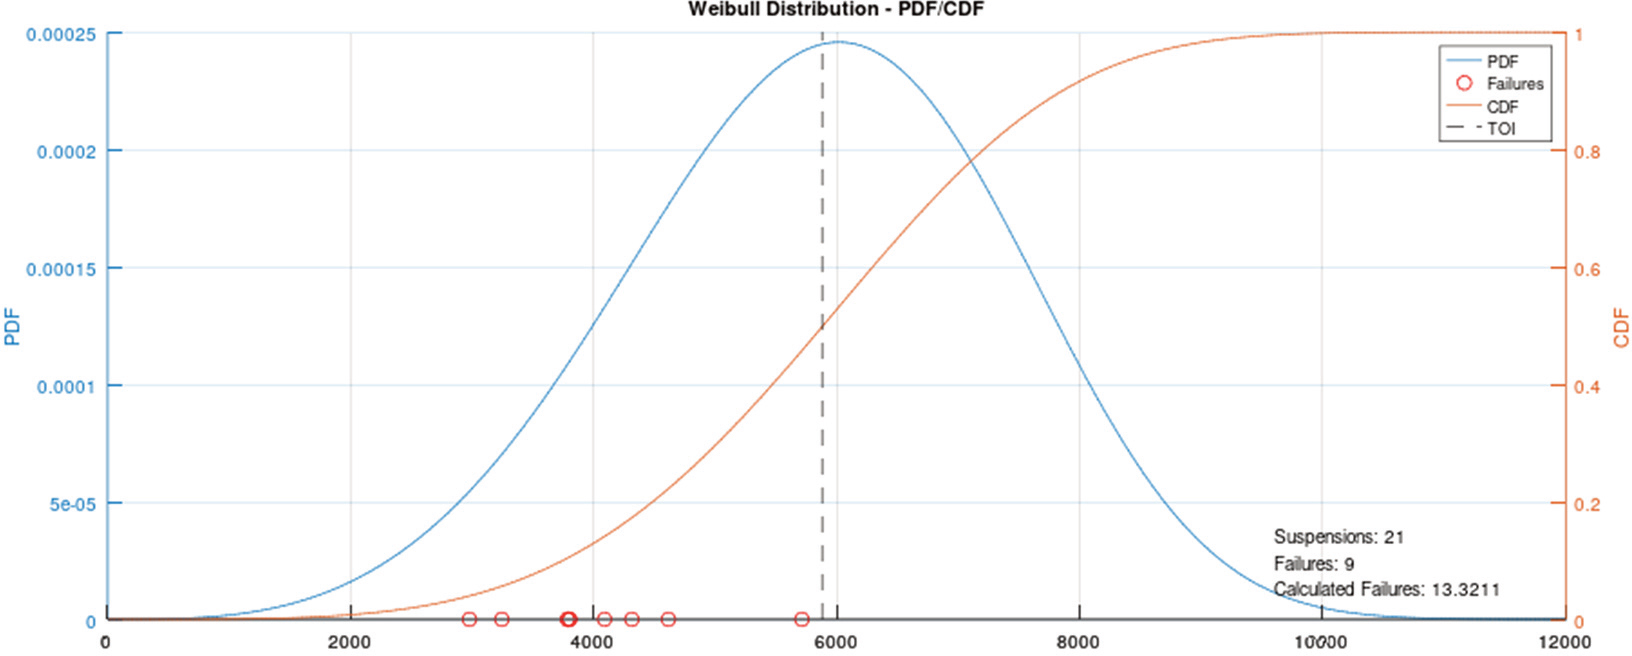
Figure 5.
Safe-Life, Bell Crank Weibull distribution.
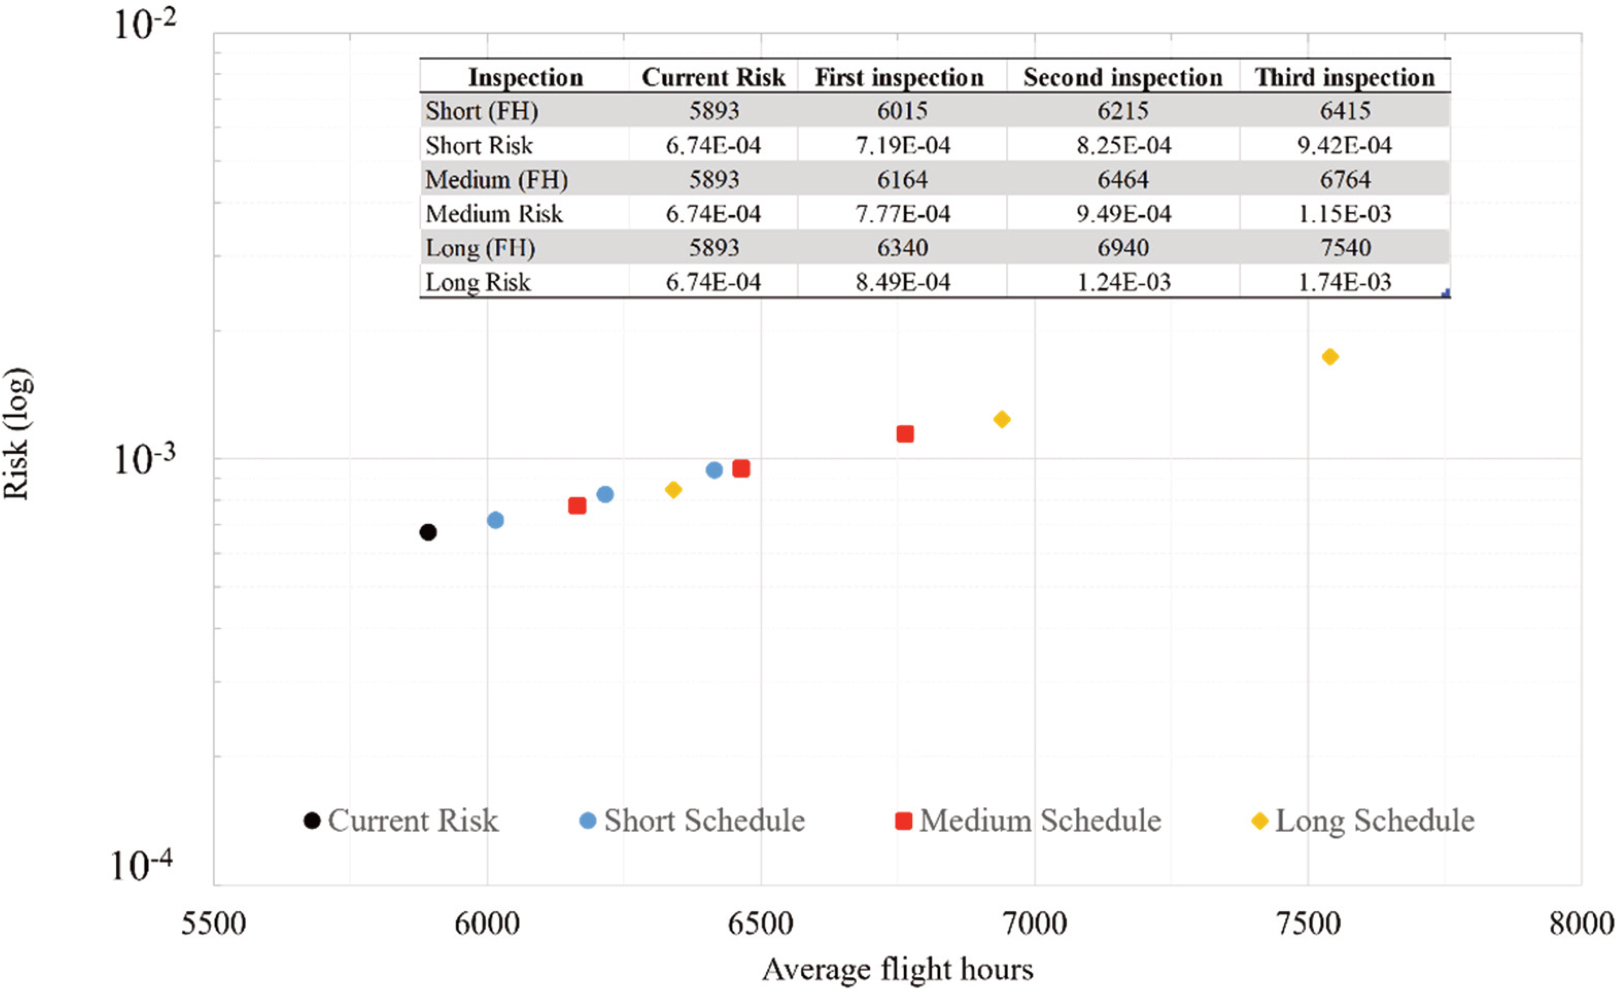
Figure 6.
Fleet risk comparison with different inspection intervals.
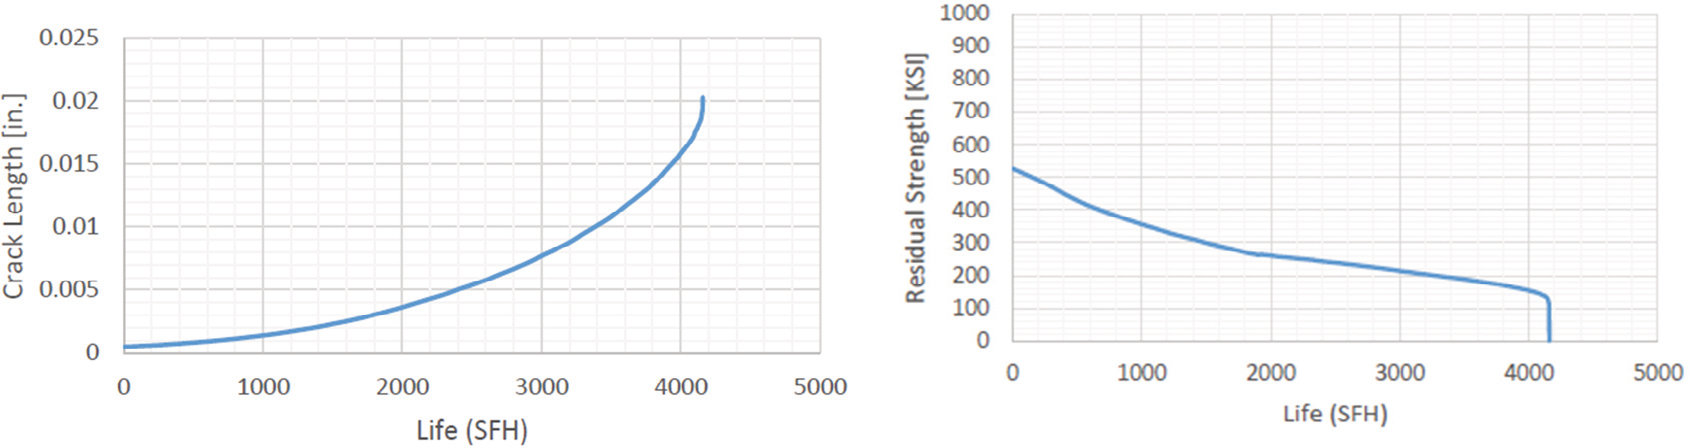
Figure 7.
Crack growth analysis (left) and the residual strength calculation (right).
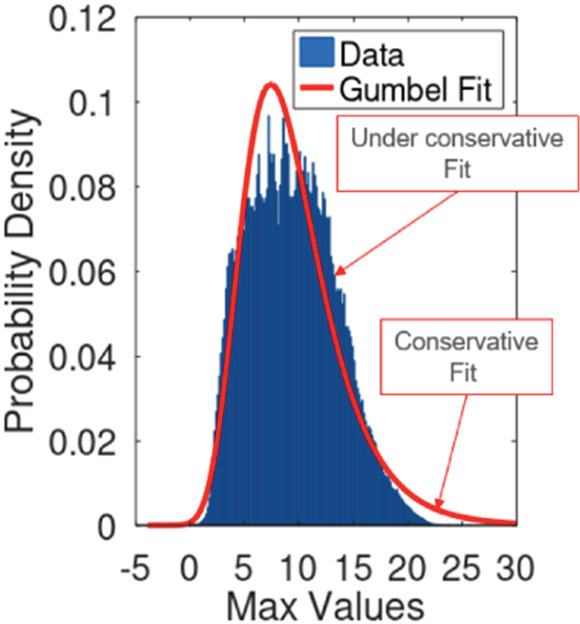
Figure 8.
Max load per flight fitting - Gumbel [7.4187, 3.53].
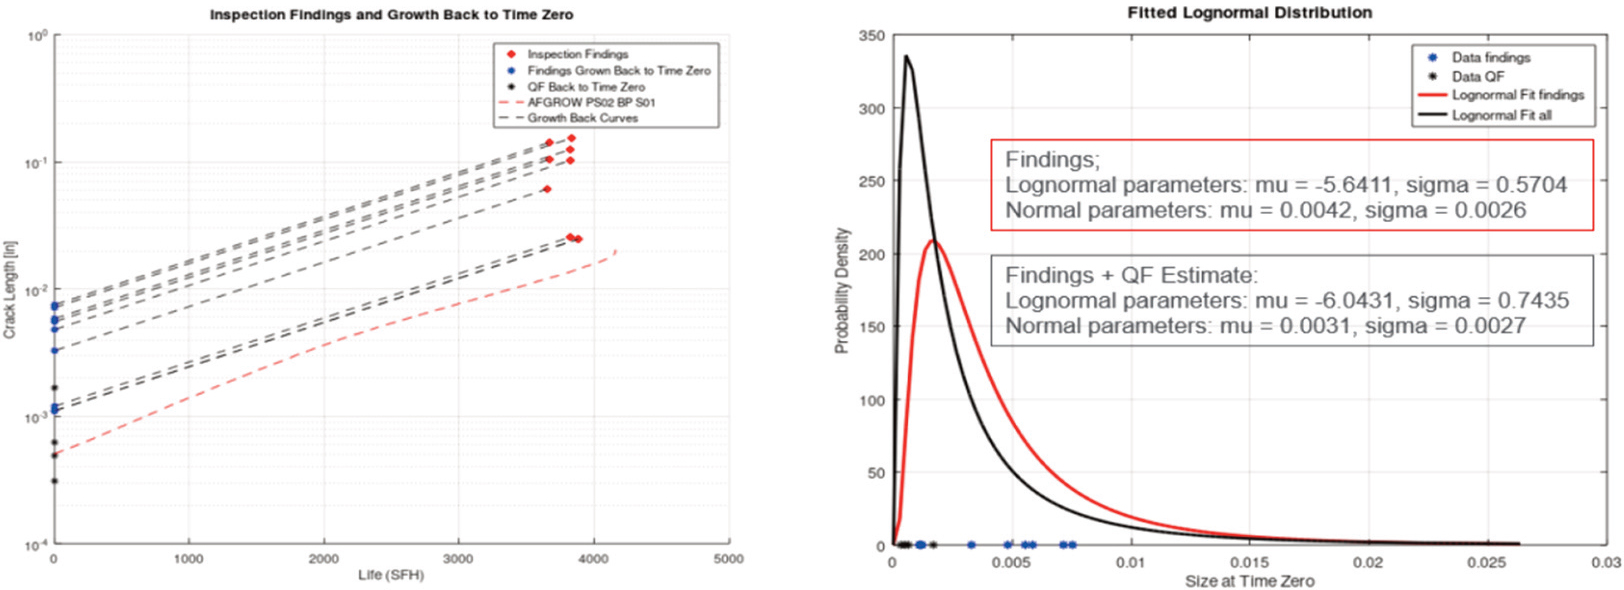
Figure 9.
Example of Crack grown to its initial size (left), EIFS/EIDS Distribution (right).
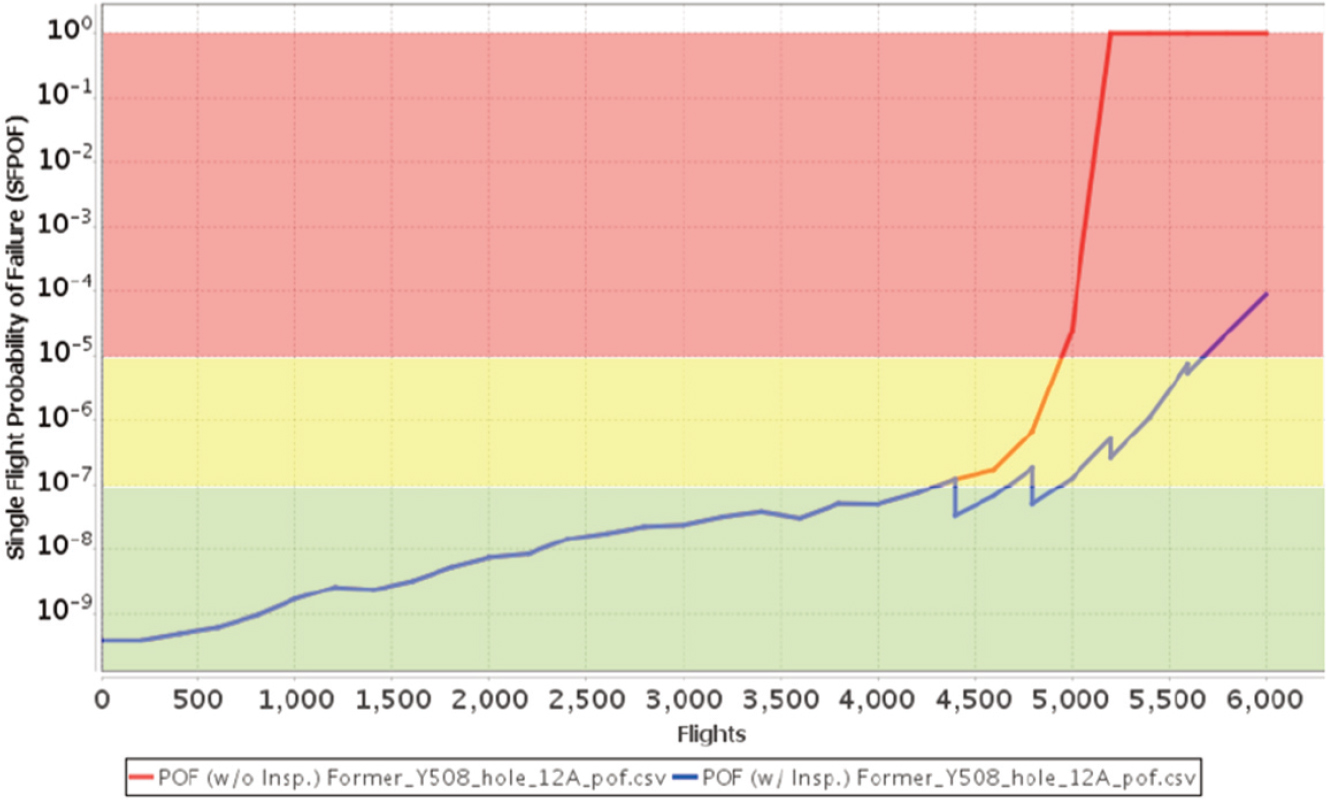
Figure 10.
SFPOF vs. FH, with inspections.