
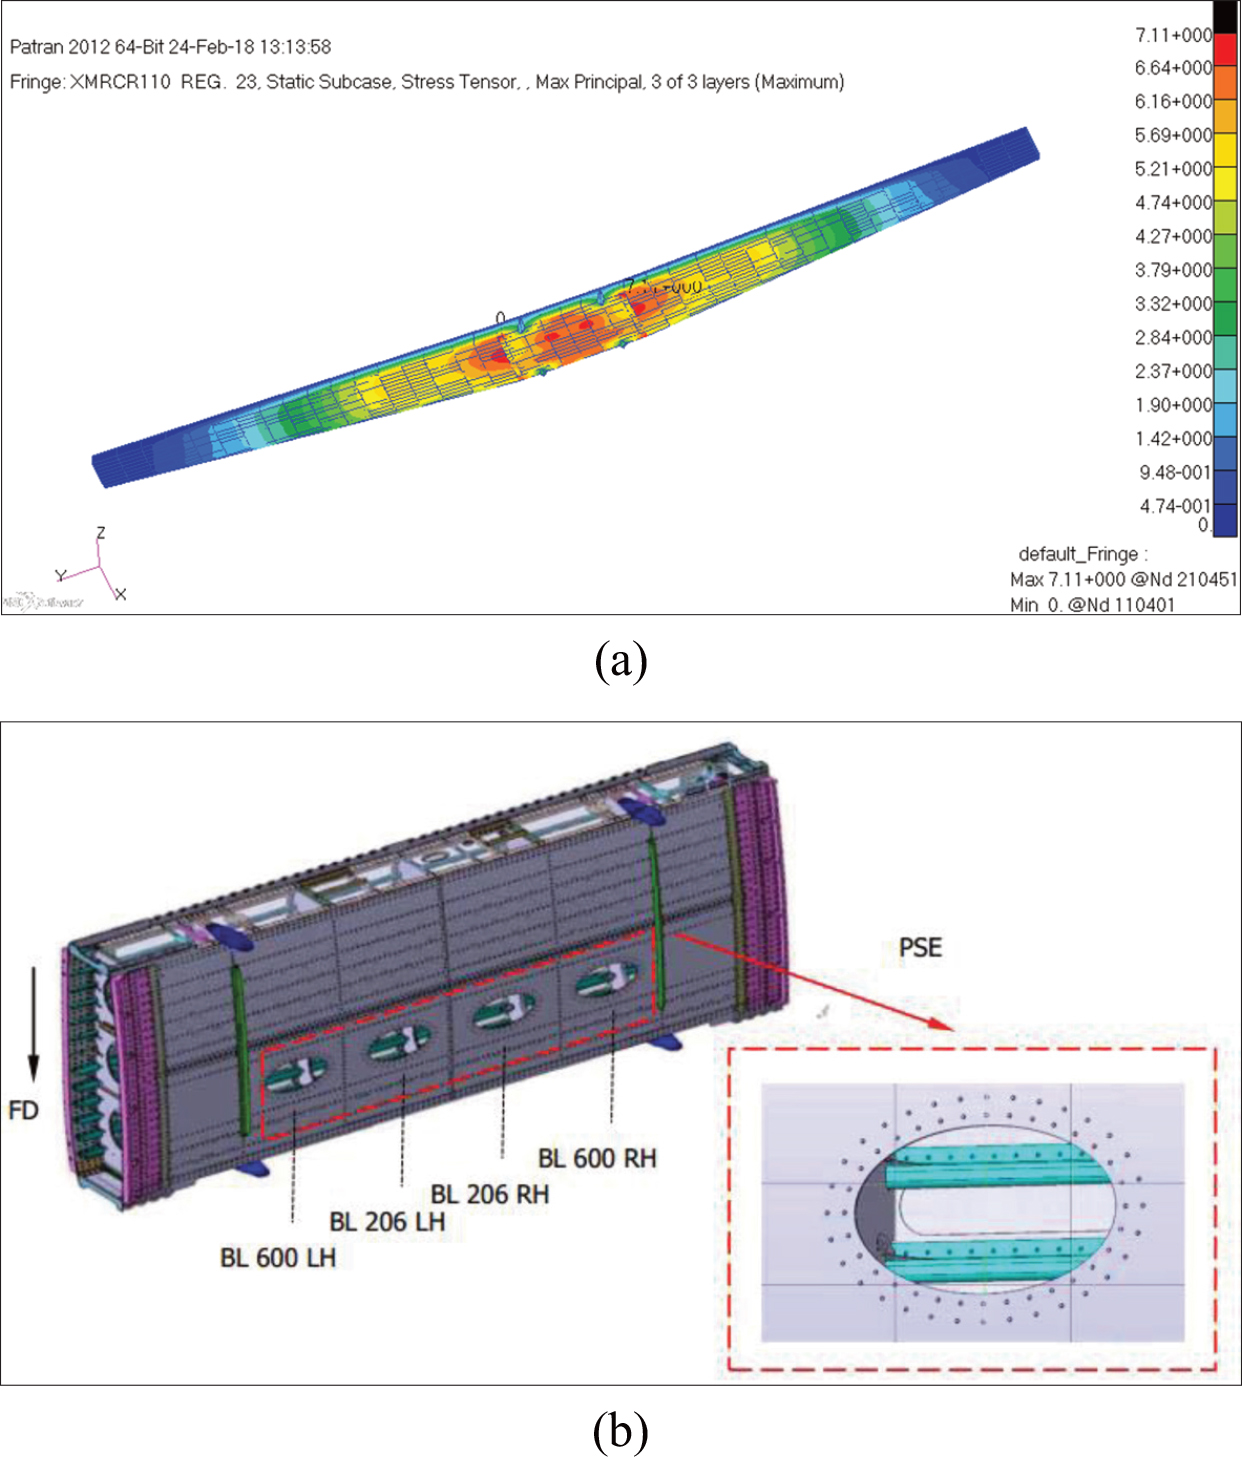
Figure 1.
(a) Stress Analysis Results on the Wing of the STOL Aircraft; and (b) Center Wing Box.
Table 1.
Coefficient values for different types of joints (Huth, 1986).
| Joint type | Coefficient values | |
|---|---|---|
| Single shear joint | n = 1 | |
| Double shear joint | n = 2 | |
| Bolted metallic | a = 2/3 | b = 3.0 |
| Riveted metallic | a = 2/5 | b = 2.2 |
| Bolted graphite/epoxy | a = 2/3 | b = 1.2 |
Table 2.
Full-Scale Fatigue Test Scatter factor for Aluminum structures (Federal Aviation Administration, 2024).
| Notes | Number of tests specimens | Required scatter factor |
|---|---|---|
| Probability of Detectable crack-free safe-life 99.97% (Zp = 3.511) | 1 | 4.96 |
| 2 | 4.0 | |
| 3 | 3.70 | |
| 4 | 3.54 | |
| Standard Deviation of Log fatigue life | ||
| 0.14 for Aluminum structures | ||
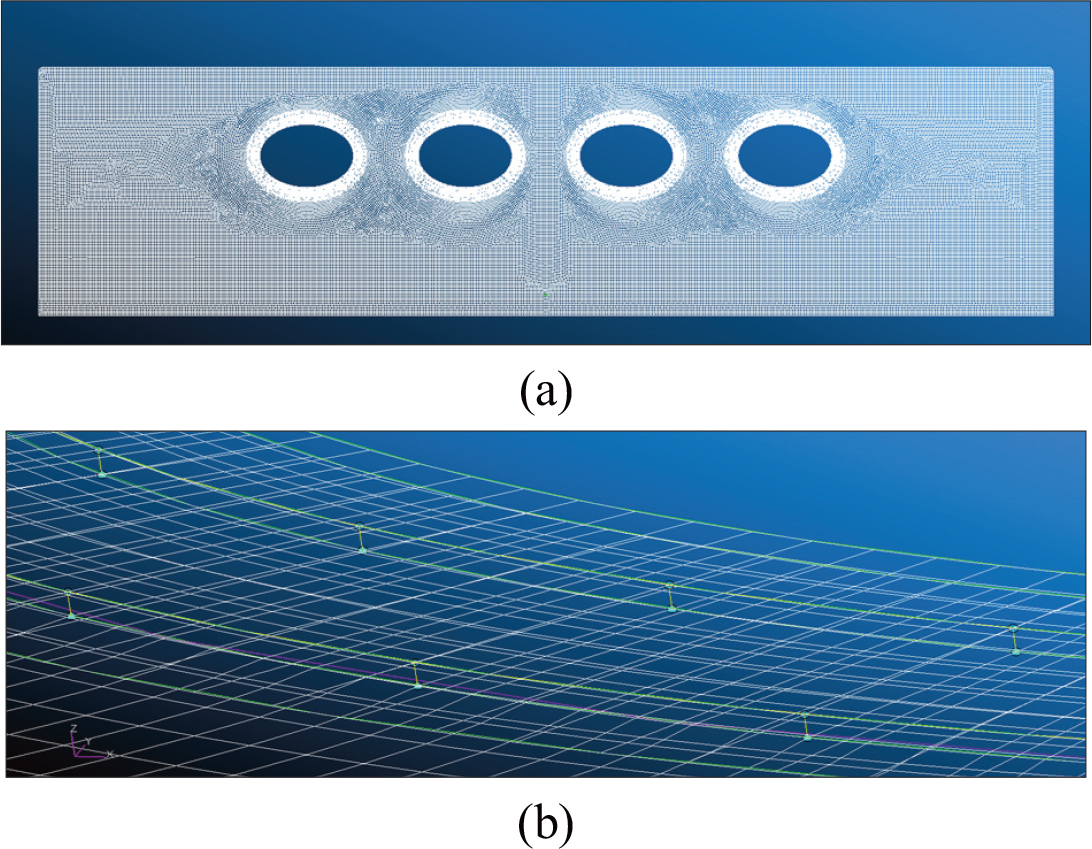
Figure 2.
(a) FEM modelling for the lower skin of an aircraft wing; (b) Rivet element modelling.
Table 3.
Dimensions of the Lower Skin.
| Geometry | Value |
|---|---|
| Length of Lower Skin | 2600 mm |
| Width of Lower Skin | 591 mm |
| Hole Inspections | 240 × 150 mm |
| Rivet Diameter | 3.97 mm |
| Skin width | 2 mm |
| Doubler width | 1.5 mm |
Table 4.
Material properties of Aluminum 2024-T3 (MSC Software Corporation, 2024).
| Properties | Value |
|---|---|
| Modulus Young | 70 GPa |
| Poisson Ratio | 0.33 |
| Yield Stress | 360 MPa |
| Yield Ultimate | 488 MPa |
| Elongation strain | 23% |
| Hardening coefficient | 450 MPa |
| Hardening exponent | 0.072 |
| Ductility coefficient | 0.409 |
| Ductility exponent | -0.713 |
| Fatigue coefficient | 927 |
| Fatigue exponent | -0.113 |
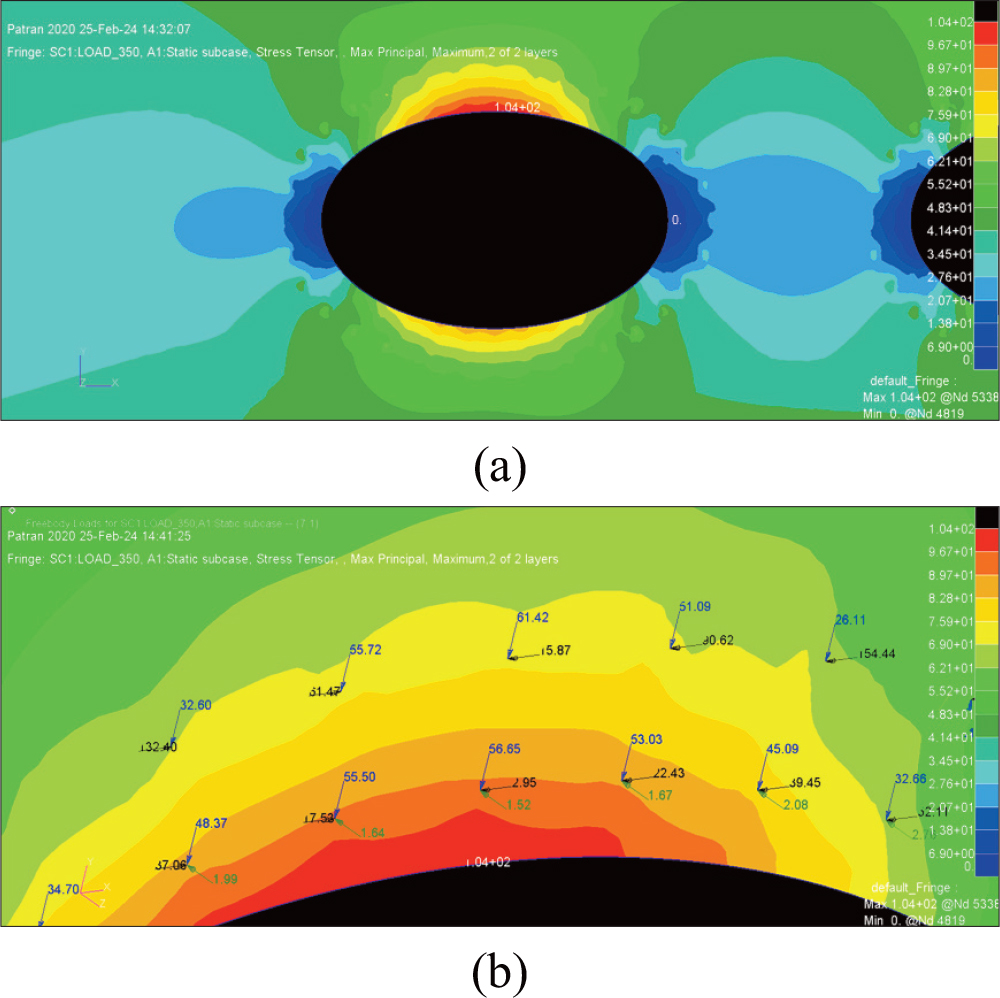
Figure 3.
(a) Stress concentration on the skin; (b) Rivet reaction force.
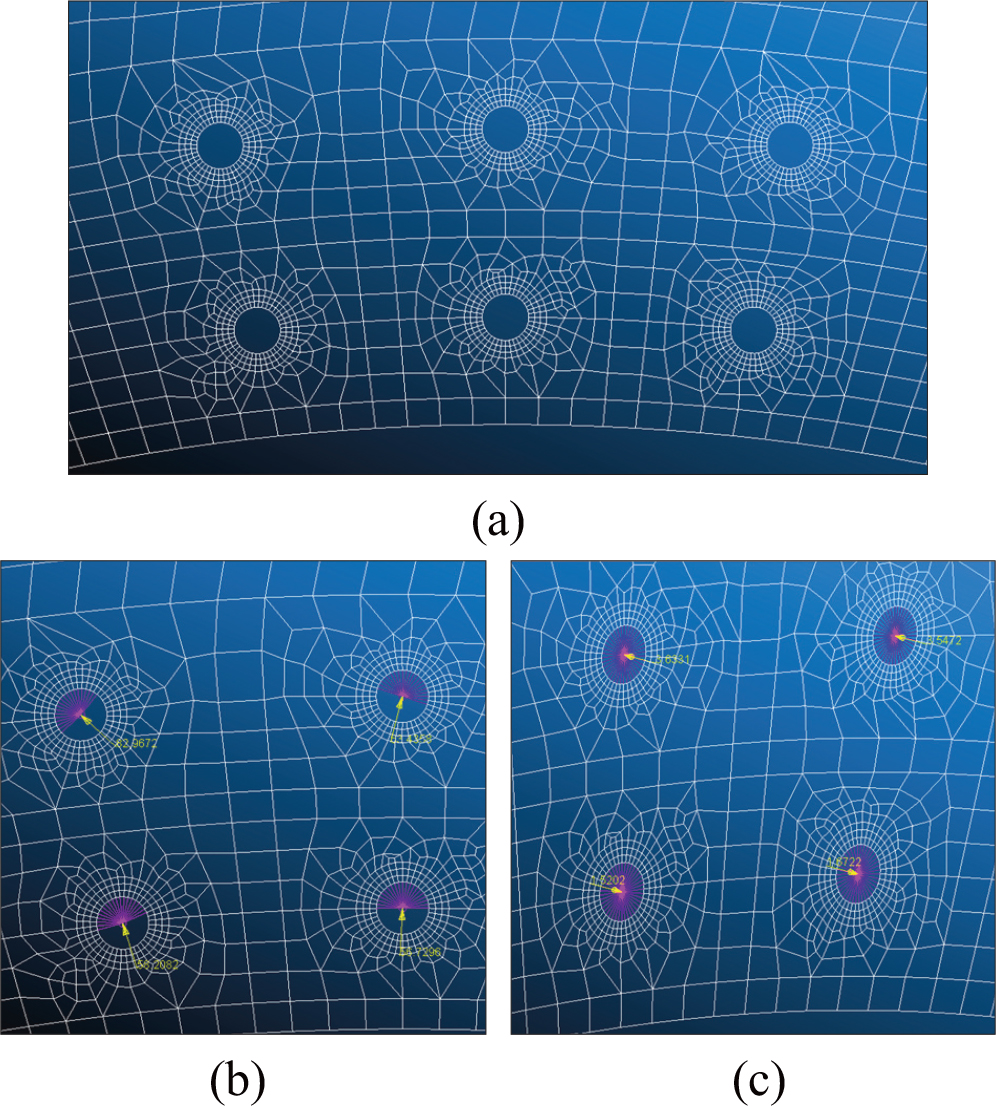
Figure 4.
(a) Element generation after hole addition; (b) Application of in-plane rivet reaction force; (c) Application of out-plane reaction force.
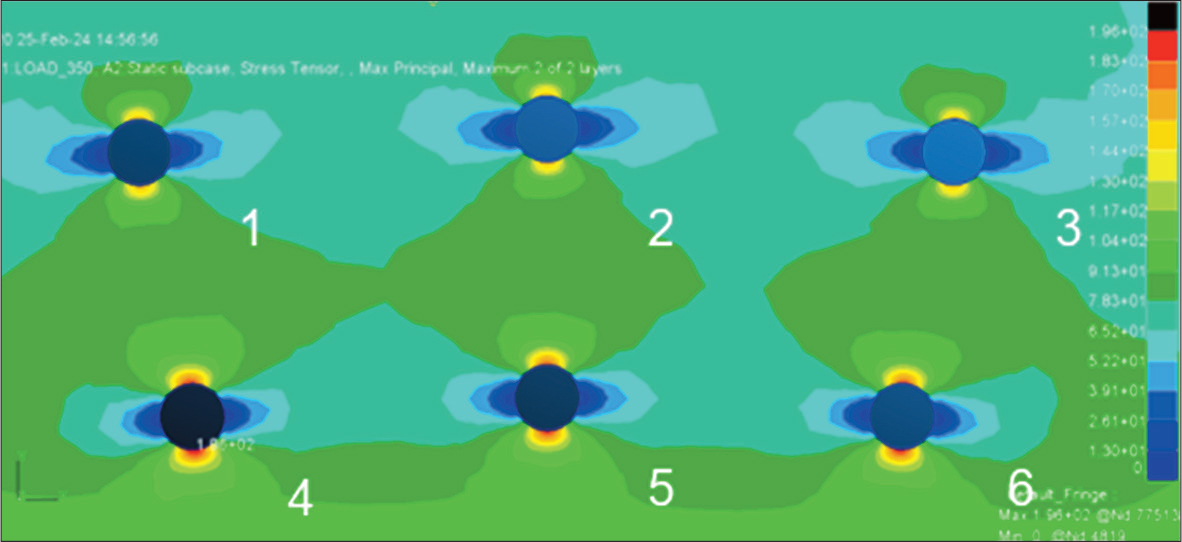
Figure 5.
Stress concentration at rivet holes.
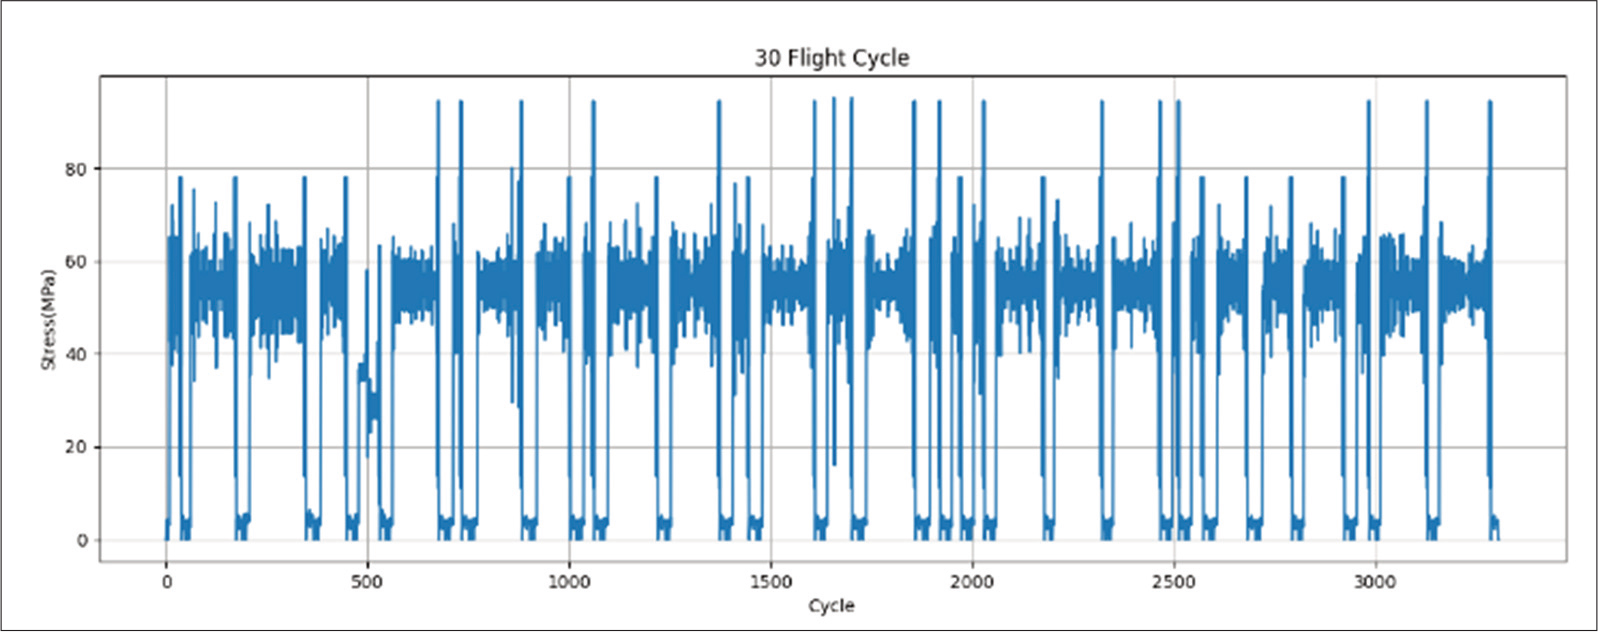
Figure 6.
Load spectrum from flight test.
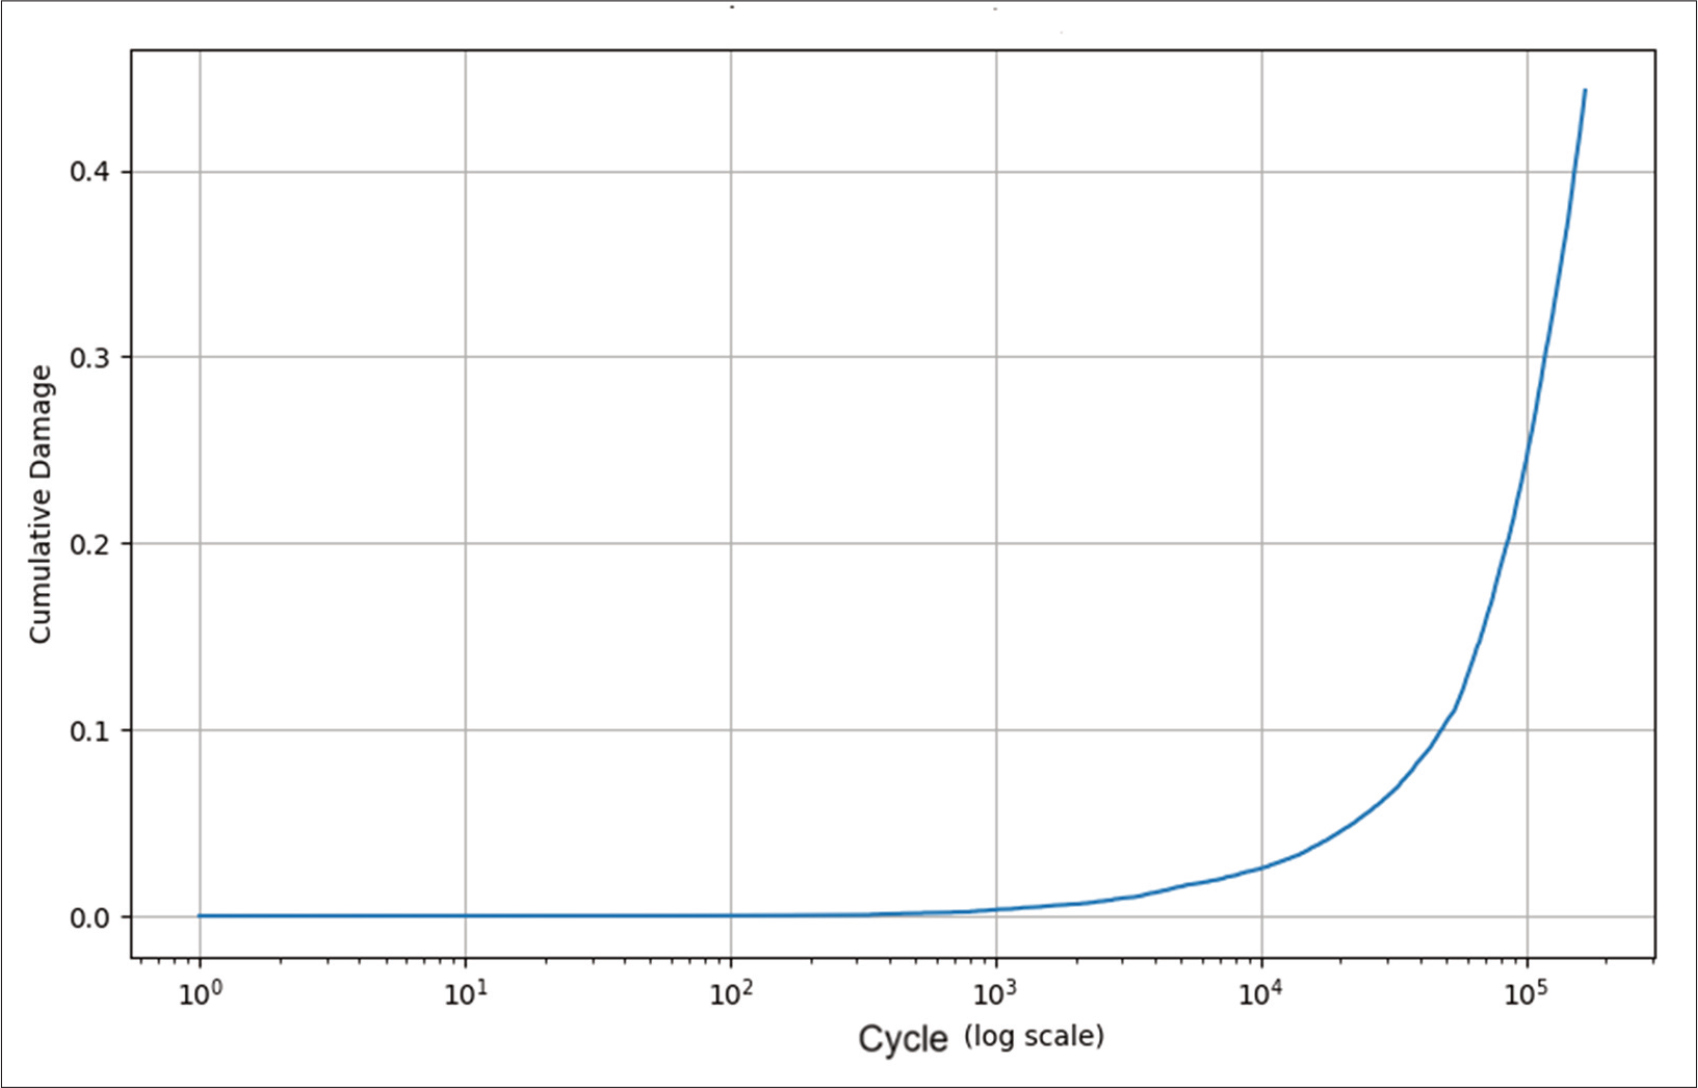
Figure 7.
Cumulative fatigue damage curve.