
Fig. 1.
Simple CNN-1D architecture with two convolutional layers (Frederick et al., 2007).
Fig. 2.
Example of a decision tree.
Fig. 3.
Simplified engine diagram simulated in C-MAPSS (Heimes, 2008).
Table 1.
The meanings of C-MAPSS data sources.
| Description | Symbol | Units |
| Total temperature at the fan inlet | T2 | °R |
| Total temperature at the LPC outlet | T24 | °R |
| Total temperature at the HPC outlet | T30 | °R |
| Total temperature at the LPT outlet | T50 | °R |
| Pressure at the fan inlet | P2 | Psia |
| Total pressure in bypass-duct | P15 | Psia |
| Total pressure at the HPC outlet | P30 | Psia |
| Physical fan speed | Nf | rpm |
| Physical core speed | Nc | rpm |
| Engine pressure ratio (P50/P2) | Epr | |
| Static pressure at the HPC outlet | Ps30 | Psia |
| Ratio of fuel flow to Ps30 | Phi | PPS/psi |
| Corrected fan speed | NRf | rpm |
| Corrected core speed | NRc | Rpm |
| Bypass ratio | BPR | |
| Burner fuel-air ratio | farB | |
| Bleed enthalpy | bleed | |
| Demanded fan speed | Nf_dmd | Rpm |
| Demanded corrected fan speed | PCNR_dmd | Rpm |
| Coolant bleed (HPT) | W31HPT | 1bm/s |
| Coolant bleed (LPT) | W32LPT | 1bm/s |
| The total temperature at the HPT outlet | Parameters for calculating Health Index | |
| Fan stall margin | SmFan | |
| LPC stall margin | SmLPC | |
| HPC stall margin | SmHPC |
Table 2.
Description of FD001 datasets.
| Dataset | CMAPSS (FD001) |
| Training engine | 100 |
| Testing engine | 100 |
| Working condition | 1 |
| Fault modes | 2 |
Fig. 4.
The distribution of the dataset’s features.
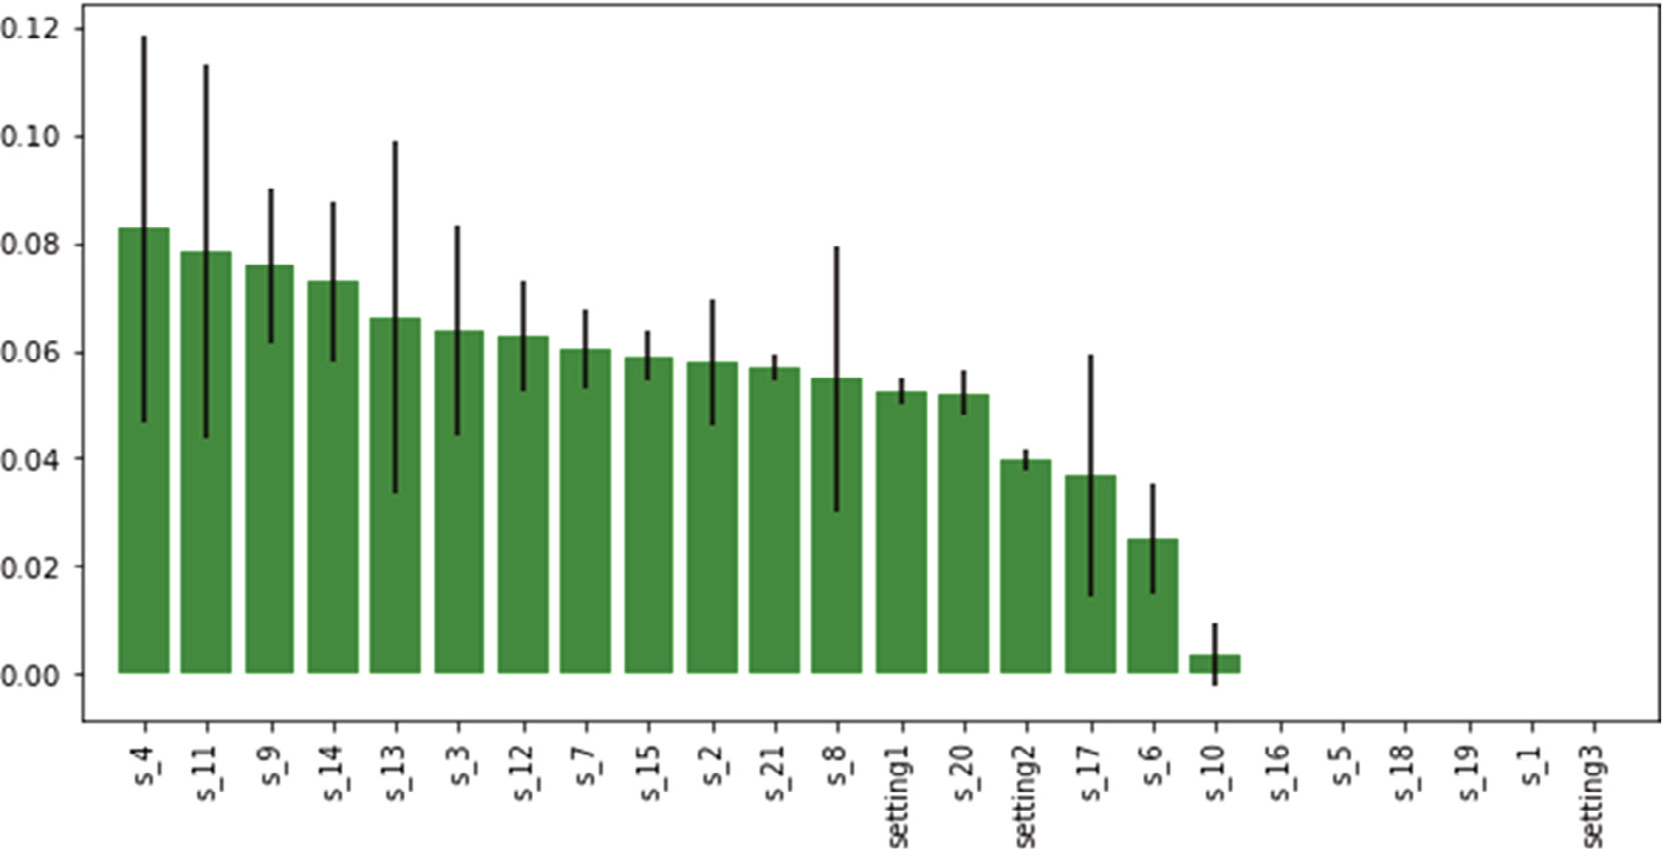
Fig. 5.
Bar chart of influential features.
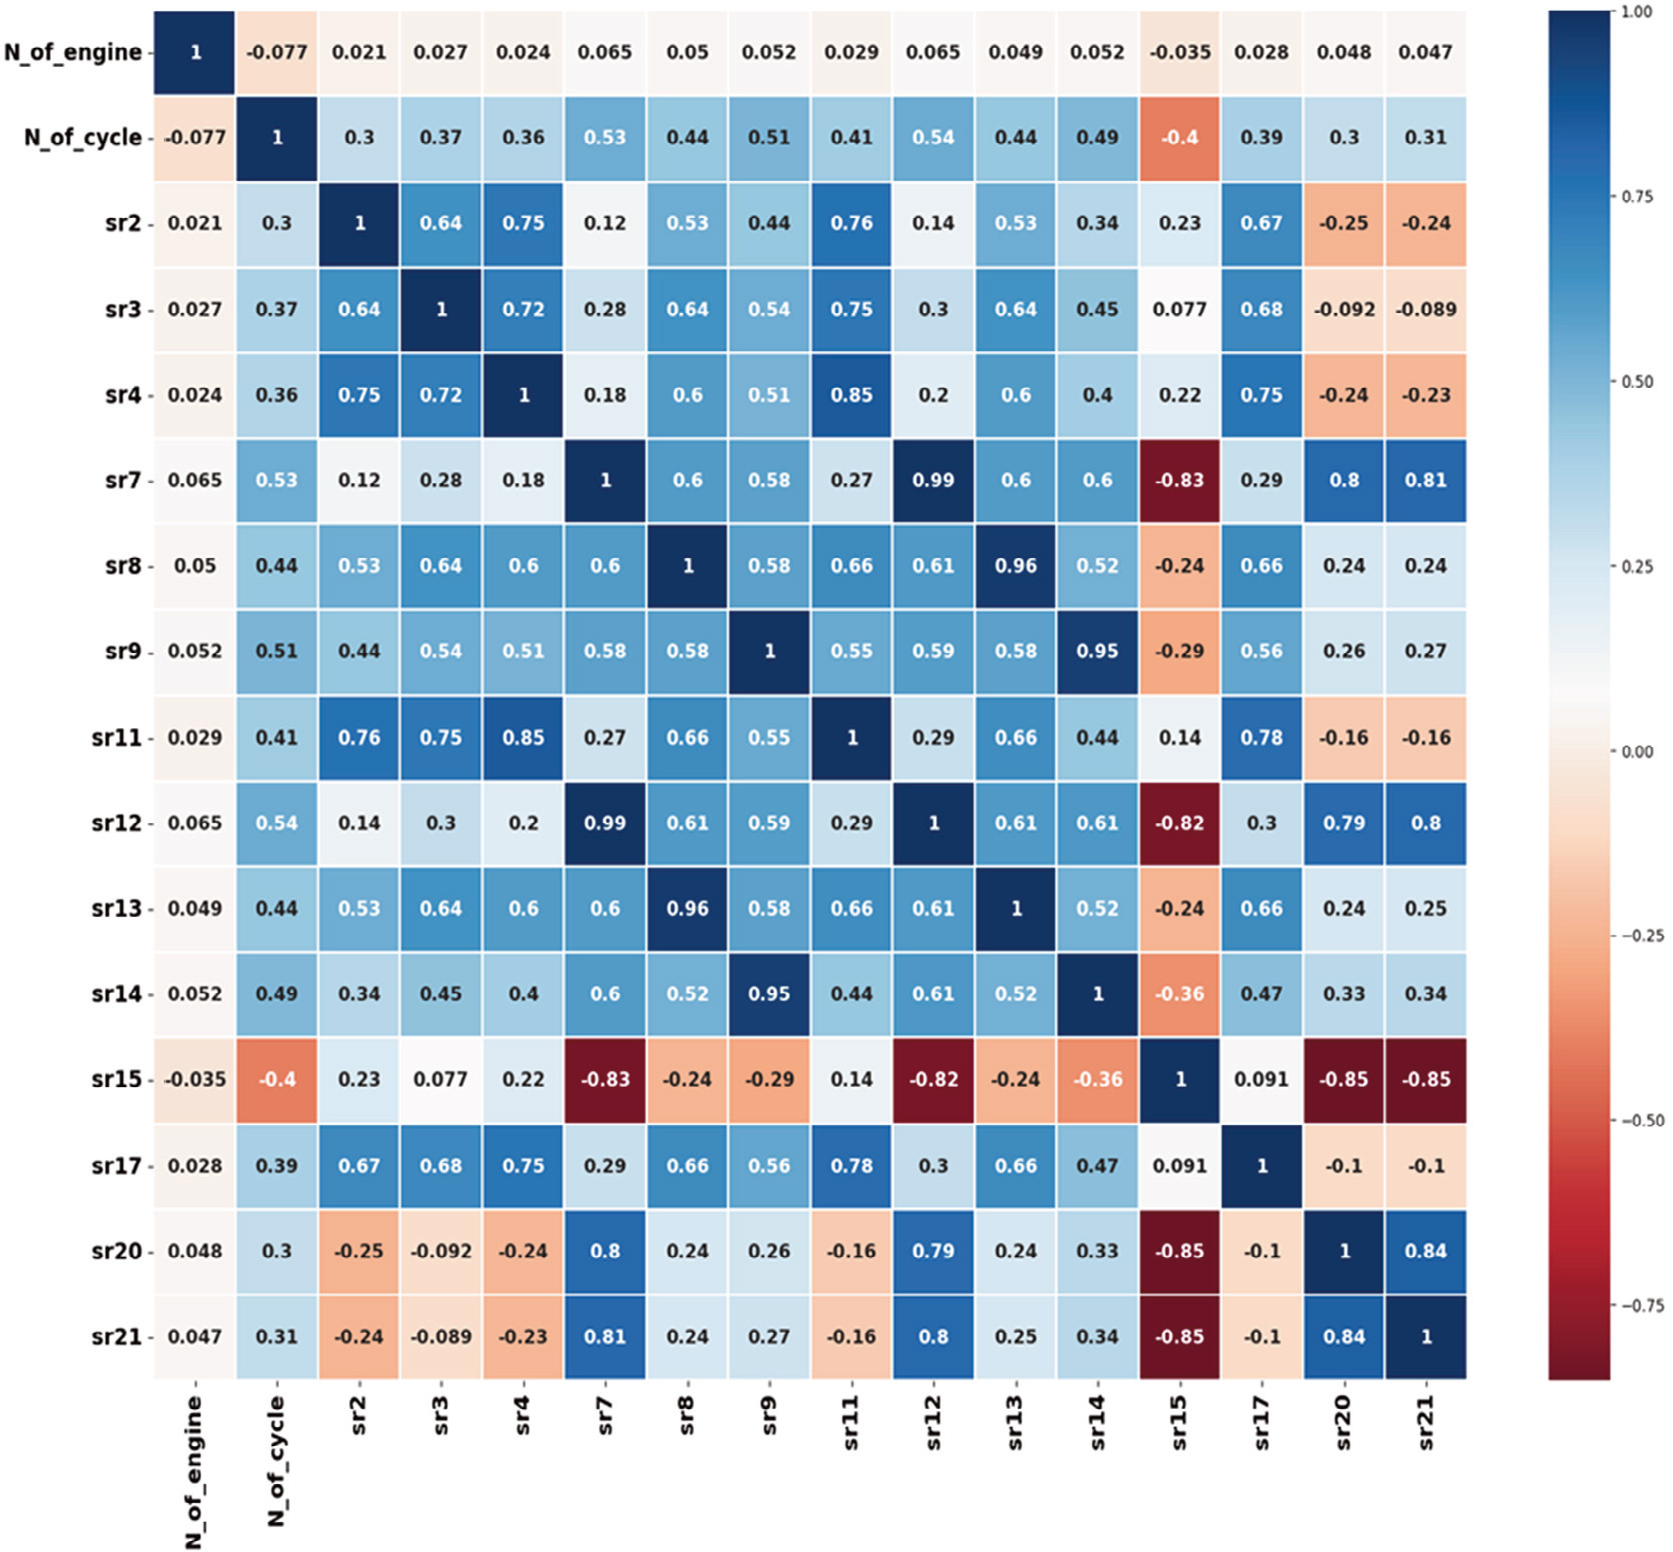
Fig. 6.
Correlation heatmap for selected dataset features.
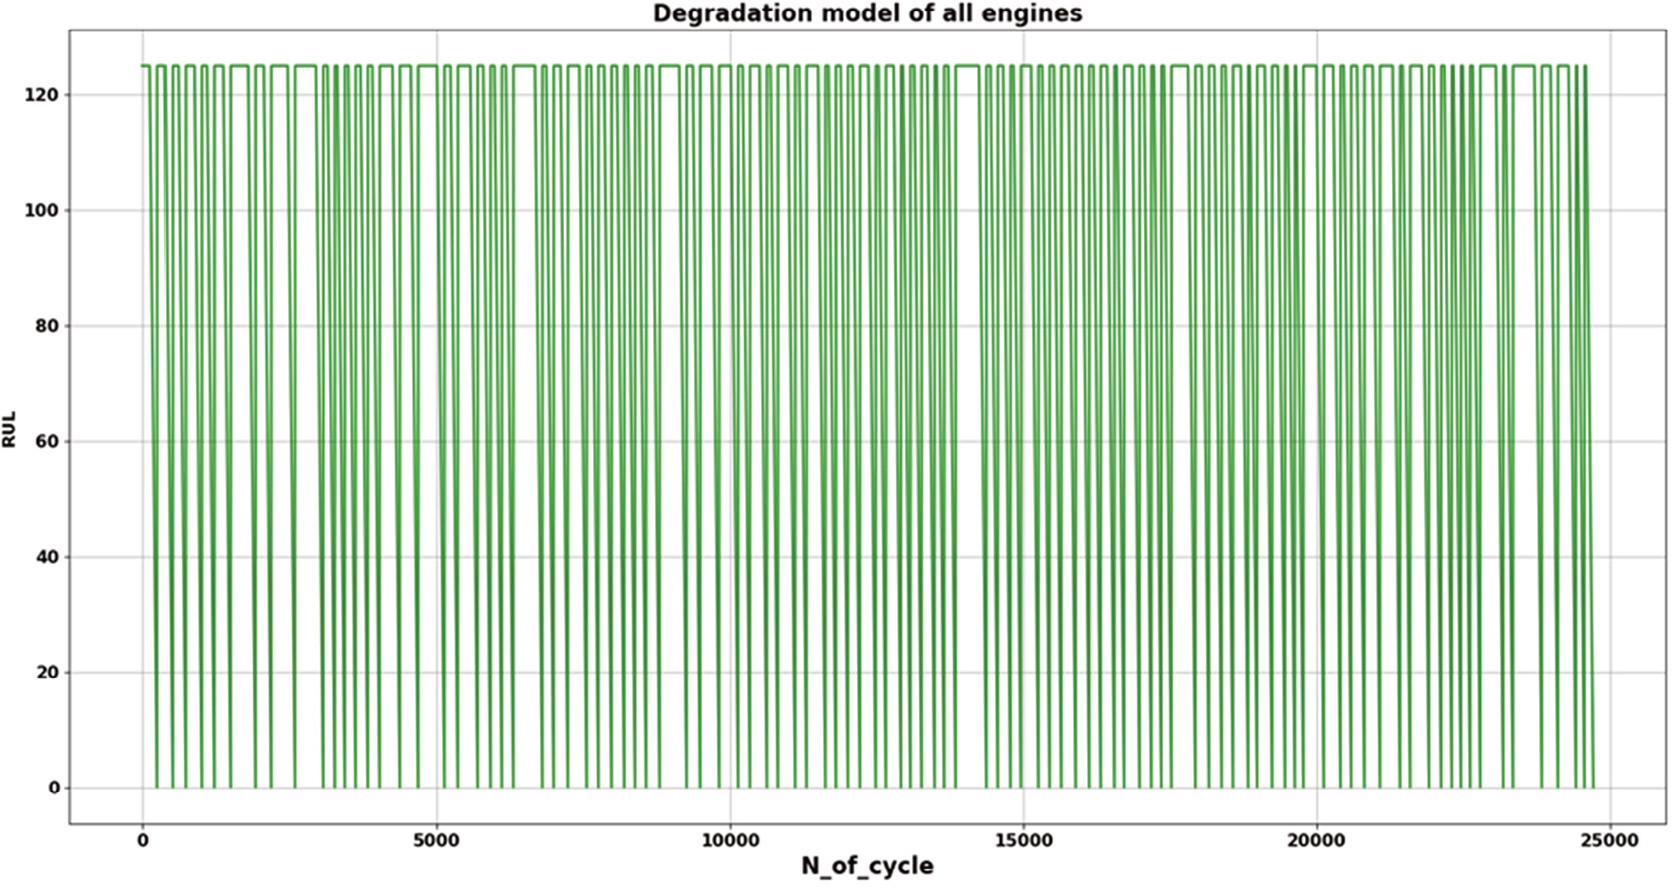
Fig. 7.
Diagram of model degradation of all engines.
Table 3.
CNN-1D structure.
| Layer (type) | Output Shape | Param # |
|---|---|---|
| conv1d (Conv1D) | (None, 23, 32) | 96 |
| flatten (Flatten) | (None, 736) | θ |
| dense (Dense) | (None, 64) | 47168 |
| dense_1 (Dense) | (None, 1) | 65 |
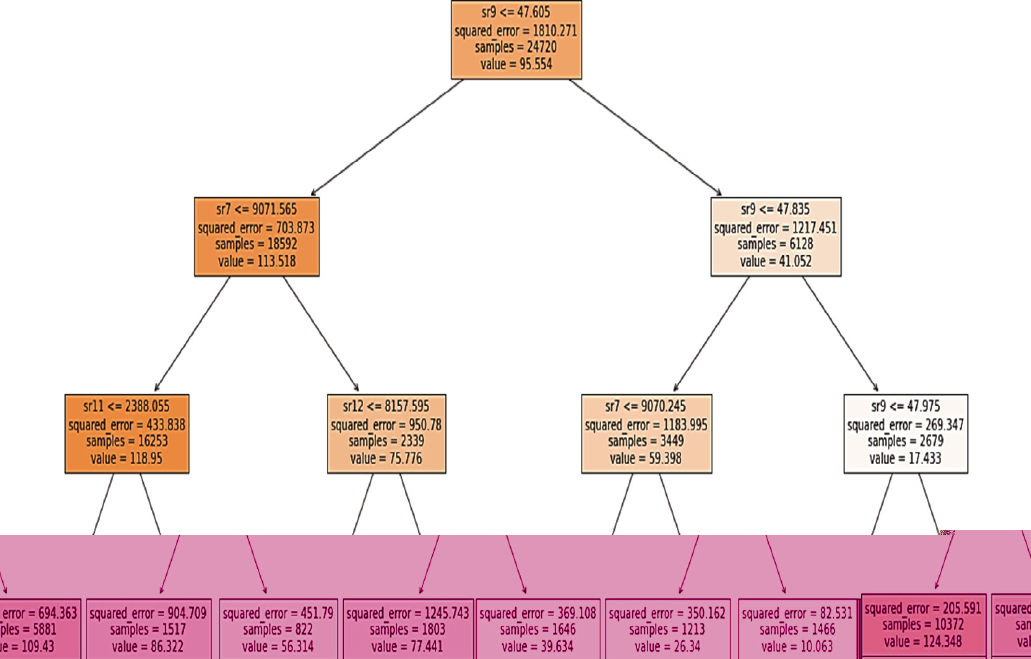
Fig. 8.
Decision Tree structure.
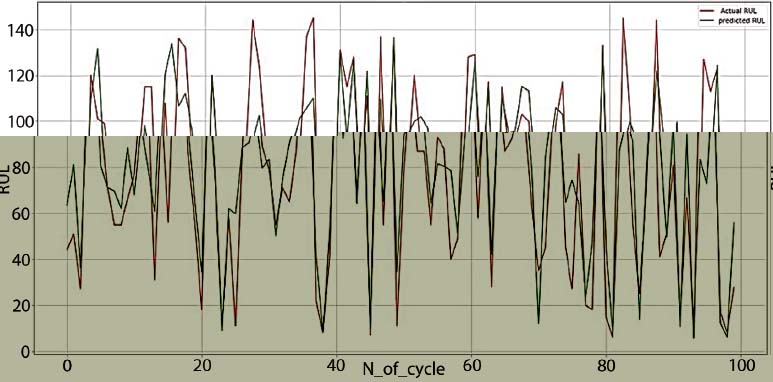
Fig. 9.
Diagram of true and predicted RUL using CNN-1D.
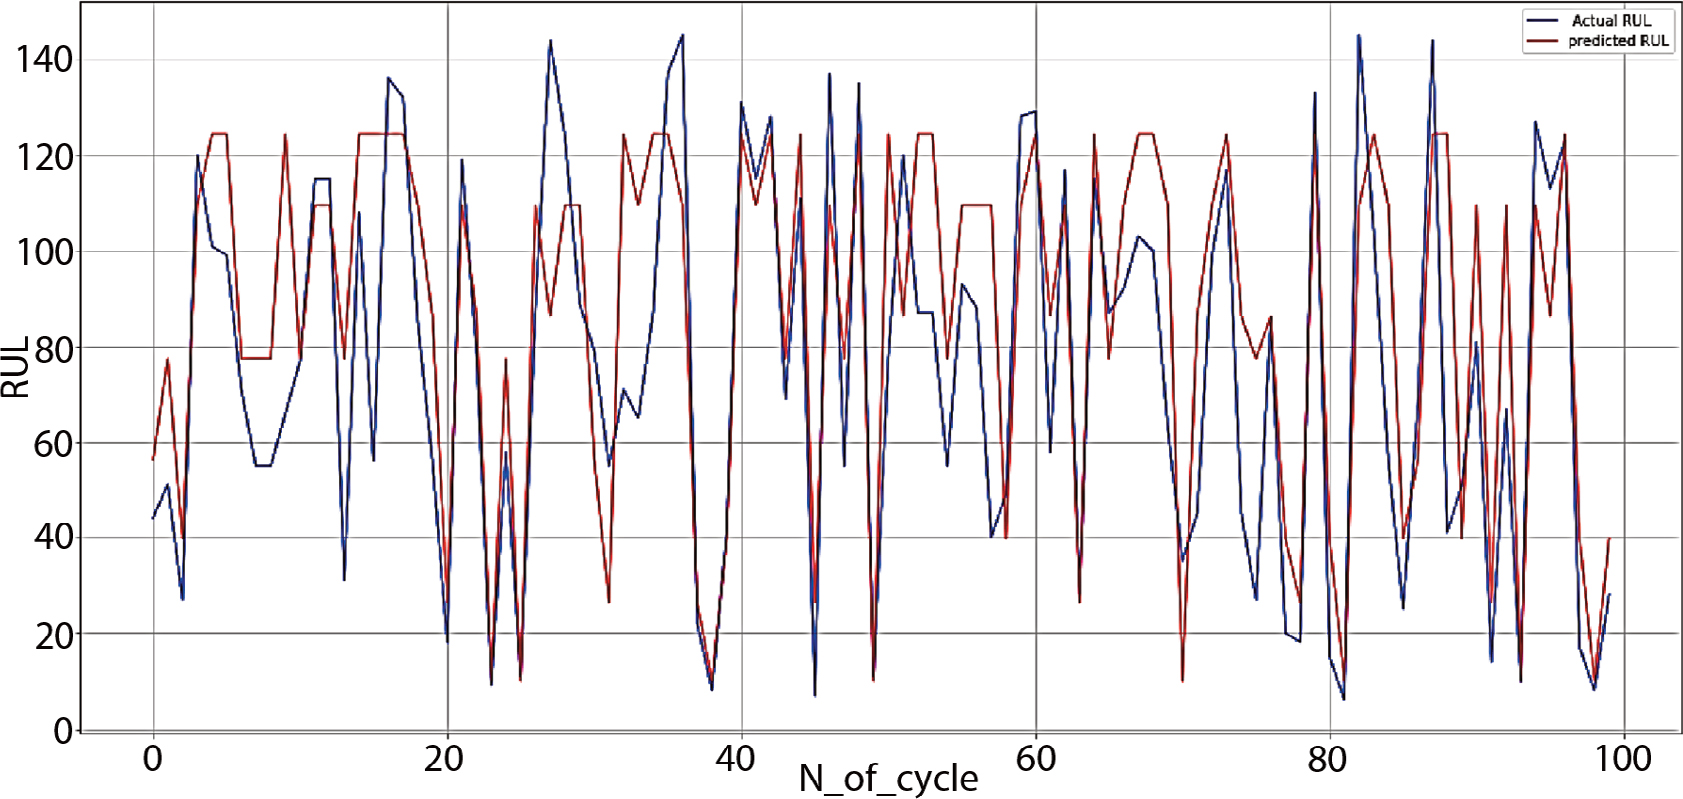
Fig. 10.
Diagram of true and predicted RUL using DT.