
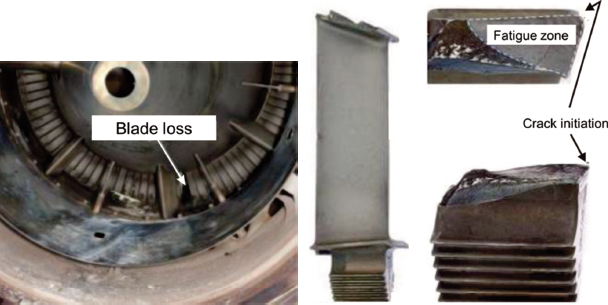
Figure 1.
Turbine blade loss caused by HCF (DFS, 2014). HCF, high cycle fatigue.
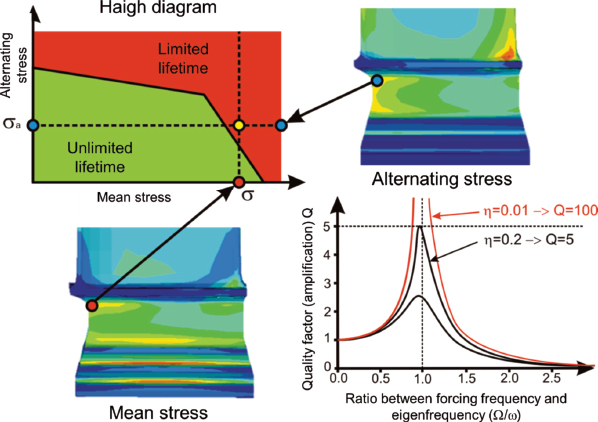
Figure 2.
Scheme of blade fatigue assessment using the Haigh diagram.
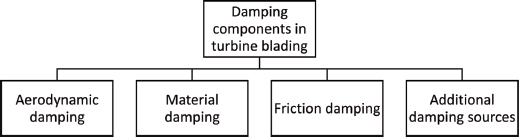
Figure 3.
Damping components in turbine blading.
Table 1.
Comparison of the aerodynamic damping ratio of turbine blades
| Object | Aerodynamic damping ratio ζa [-] | Source |
|---|---|---|
| SO-3 turbine blades (free-standing) | 0.14% (calculated) | Formulas (Eqs. 1 and 2) |
| High pressure turbine blades of Honeywell TFE 731-2 engine (free-standing) | 0.14%–0.26% (±0.11%) | Kielb & Abhari, 2001 |
| Steam turbine blades (free-standing) | 0.21%–0.40% | Brown, 1981 |

Figure 4.
An example of a hysteresis loop with cyclic deformation of the material.
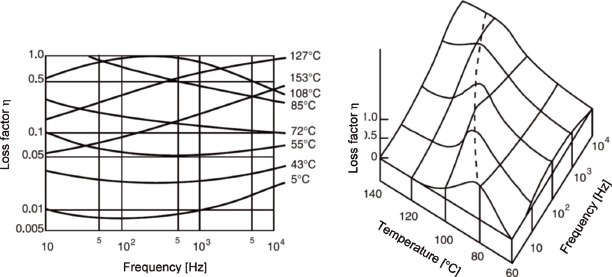
Figure 5.
Example of temperature and vibration frequency influence on material damping (Braun et al., 2002).
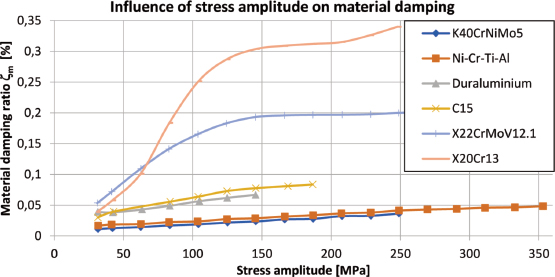
Figure 6.
Influence of stress amplitude on material damping of selected alloys at room temperature (Szmid, 1962; Szwedowicz, 2012).
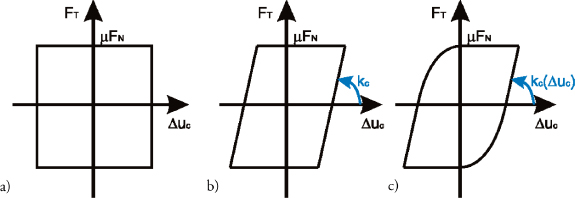
Figure 7.
Friction models: a) rigid contact, b) macro-slip, c) micro-slip.
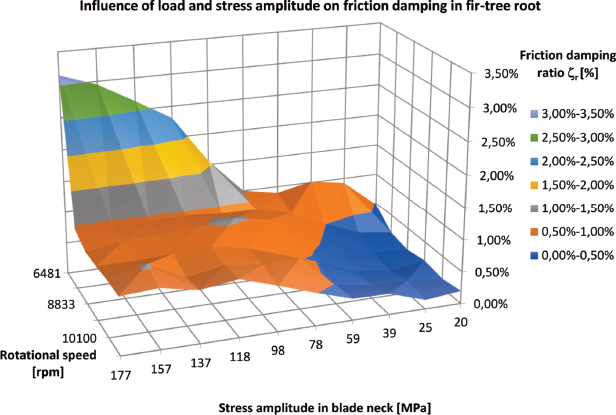
Figure 8.
Influence of load and stress amplitude on friction damping in fir-tree root (Klepacki, 1975).
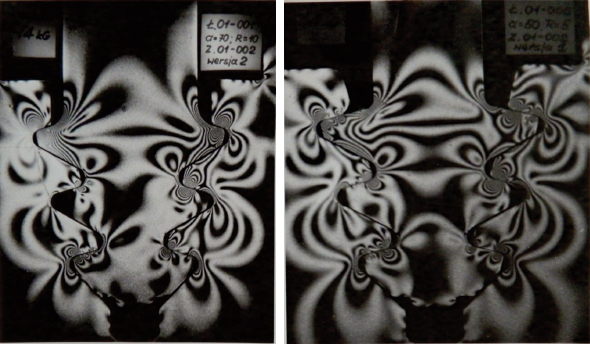
Figure 9.
Isochromatic pattern in two different pairs of fir-tree locks (Klepacki, 1975).
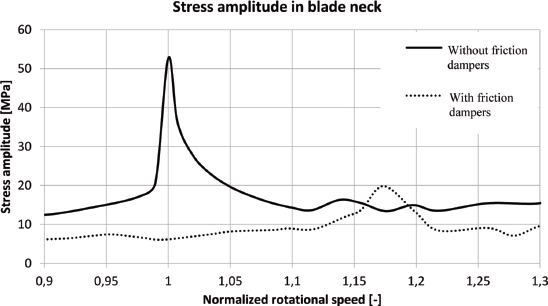
Figure 10.
Stress amplitudes in the blade with and without friction dampers as a function of rotational speed (Klepacki, 1978).
Table 2.
Comparison of the impact of friction dampers on blade vibrations.
| Object | Amplitude reduction (%) | Source |
|---|---|---|
| SO-3 turbine (free-standing blades, baseline under-platform dampers) | -62.0 | Klepacki, 1975 |
| SO-3 turbine (free-standing blades, optimized under-platform dampers) | -74.0 | Moneta, 2019 |
| Axial compressor (free-standing blades, roller under-platform dampers) | -80.0 | Hanson, 1956 |
| Volvo RM6/RM8 turbine (freestanding blades, under-platform dampers) | -80.0 | Csaba, 1997 |
| Steam turbine (last stage blades coupled by damping bolts) | -83.3 | Szwedowicz, 2008 |