
Table 1.
Steel G17CrMoV5-10 chemical composition for cast.
| Element | C | Si | Mn | P | S | Ni | Cr | Mo | V | Cu | Sn |
|---|---|---|---|---|---|---|---|---|---|---|---|
| wt.% | 0.19 | 0.4 | 0.9 | 0.014 | 0.011 | 0.08 | 1.44 | 1.04 | 0.2 | 0.30 | 0.001 |
Table 2.
LCF fatigue test matrix.
| Temperature, T (°C) | 500 | Hold time, th (s) | Frequency, (Hz) | Total strain, Δε (%) |
| Strain ratio, | -1 | |||
| Cycle scheme | ||||
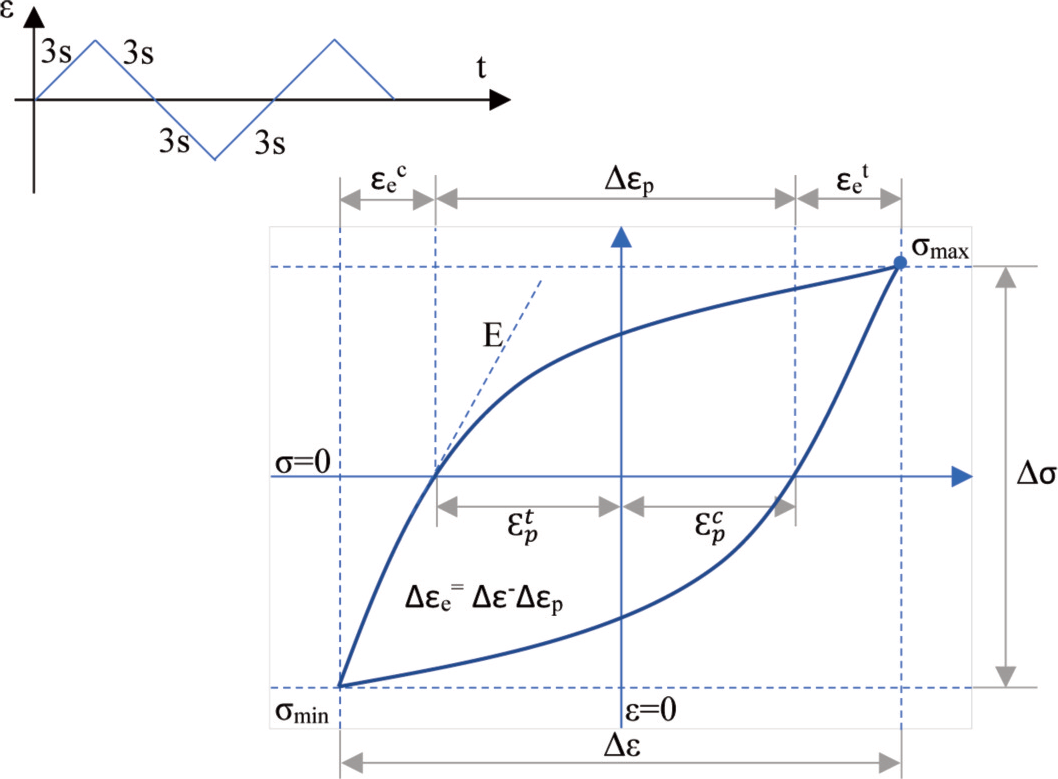 | 0 | 0.08 | 0.4 | |
| 0.6 | ||||
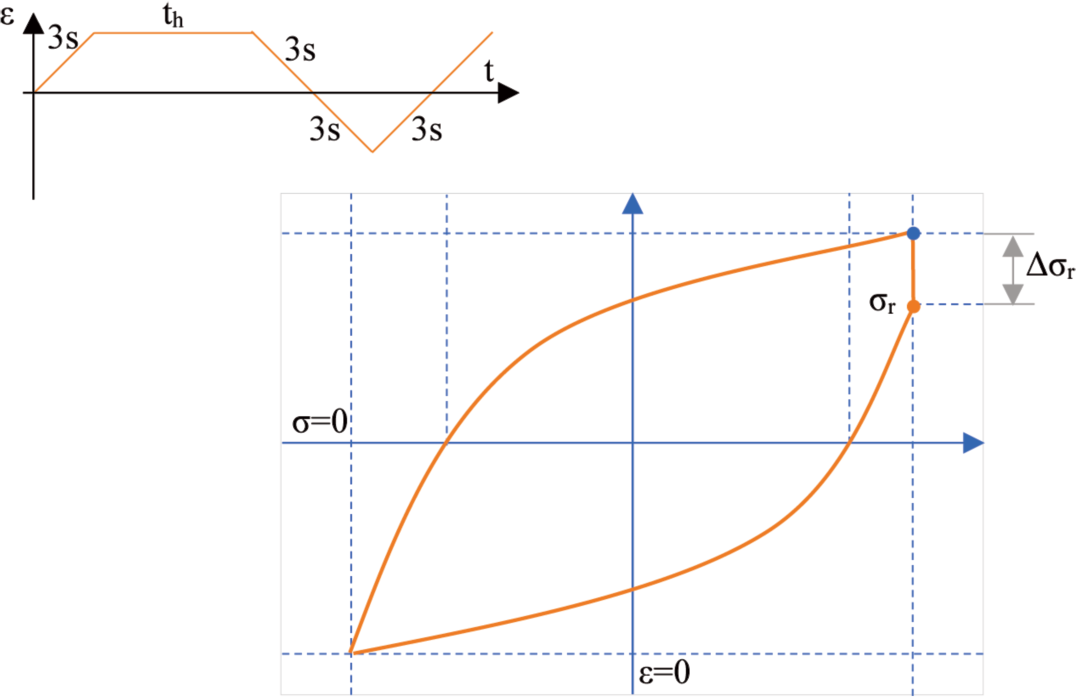 | 120 | 0.008 | 0.4 | |
| 0.6 | ||||
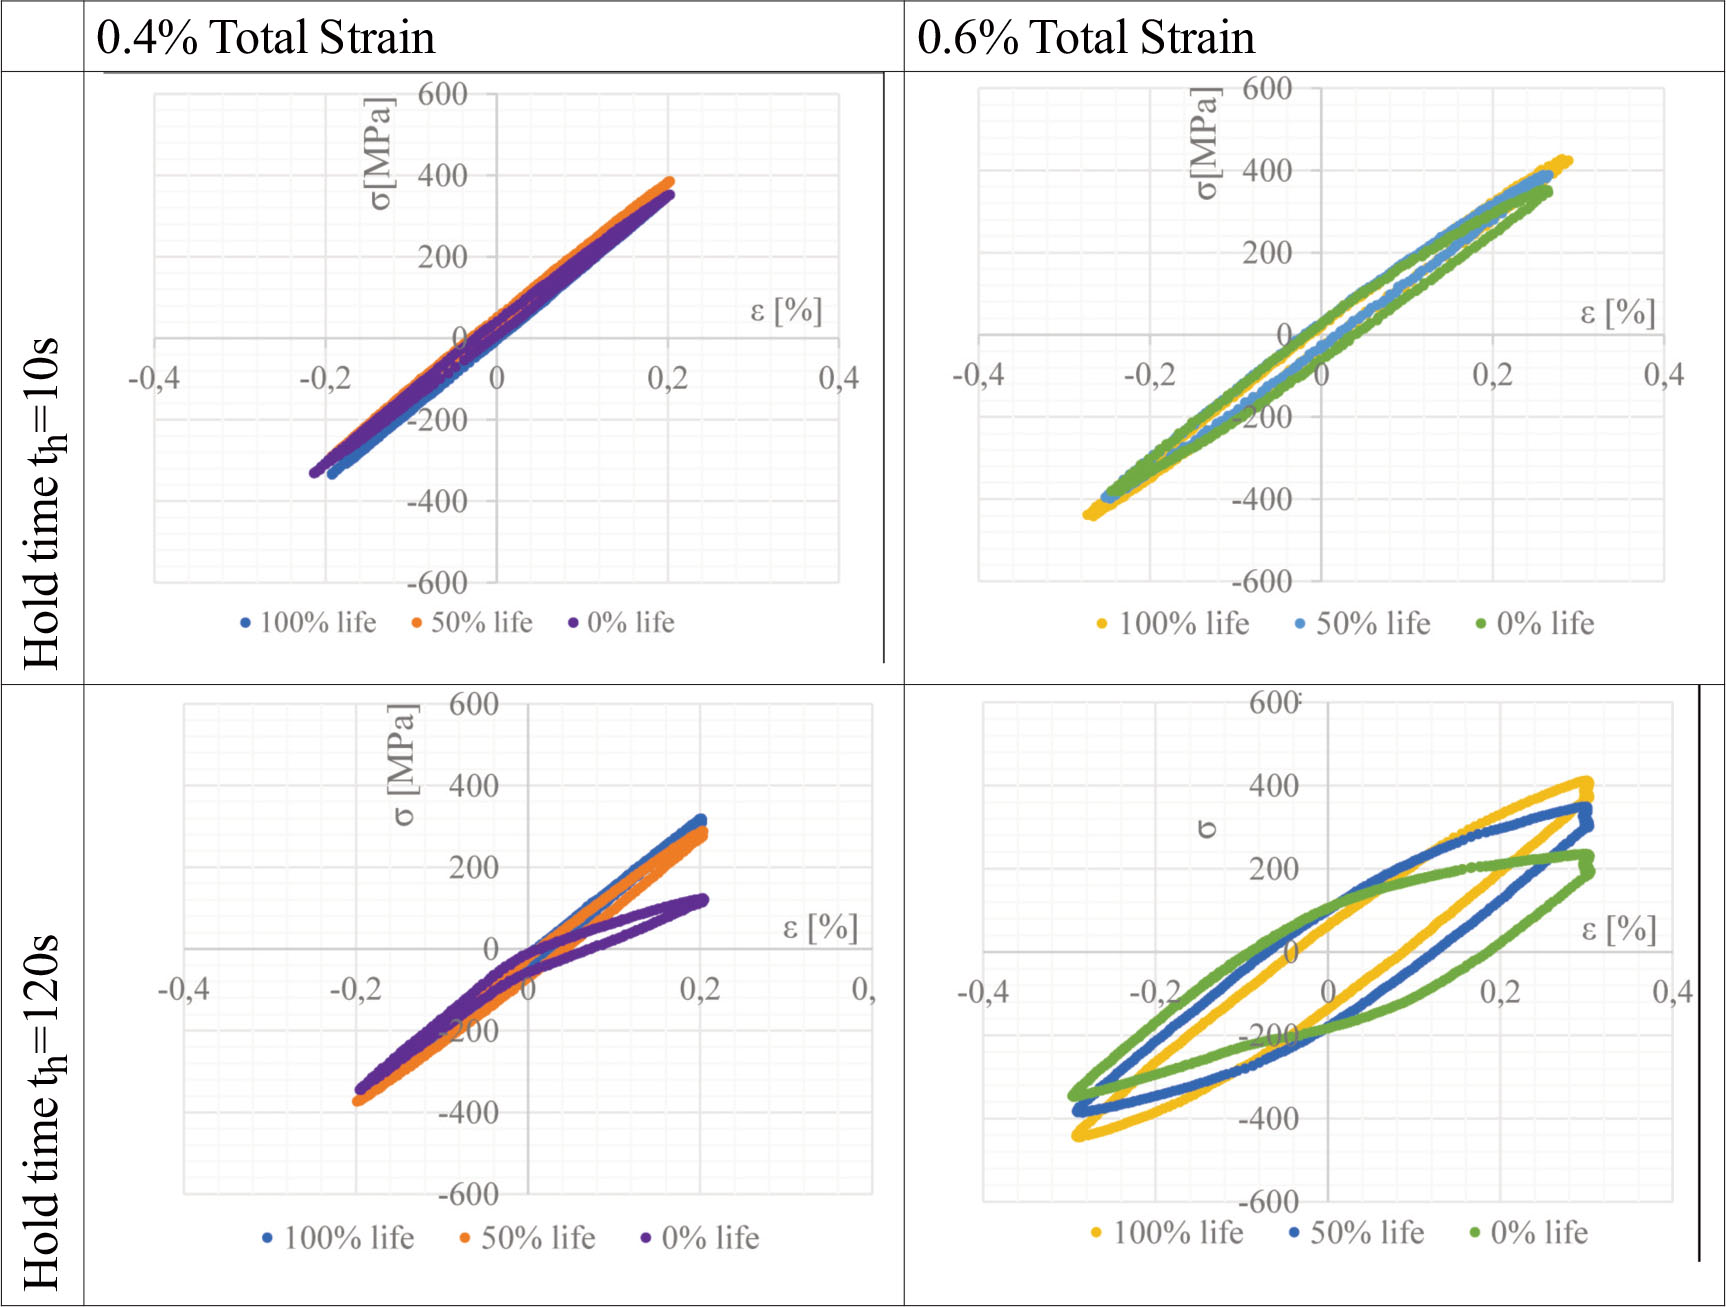
Figure 1.
Hysteresis loop of the LCF test shown for 100%, 50%, and 0% of life. LCF, low cycle fatigue.
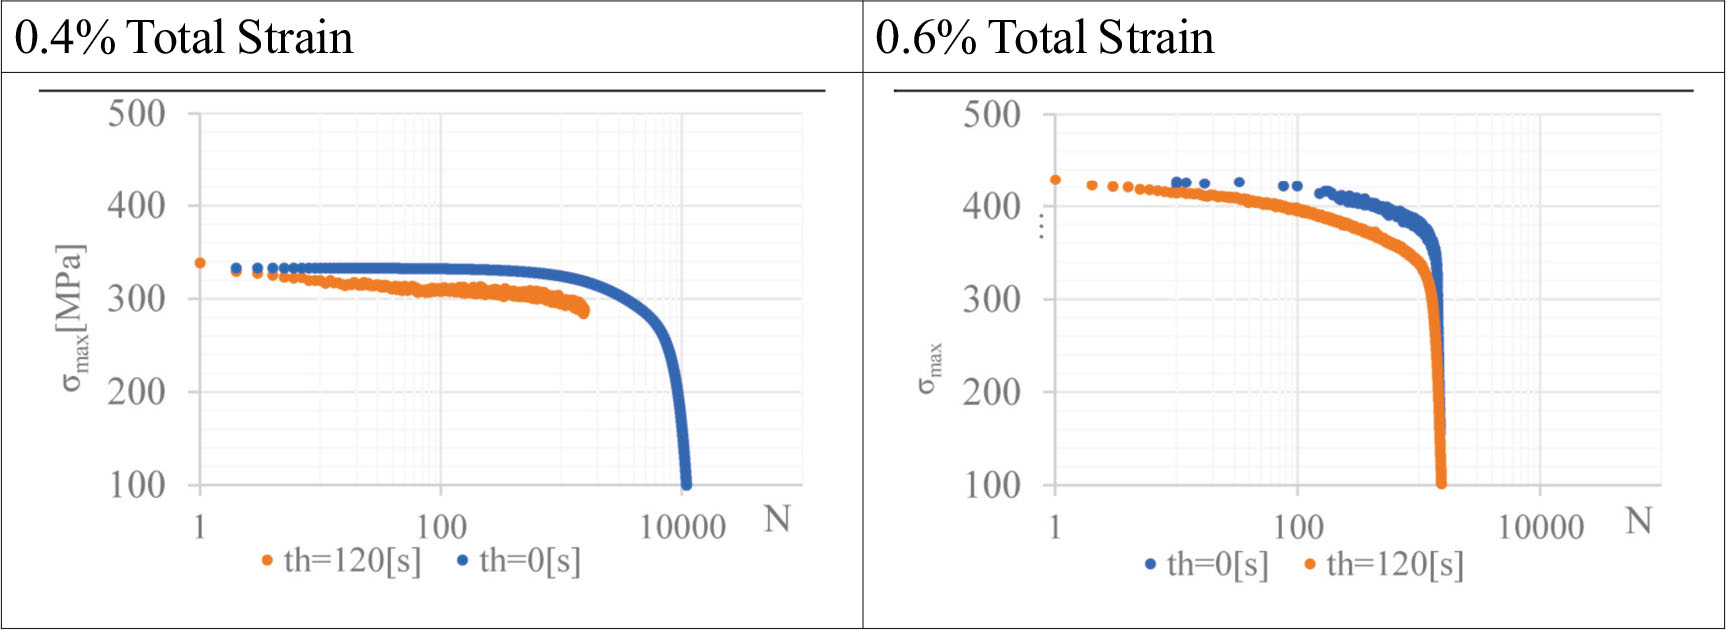
Figure 2.
Maximum stresses.
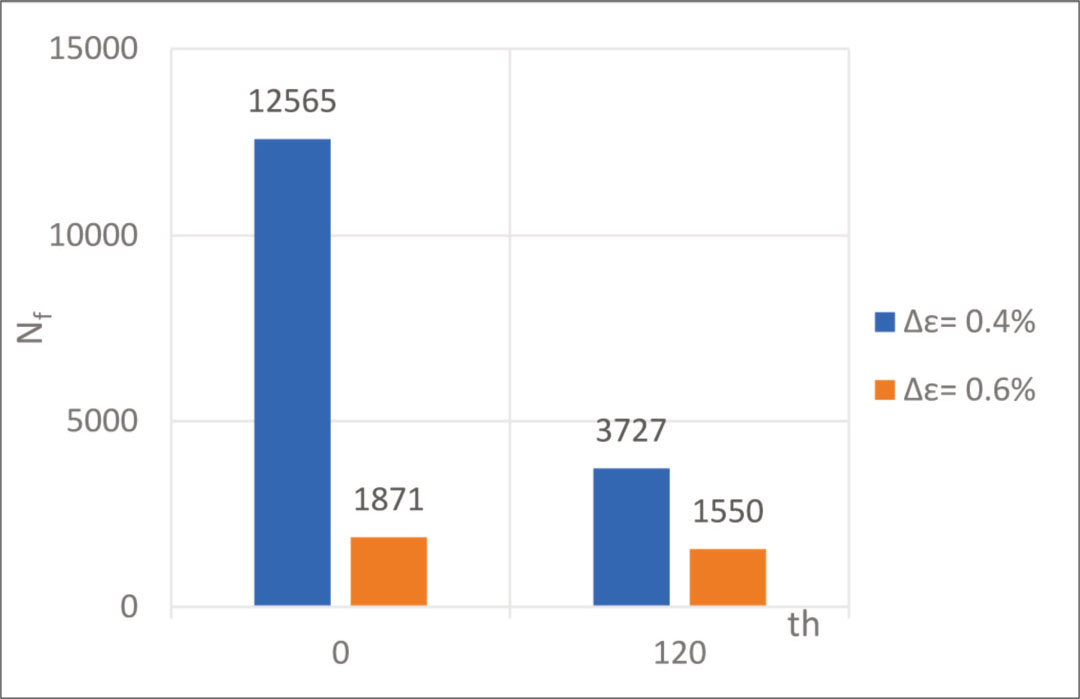
Figure 3.
Fatigue life for 0.4% and 0.6% Δε total stain.
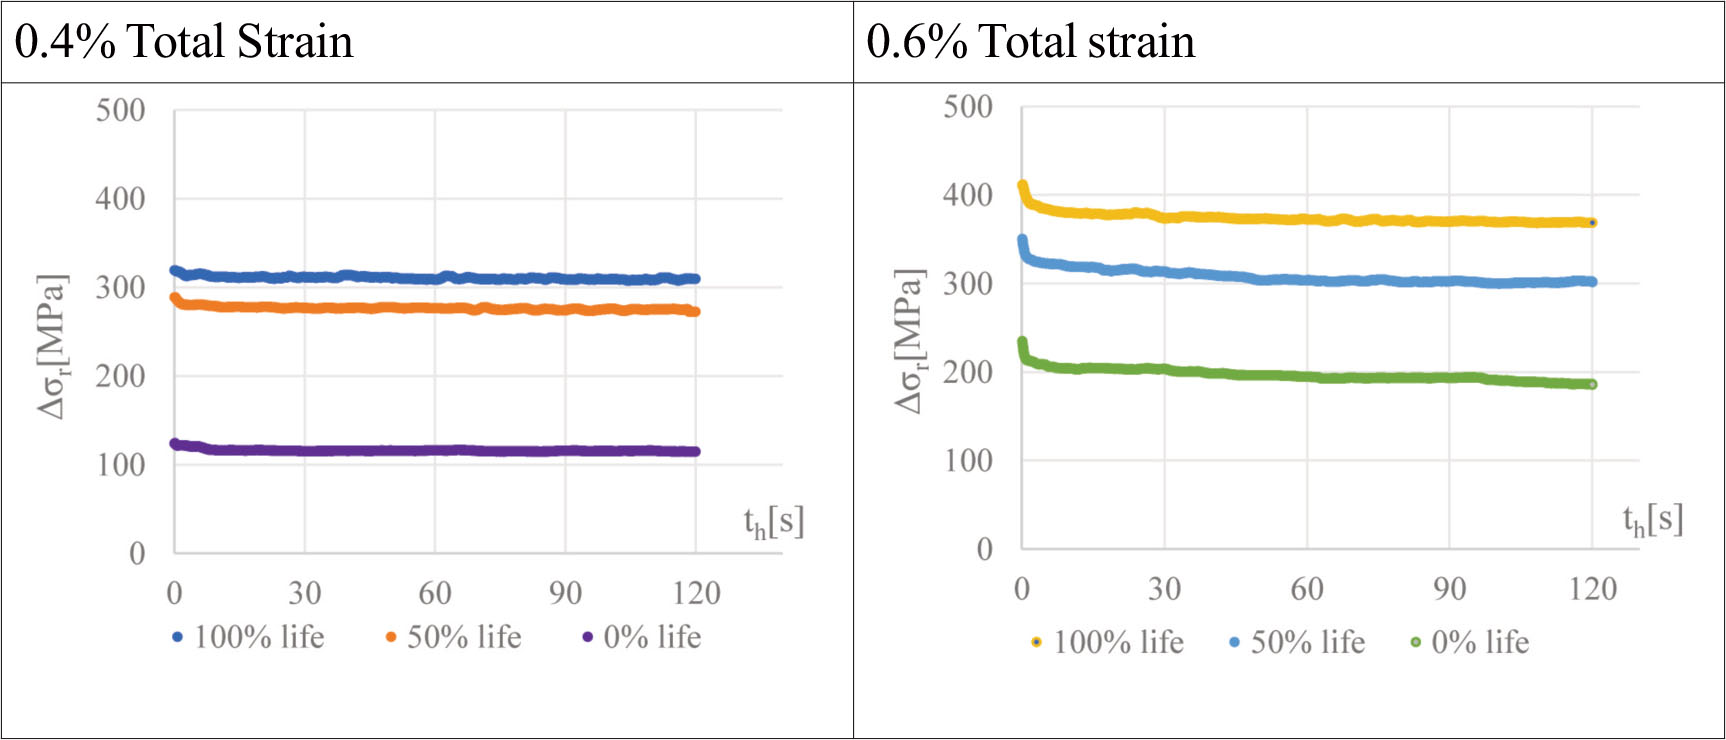
Figure 4.
Stress relaxation during hold time, th = 120 s.
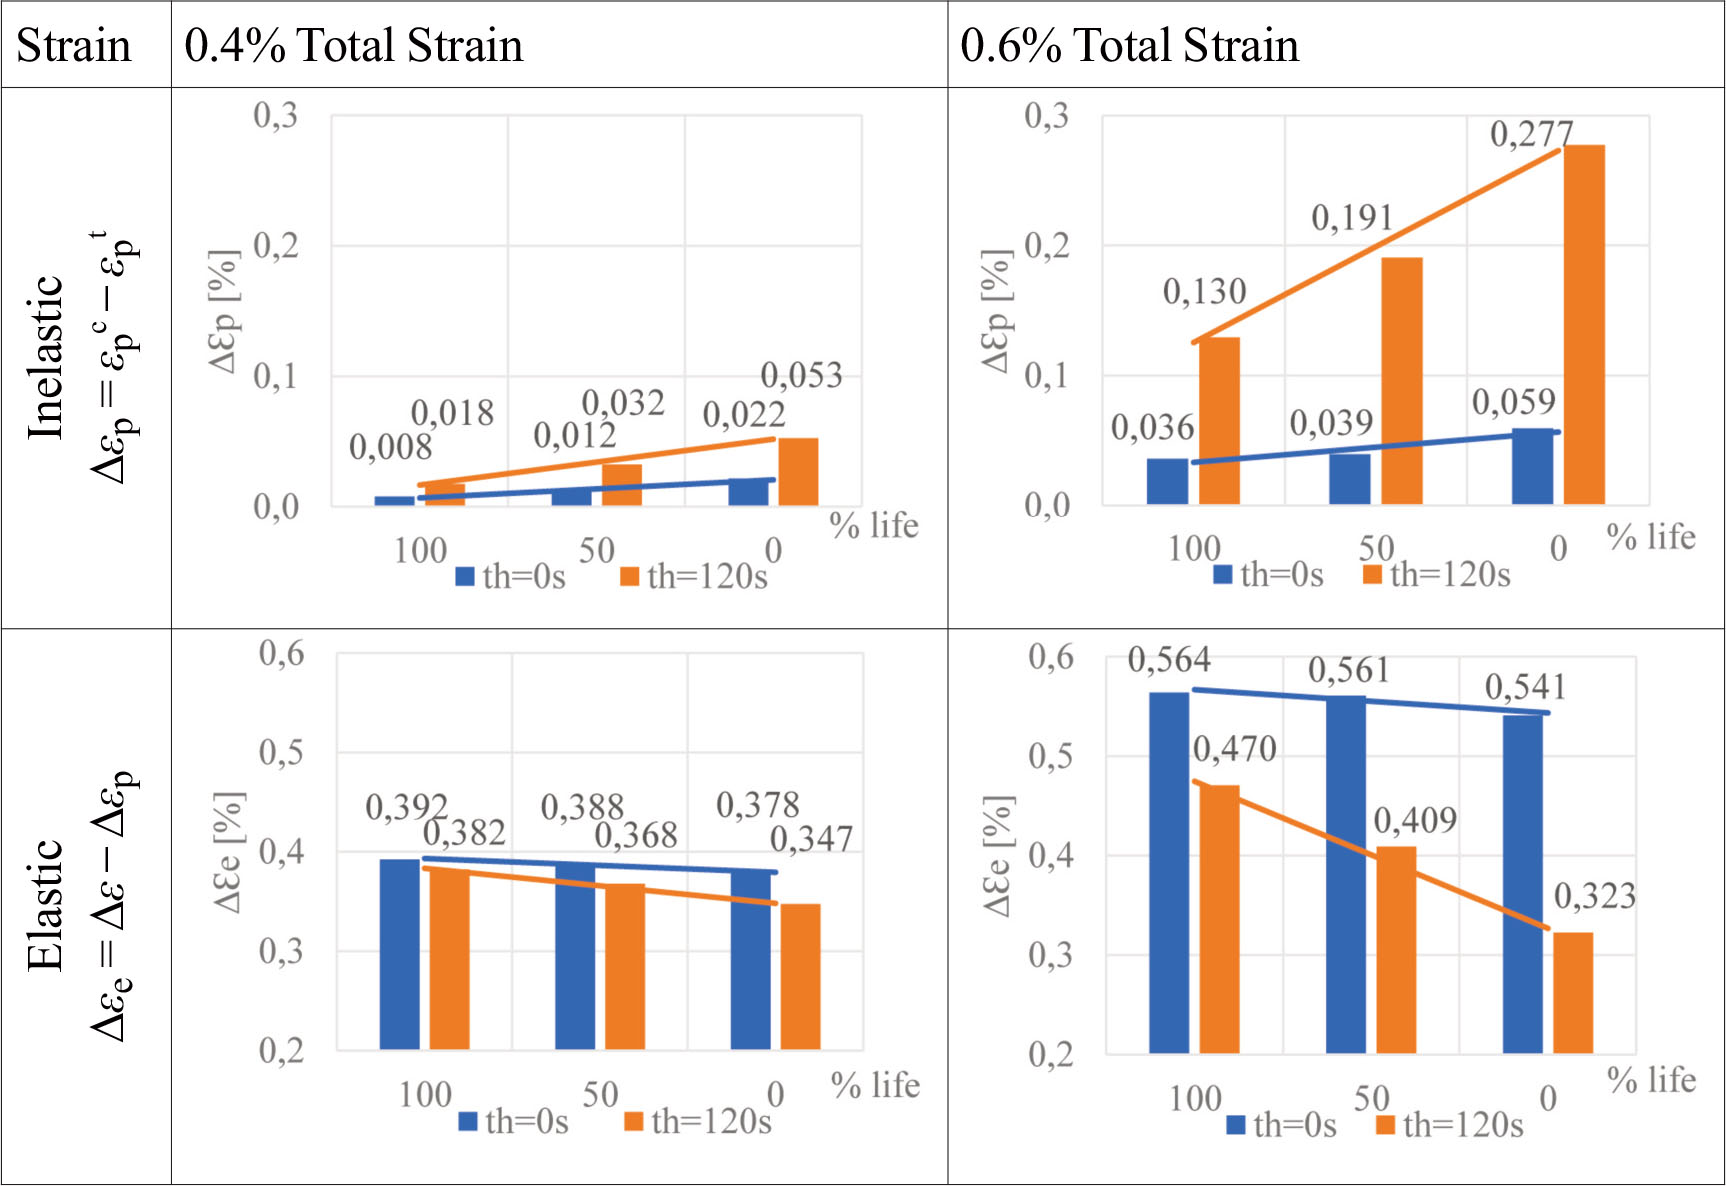
Figure 5.
Strain during tests for 0.4% and 0.6% of total strain.

Figure 6.
Alternating and mean stresses for 0.4% and 0.6% of total strain.