
Figure 1
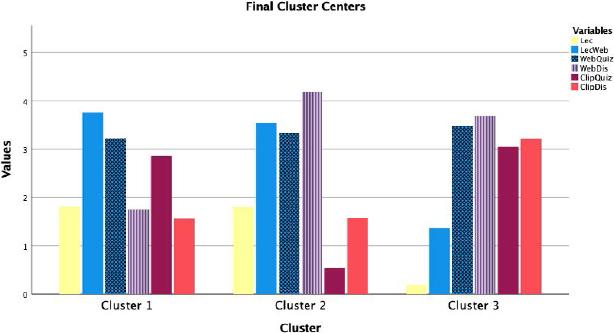
Figure 2
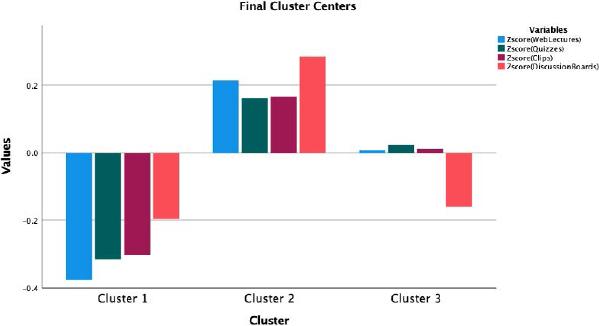
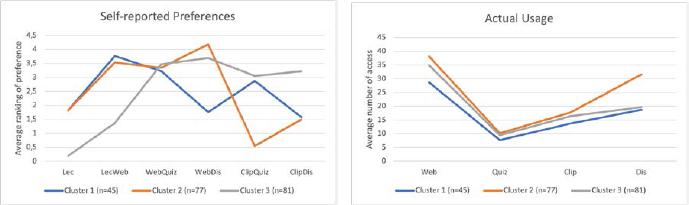
Figure 3
Descriptive statistics of students’ preferences and usage of online study materials in three clusters
| Indicator | Cluster 1 (n = 45) | Cluster 2 (n = 77) | Cluster 3 (n = 81) | Post hoc test (Games–Howell) | ||||
|---|---|---|---|---|---|---|---|---|
| Mean | SD | Mean | SD | Mean | SD | p < 0.05 | ||
| Preference (ranking of preference) | ||||||||
| Face-to-face lectures | 1.82 | 1.614 | 1.82 | 1.325 | 0.20 | 0.534 | C1 ≠ C3 | |
| Face-to-face lectures + Web lectures | 3.76 | 1.264 | 3.53 | 0.912 | 1.37 | 0.678 | C1 ≠ C3 | |
| Web lectures + quizzes | 3.22 | 1.580 | 3.34 | 1.314 | 3.47 | 1.215 | No significant | |
| Web lectures + discussion boards | 1.76 | 0.916 | 4.18 | 0.854 | 3.69 | 1.103 | C1 ≠ C3; C1 ≠ C2 | |
| Knowledge clips + quizzes | 2.87 | 1.160 | 0.55 | 0.640 | 3.05 | 1.213 | C1 ≠ C2 | |
| Knowledge clips + discussion boards | 1.58 | 1.559 | 1.50 | 1.056 | 3.22 | 1.378 | C1 ≠ C3 | |
| Usage (frequency of access) | ||||||||
| Web lectures | 28.69 | 14.318 | 38.16 | 16.691 | 34.86 | 15.657 | C1 ≠ C2 | |
| Quizzes | 7.67 | 5.568 | 10.18 | 4.814 | 9.44 | 5.341 | C1 ≠ C2 | |
| MOOC/knowledge clips | 13.71 | 6.858 | 17.70 | 9.750 | 16.38 | 7.835 | C1 ≠ C2 | |
| Discussion boards | 18.71 | 22.001 | 31.52 | 32.908 | 19.65 | 19.956 | C1 ≠ C2 | |
Description of one dataset for one student
| Student ID | Preference of materials | Usage of materials | Performance in the course |
|---|---|---|---|
| Ranking among 6 combinations of materials (6 indicators) | Frequency of access to 4 separate types of materials (4 indicators) | Assignment and final examination raw scores (8 indicators) | |
| e.g. Student 1 | Lec = 0 | Web = 30 | Assignments: |
| Notes for abbreviation: | |||
Descriptions of study materials and respective indicators of students’ use in Toledo
| Type of material | Description | Indicators of use |
|---|---|---|
| Web lectures | The teachers give presentations of learning contents with visual aids (PowerPoint slides, Excel spreadsheets, etc.) in Dutch. The lectures are recorded by the teachers then uploaded onto Toledo for students to watch freely. | Number of clicks |
| MOOC/knowledge clips | The teachers provide short videos that explain learning contents in Dutch/English. Students click onto the given links to be directed to an external Website such as YouTube (knowledge clips) or edX (MOOC) instead of staying on Toledo. | Number of clicks |
| Discussion boards (Q&A) | Students post questions on the common discussion board. The teachers and other students can reply to the posts to answer and/or elaborate. The Q&A can be in Dutch or English. | Number of posts created |
| Online quizzes | The teachers create quizzes on Toledo for students to test their understanding of learning contents on their own accord. The quizzes are in English. | Number of attempts |
Descriptive statistics of students’ preferences of online study materials
| Combinations of study materials | Number of students | Ranking of preference | |||
|---|---|---|---|---|---|
| Minimum | Maximum | Mean | Std. deviation | ||
| Face-to-face lectures | 203 | 0 | 5 | 1.17 | 1.405 |
| Face-to-face lectures + Web lectures | 203 | 0 | 5 | 2.72 | 1.437 |
| Web lectures + quizzes | 203 | 0 | 5 | 3.36 | 1.337 |
| Web lectures + discussion boards | 203 | 0 | 5 | 3.45 | 1.350 |
| Knowledge clips + quizzes | 203 | 0 | 5 | 2.06 | 1.563 |
| Knowledge clips + discussion boards | 203 | 0 | 5 | 2.24 | 1.533 |
Descriptive statistics of students’ usage of online study materials
| Material | Number of content items | Number of students | Number of views/clicks/attempts | |||
|---|---|---|---|---|---|---|
| Mean | Std. deviation | Mean per item | Std. deviation | |||
| Web lectures | 14 | 203 | 34.74 | 16.099 | 2.48 | 1.150 |
| Quizzes | 6 | 203 | 9.33 | 5.260 | 1.56 | 0.877 |
| MOOC/clips | 6 | 203 | 16.29 | 8.518 | 2.72 | 1.420 |
| Discussion boards | 38 | 203 | 23.95 | 26.570 | 0.63 | 0.699 |