
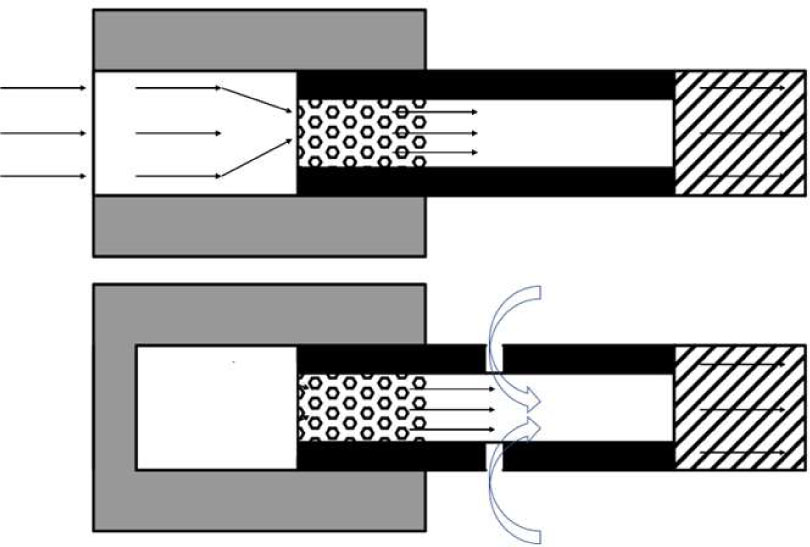
Figure 1.
Schematic of granule-based HTP cigarette and airflow pathways.
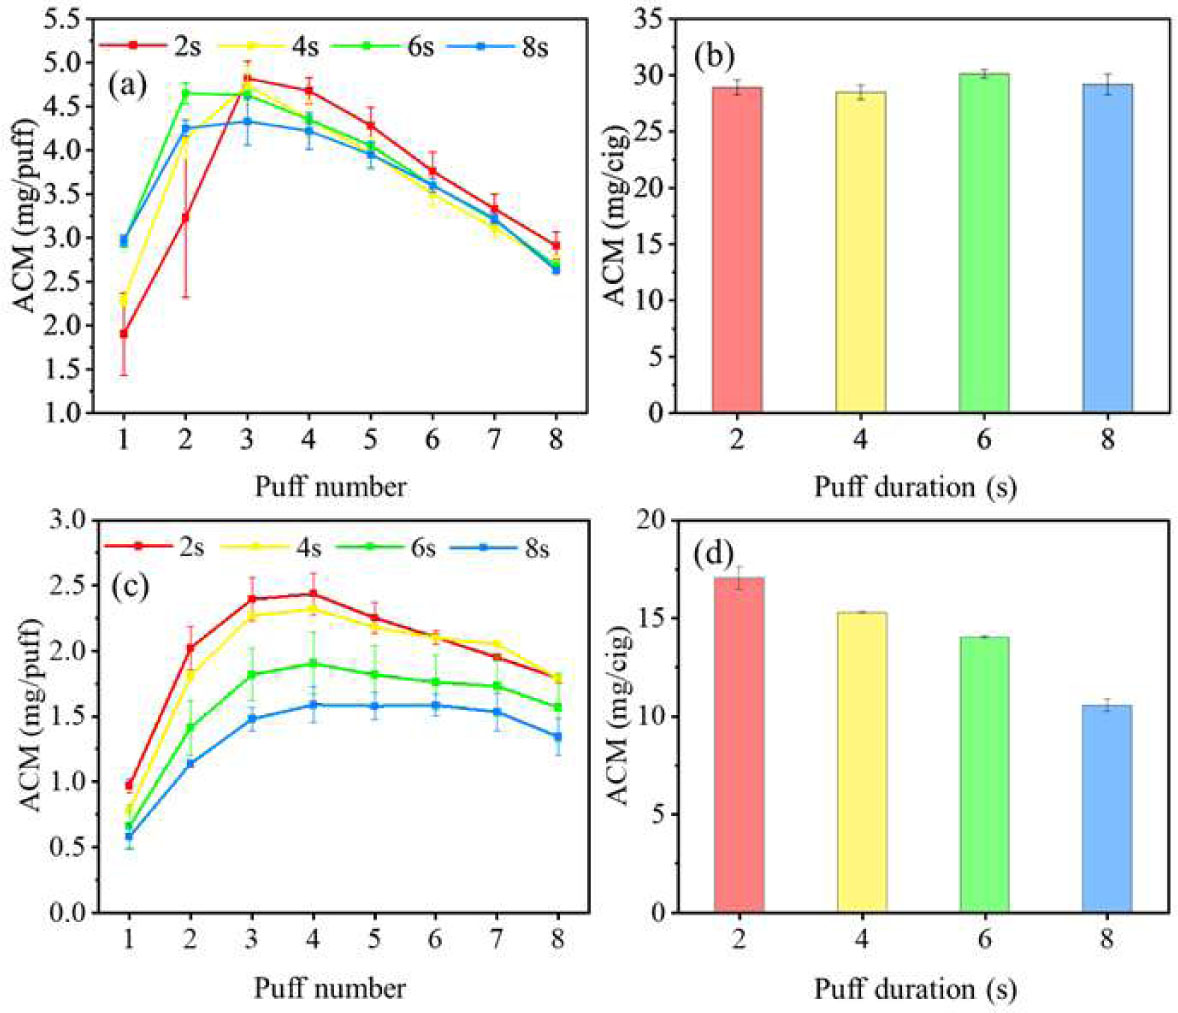
Figure 2.
Total and puff-by-puff ACM release amounts versus airflow velocity: (a), (b) open-ended and (c), (d) closed-ended configurations.
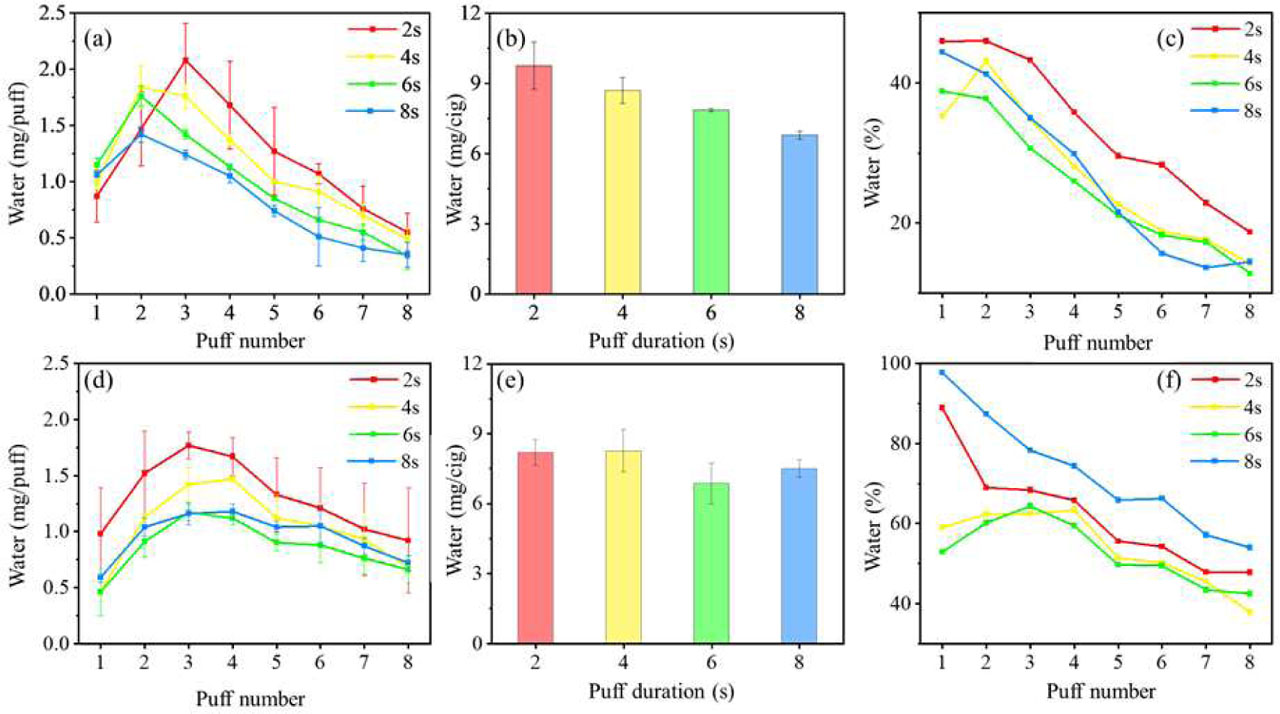
Figure 3.
Total and puff-by-puff water amounts and puff-by-puff water proportions versus airflow velocity: (a) – (c) open-ended and (d) – (f) closed-ended configurations.
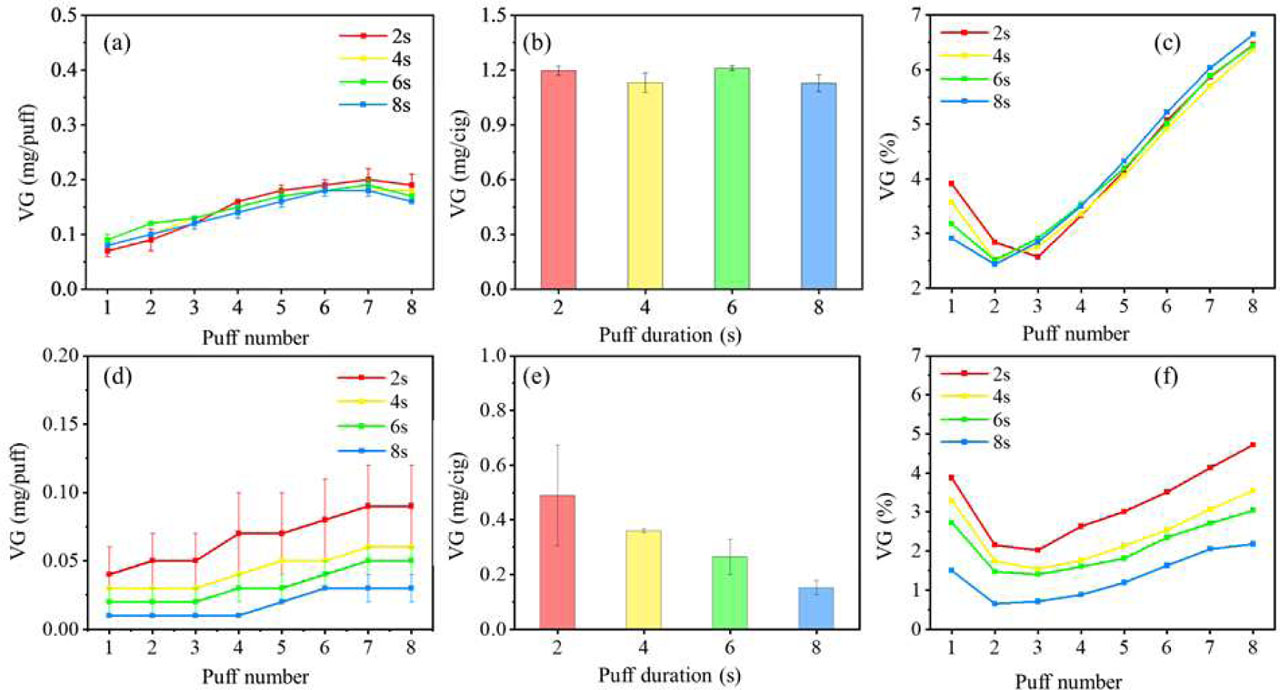
Figure 4.
Total and puff-by-puff glycerin amounts and puff-by-puff glycerin proportions versus puffing velocity: (a) – (c) open-ended and (d) – (f) closed-ended configurations.
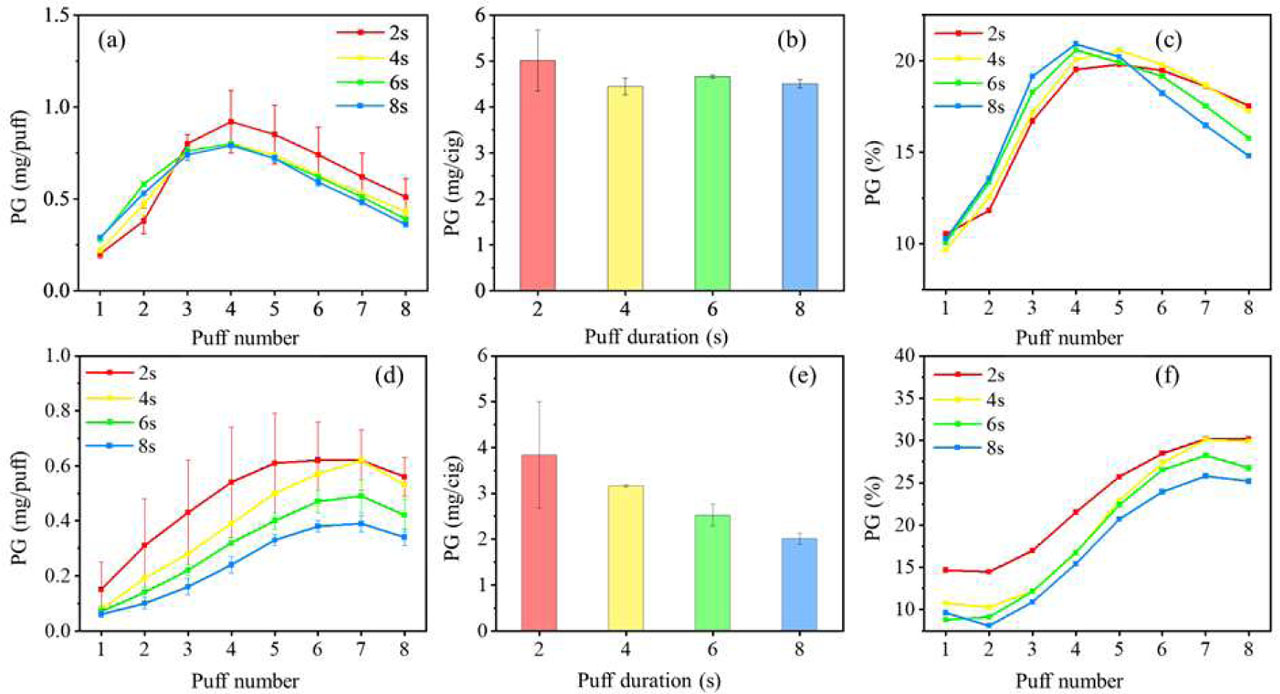
Figure 5.
Total and puff-by-puff propylene glycol amounts and puff-by-puff propylene glycol proportions versus airflow velocity: (a) – (c) open-ended and (d) – (f) closed-ended configurations.
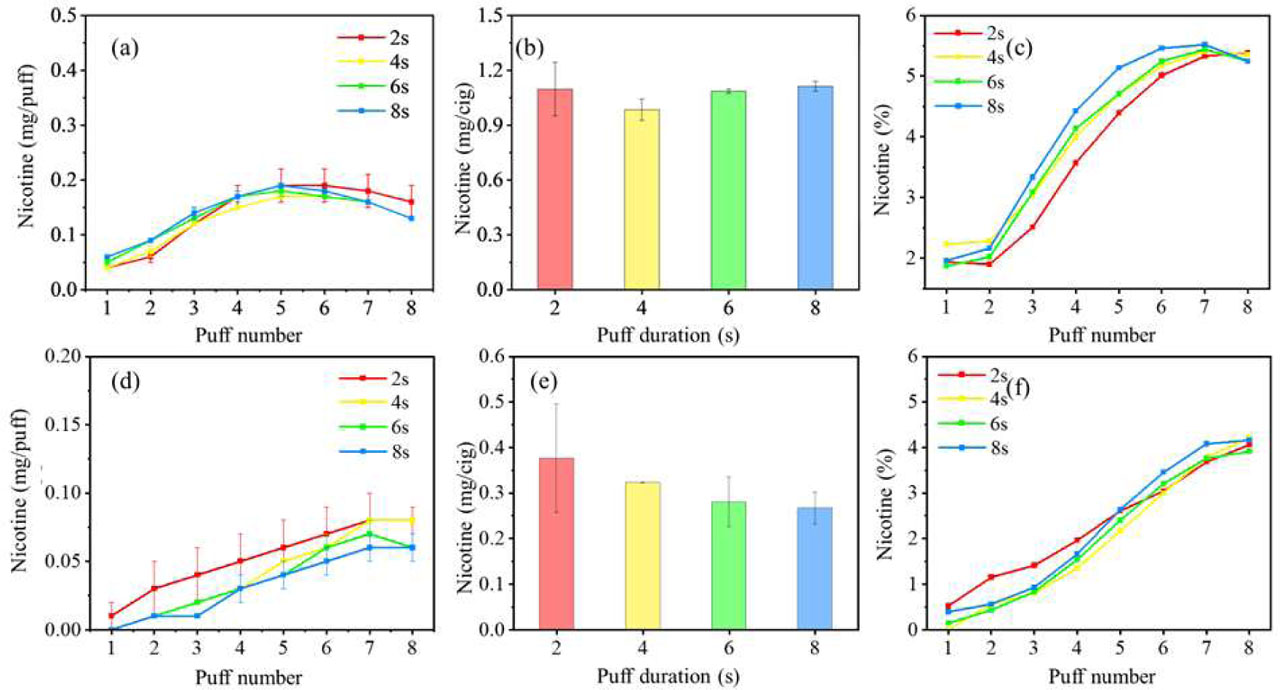
Figure 6.
Total and puff-by-puff nicotine amounts and puff-by-puff nicotine proportions versus airflow velocity: (a) – (c) open-ended and (d) – (f) closed-ended configurations.
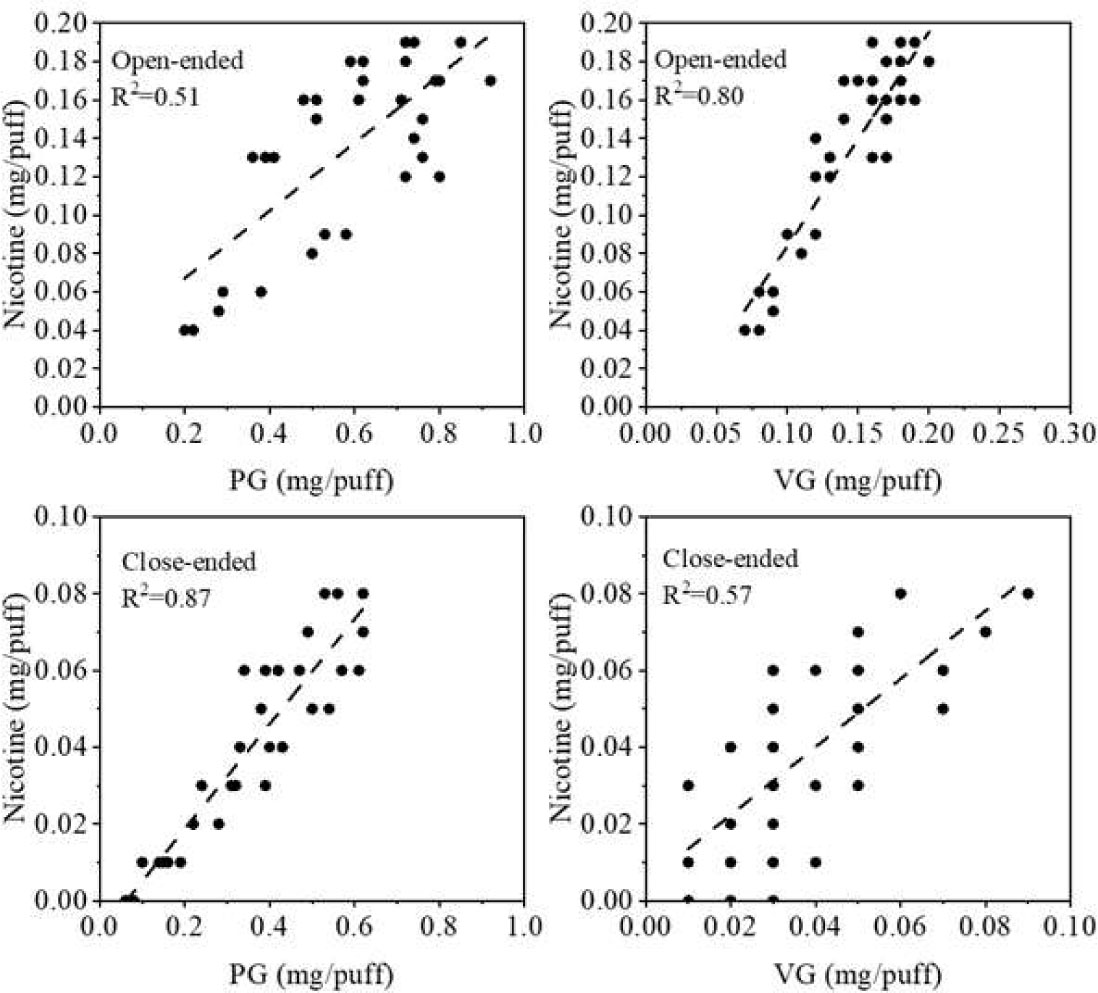
Figure 7.
Regressions between puff-by-puff propylene glycol and nicotine release and between puff-by-puff glycerin and nicotine release for two airflow pathways.
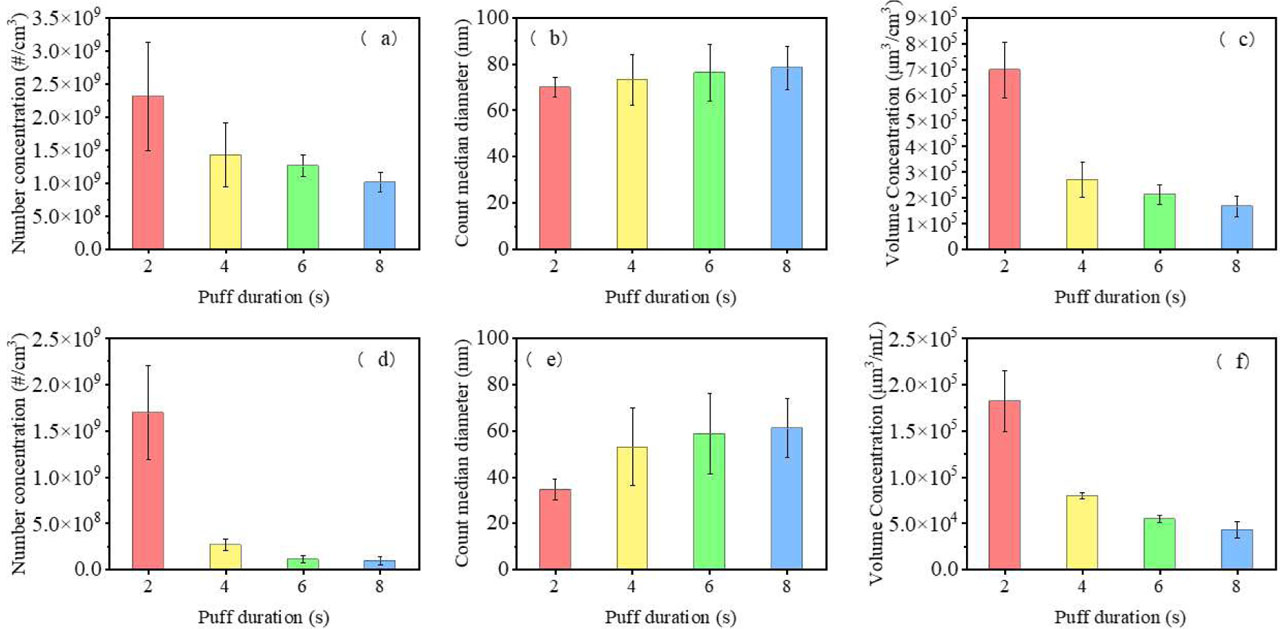
Figure 8.
Aerosol number concentration, count median diameter, and volume concentration versus airflow velocity: (a) – (c) open-ended and (d) – (f) closed-ended configurations.
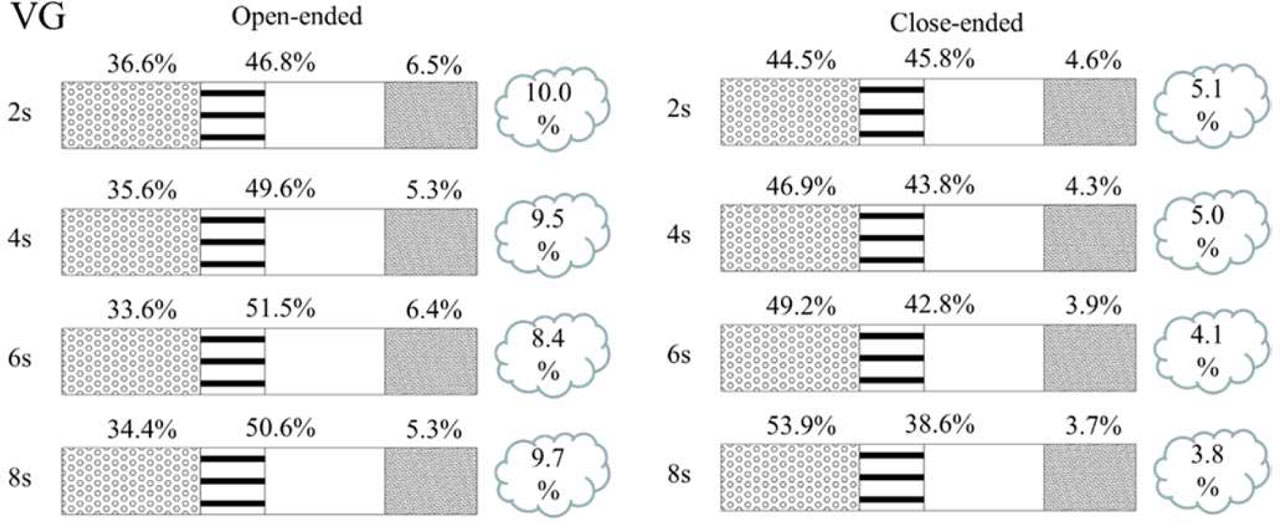
Figure 9.
Glycerin proportions in smoke and different segments of a cigarette under two airflow pathways.
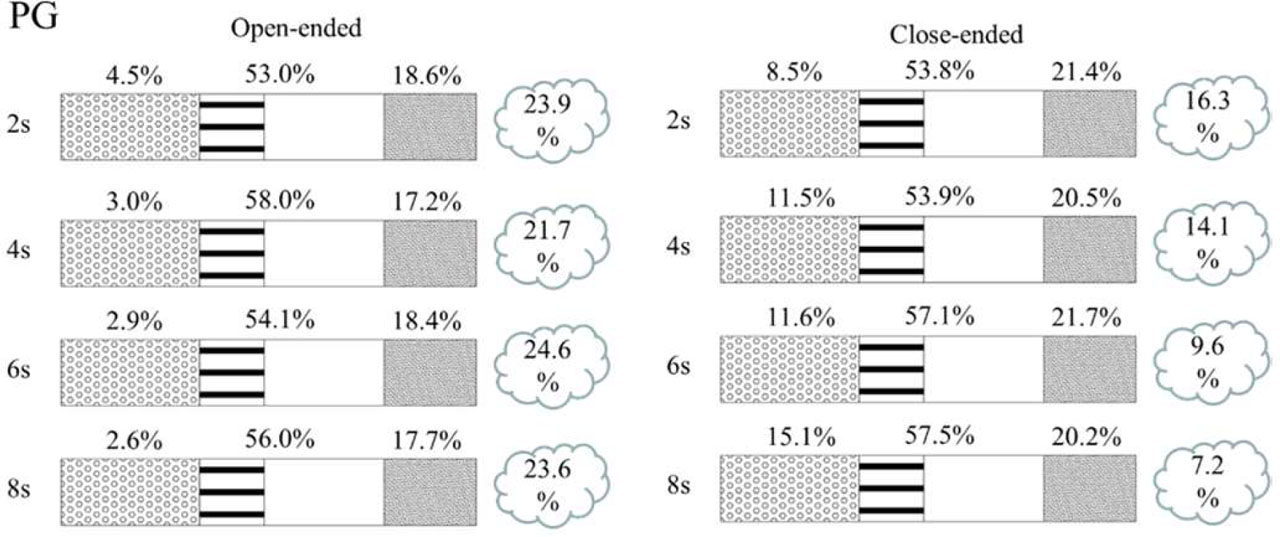
Figure 10.
Propylene glycol proportions in smoke and different segments of a cigarette under two airflow pathways.
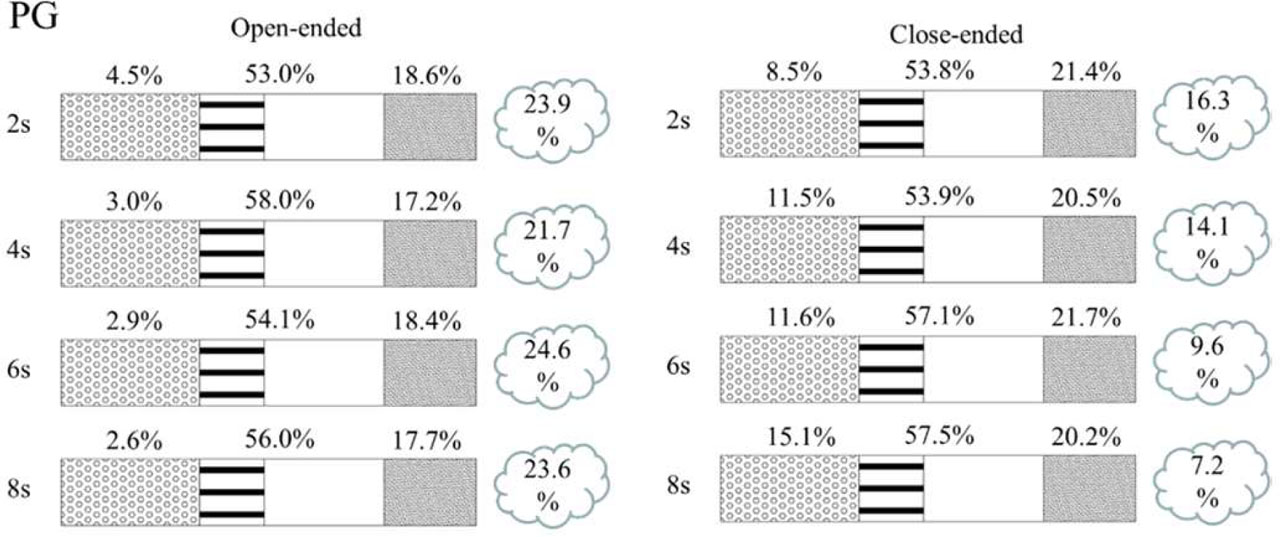
Figure 11.
Nicotine proportions in smoke and different segments of a cigarette under two airflow pathways.