
Partitioning of Electronic Nicotine Delivery Systems (ENDS) aerosol constituents between the liquid particle and vapor phase affects all aspects of their evaluation and measurement. The dynamic evolution of ENDS aerosols was recently highlighted and it was noted that aerosol dilution and residence time were critical parameters for measurement of their particle size distribution (1). Aerosol dilution and residence time primarily affect Brownian diffusion that is partially responsible, in addition to hydroscopic growth (condensation of water), for particle size growth of dense ENDS aerosols. This is consistent with the theoretical and experimental work demonstrating differences in the particle size distribution measurements among various aerosol instruments (cascade impactors, low pressure impactors, and optical particle counters) due to evaporation and condensation that occur within these aerosol instruments (2).
Particle size distribution measurement of concentrated, chemically complex, and temporally dynamic aerosols (e.g., ENDS products or mainstream/sidestream tobacco smoke) is difficult and requires compromises regardless of the method used (1, 3). Optical particle sizing methods use a light source (infrared, laser, etc.) to scan a small volume of aerosol that absorbs/scatters the light which is collected by one or more detectors. The pattern of light absorption/scattering is used to calculate the particle size distribution (4). As such, optical particle sizing methods do not directly interact with the aerosol and there are several challenges in using them reliably. Concentrated aerosols can present a unique challenge since coincidence counting is not only a function of particle concentration (number of particles per cm3) but also of the wavelength of the light source (in general shorter wavelength light has better resolution for the same volume). Coincidence counting occurs when two aerosol particles are too close together and are counted as one particle. Previous reports on ENDS aerosol particle concentrations have ranged from 1×10⁹/cm3 to 4.39 × 10⁹/cm3 (5, 6). This range of particle concentrations results in a coincidence counting concern that can only be resolved by diluting the aerosol sample. Without diluting the aerosol, this range of particle concentrations also can result in cloud behavior (7,8,9,10) within the small sensing volume of optical equipment that further complicates particle size distribution measurements. Another challenge in using optical particle sizing methods to measure particle size distribution arises from using the aerosol refractive index in the calculation. ENDS aerosols are temporally dynamic, which means depending on the relative humidity (RH), the humectants (propylene glycol and glycerin) are absorbing water (hygroscopicity) while simultaneously semi-volatile constituents are evaporating from the aerosol particles. Both processes, hygroscopicity and evaporation can change the refractive index of the aerosol resulting in a change in the particle size distribution. When comparing different ENDS products, the different chemical constituents will yield differences in the aerosol refractive index, and this will result in slight differences in the calculated particle size distribution among the ENDS products.
Although inertial particle sizing methods (e.g., cascade impactors, etc.) do directly interact with the aerosol by using the aerosol particle's inertia for size fractionation, there are also challenges to their use for measurement of the particle size distribution of ENDS aerosols. Cascade impactors are not generally affected by particle concentration unless they are overloaded and are not affected by refractive index, however they do require a constant airflow (4). One challenge is to match/interface the constant airflow of the cascade impactor with the ENDS puffing regimens. Unless numerous ENDS devices are sampled simultaneously some aerosol dilution is required to match the cascade impactor flow. Since cascade impactors operate under vacuum with a constant airflow, as the particle size cutoff of each impactor stage decreases, there is also a corresponding higher negative pressure, especially for low-pressure impactors (2). Since ENDS aerosols contain various semi-volatile constituents that have different vapor pressures (e.g., nicotine, propylene glycol, glycerin, and flavors) losses due to volatilization from the various impactor stages could occur during and after collection. Most impactor stages must be analyzed manually after aerosol collection either by gravimetric or chemical techniques, which could result in additional losses of very volatile constituents. One cascade impactor, Electrical Low Pressure Impactor (ELPI®+), electrically charges the aerosol particles and with electrometers on each stage counts the number of particles in real time, removing the need for post gravimetric or chemical analysis, however density of the aerosol is required to convert the measured count median diameter to a mass median diameter that is provided directly by other cascade impactors.
Recent work has attempted to identify (11), quantify (12, 13) and determine the evaporation time course (14) for some of the volatile constituents of ENDS aerosol. B
As summarized by recent work (1), past studies measuring the particle size distribution of ENDS aerosols have used different ENDS products, measured the particle size distribution at different times after generation due to the use of different aerosol sizing equipment that has required various dilutions of ENDS aerosols (1, 3, 5, 6, 15,16,17,18,19,20,21,22,23). The different aerosol sizing equipment also used different measurement principles (inertial cascade impactors; light scattering - optical particle counters; electrical - mobility diameters), so when combined with different ENDS aerosol dilutions, different ENDS products and time post aerosol generation, it is not surprising that different particle size distributions have been reported. Based upon this past work, it seems clear that the temporal and chemical dynamics of ENDS aerosol requires consideration of the volatile constituents when measuring the particle size distribution.
Another recent publication (24) noted that the impact of the volatility of propylene glycol and glycerin in ENDS aerosol on the performance of the cascade impactor systems has not been reported in the literature. In a few studies measuring the particle size distribution of ENDS aerosols, an indirect measure of volatile constituents has been reported (1, 3, 5, 12). For example, when a low flow cascade impactor was used, the reported collection efficiency ranged from 74% to 91% indicating that, depending on the specific ENDS product tested, between 9% and 26% of the generated aerosol mass was either deposited in the sampling apparatus or was in the vapor phase and not collected in the cascade impactor (3). In another study, a collection efficiency of approximately 90% was obtained using a similar low flow impactor with an e-liquid formulation containing only a mixture (40/60) of propylene glycol and glycerin (1).
The determination of ENDS particle size is necessary to understand product performance and to comply with the regulatory requirements in some locations. The most widely used method for determining particle size of ENDS aerosol is with a cascade impactor and both the Mini MOUDI™ and ELPI®+ have been used in recent publications (1, 24). Based upon the above considerations, ENDS aerosol particle size distribution was determined using two different cascade impactors (hereafter referred to as impactors) each requiring a different dilution. For each impactor setup the average residence time post aerosol generation was determined, and the volatile component of ENDS aerosol was collected as part of the particle size distribution measurement with volatile chemicals (some quantitatively and others qualitatively) subsequently measured off-line.
The two products tested (device + pods) were JUUL ENDS Mango flavor 5.0% nicotine by weight (w/w) and JUUL ENDS Mint flavor 5.0% nicotine by weight. This study started in 2020 shortly after Juul Labs, Inc. suspended commercial sales of all Mango (October 2019) and Mint (November 2019) flavored pods in the U.S. market. All pods containing the Mango- and Mint-flavored e-liquid were packaged in U.S. commercial packaging and were 11.5 to 12.5 months post manufacturing when testing was completed using the MSP-135-8 Mini MOUDI™ and ELPI®+, respectively. The primary constituents of both products are United States Pharmacopeia grade glycerin, propylene glycol, nicotine and benzoic acid combined with proprietary flavors. All devices were fully charged according to the manufacturer's instructions prior to testing.
The mass median aerodynamic diameter (MMAD) and geometric standard deviation (GSD) of the two products were determined using the MSP-135-8 Mini MOUDI™ impactor (MSP Corporation, Shoreview, MN, USA; currently a division of TSI® Shoreview, MN, USA) and the Electrical Low Pressure Impactor (ELPI®+; Dekati Ltd., Kangasala, Finland). The MSP-135-8 Mini MOUDI™ impactor has eight impaction cutoff sizes (10.0, 5.6, 3.2, 1.8, 1.0, 0.56, 0.32, and 0.18 μm), while the ELPI®+ has 14 impaction cutoff sizes (5.37, 3.66, 1.63, 0.911, 0.591, 0.315, 0.17, 0.097, 0.0496, 0.033, 0.0192, 0.0141, and 0.006 μm) and both have a filter to collect particles smaller than their respective minimum impaction cutoff size. The MSP-135-8 Mini MOUDI™ impactor uses replaceable aluminum substrates and a glass fiber filter. The ELPI®+ uses sintered metal plates with a small amount of vacuum oil on each plate and a pleated HEPA filter. The ISO puffing regimen for ENDS products (25) (55 mL over 3 s with 30 s interpuff interval) was used for both products and impactors.
To minimize potential dilution of the ENDs aerosol, the MSP-135-8 Mini MOUDI™ impactor was used as previously described (3). This method introduces the ENDS puff into a bias flow of ultra-zero air (2 ppm water; < 1% RH; Airgas) controlled by a mass flow meter (HFC-202, Teledyne Hastings Instruments, Hampton, VA, USA) for a total impactor flow of 2 L/min (3). In this setup, during the 3 s-puff, the 18.3 cm3/s of ENDS aerosol is mixed with an additional 15 cm3/s of ultra-zero (dilution) air resulting in 1 to 0.82 nominal dilution. The internal volume of the connection from the ENDS product to the impactor (3/8 inch Swagelok® “T”) was 1.1 cm3 resulting in a residence time of 0.06 s. In order to not exceed the maximum stage loading, the first five puffs using the ISO ENDS product puffing regimen (25) from three replicates of each product were used to determine the particle size distribution data. Previous studies with the same and similar JUUL products had demonstrated that the particle size distribution was independent of puff regimen (non-intense or intense puffing regimen), consistent throughout the pod life and over a twelve month controlled storage period (See Supplemental Tables 1–6). After completion of the fifth puff, flow through the impactor was maintained for 3–5 s so the aerosol from the fifth puff was pulled through the impactor. The total sampling time was 123–125 s. The size-fractionated particles deposited on pre-weighed 35mm aluminum foils (MSP Corporation) at each stage and filter were weighed post-sampling (Nimbus® analytical balance NBL-124i, Adam Equipment, Inc., Oxford, CT, USA) with the MMAD and GSD determined using the ISO standard (26). The collection efficiency (total mass on impactor stages and filter divided by pod mass loss) of each particle size distribution measurement was also determined. The mean of the three replicates of each product was used to determine the particle size distribution data.
Since the ELPI®+ has aerosol concentration limits due to stage mass loading limitations and requires approximately 10 L/min flowrate (ELPI®+ calibrated by Dekati Ltd. at 9.930 L/min), a custom dilution system was constructed that minimized the residence time by minimizing the total volume of the dilution system. The custom dilution device was assembled by connecting two 3/8 inch diameter Swagelock® stainless steel “Y”s (Figure 1).
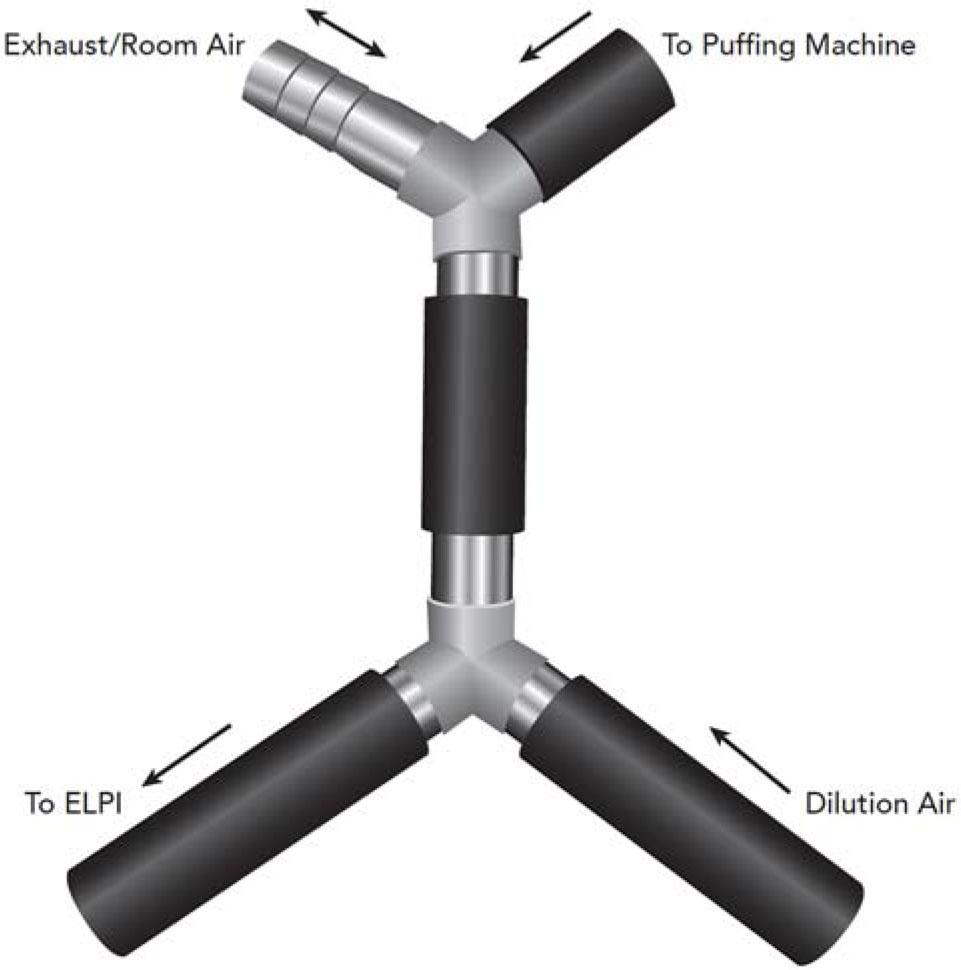
ELPI®+ custom dilution system consisting of two 3/8″ diameter Swagelock® stainless steel “Y”s with airflow connections.
The internal volume of the custom dilution system was measured by quantifying the amount of water required to fill it, resulting in a volume of 27.9 cm3. One end of the first “Y” was connected to the puffing machine (Burkhart Programmable Dual Syringe Pump, PDSP TE, Cerulean, MPRD Ltd., Milton Keynes, UK) and the other end was open to the laboratory environment. One end of the second “Y” supplied ultra-zero air (2 ppm water; < 1% RH; Airgas) as dilution controlled with a mass flow meter and the other end was connected to the ELPI®+ impactor. Although the ISO ENDS product puffing regimen was used (55 mL over 3 s with a 30 s interpuff interval) by the puffing machine, exhaust from the puffing machine into the dilution system occurred over 8 s. For each replicate run, the ELPI®+ and ultra-zero air dilution were set with mass flow meters and the air laboratory air entering the system was measured with flowmeter (Series 4000 flowmeter; TSI, Shoreview, MN, USA) to determine the amount of the puff sampled by ELPI®+. To make the amount of puff sampled calculation more accurate, aerosol deposition within the puffing machine was quantified by measuring the aerosol mass pre and post-puffing machine resulting in 29.045% deposition within the puffing machine that was used to adjust the amount of puff sampled. At the end of the 8 s puff, the exhaust/room air leg of the dilution system, as well as, the connection between the two “Y”s would be full of ENDS aerosol. The percent of puff sampled was calculated as a range including and excluding the volume of the exhaust/room air leg of the dilution system, which was measured at 6 cm3. Between puffs (22 s) the measured amount of room air entered the dilution system to provide the ELPI®+ with the required (approximately 10 L/min) flowrate. Based upon the required ELPI®+ dilution, ENDS puff sampling rate and limits of detection of the analytical methods for vapor phase constituents, a total of 100 puffs for each ENDS product replicate measurement were performed. The total sampling time was 49.5 min. Because the ELPI®+ counts the number of charged particles that land on each impactor stage, to determine the MMAD, GSD and collection efficiency in a similar manner as was done for the Mini MOUDI™ impactor, required using the ELPI®+ software to provide aerosol concentration in mg/m3 and then converting the mg/m3 output of the ELPI®+ to mg using the total amount of air sampled. An aerosol particle density of 1.15 g/cm3 was used by the ELPI®+ software to provide aerosol concentration in mg/m3 since the two most abundant primary ingredients were glycerin (1.26 g/cm3) and propylene glycol (1.04 g/cm3). After conversion to mg, the MMAD and GSD were determined using the ISO standard (26). Recovery efficiency of each particle size distribution measurement was calculated using the mass sampled by the ELPI®+ divided by the percent of puffs sampled, which then was divided by the pod mass loss. The ENDS devices were oriented at a 45° angle to gravity for puffing. A total of six replicate measurements were performed using the ELPI®+ for each ENDS product.
During particle size distribution measurements using the MSP-135-8 Mini MOUDI™ impactor, the 2 L/min total vacuum flow was split using mass flow controllers. A flow of 100 mL/min using a mass flow controller (MKS 179 MassFlo®, Andover, MA, USA) was pulled through a custom in-house constructed (Enthalpy Analytical, Richmond, VA, USA) thermal desorption tube (Camsco, Houston, TX, USA) using Tenax GR, Carbotrap B and Carboex 569 sorbents (Sigma-Aldrich, St. Louis, MO, USA) and subsequently analyzed using EPA and ISO Gas Chromatograph/Mass Spectroscopy (GC/MS) methods (27, 28) and the rest of the flow was exhausted to waste. Total amount of volatile compounds collected was based upon a ratio to an internal standard. Since the two ENDS products were tested on separate days, one room air blank sample was collected each day to correct samples for background levels of volatile compounds.
During particle size distribution measurements using the ELPI®+, the approximately 10 L/min vacuum flow was collected using a trap cooled with liquid nitrogen placed in line between the rough pump and ELPI®+. The trap was allowed to equilibrate for 30 min prior to volatile compound sampling. After particle size distribution samples were collected, the vacuum was shut off, one side of the trap was closed down completely, and the other side was disconnected from the ELPI®+, so a custom thermal desorption tube could be inserted. The trap was allowed to come to room temperature, allowing the contents to be trapped onto the custom thermal desorption tube at 200 mL/min flowrate controlled by a mass flow controller (MKS 179 MassFlo®). To ensure complete sampling, a small vacuum pump was attached to the end of the thermal desorption tube and vacuum was drawn for approximately 1 min before capping the thermal desorption tube. The thermal desorption tubes were subsequently analyzed using EPA and ISO Methods (27, 28).
The EPA and ISO methods (27, 28) provide quantitative determination of 86 chemical compounds and semi-quantitative determination of another 370 chemicals (See Supplemental Tables 7 and 8, respectively, for list of compounds). A room air blank was collected after the particle size distribution and vapor phase measurements had been collected. Chemicals identified in the room air blanks, regardless of amount, were removed from chemicals reported for the respective vapor samples. All particle size distribution and vapor collections and measurements were conducted in a laboratory with a controlled temperature range of 21–22° C and RH of 56–60%.
The aerosol generation, particle size distribution determination, and volatile chemical sampling were performed by Enthalpy Analytical, Inc. (Durham, NC, USA, division of Montrose Environmental Group) and the volatile chemical analysis was performed by Prism Analytical Technologies (Mt. Pleasant, MI, USA, division of Montrose Environmental Group). The aerosol generation, particle size distribution determination, and volatile chemical analytical methods were validated and were on the respective contract research organizations ISO 17025 scope of accreditation (29) at the time the study was performed.
There were small differences between the ELPI®+ flowrate set by mass flow controller and the ELPI®+ calibration flowrate of 9.930 L/min (Table 1). There were also small differences in the amount of laboratory air that entered the dilution system between puffs for the Mango- and Mint-flavored ENDS products that resulted in a difference of approximately 100-fold in the average puff dilution for the Mango- and Mint-flavored ENDS products (Table 1). ELPI®+ data temporal analysis indicated each ENDS aerosol puff was sampled for approximately 20 s, meaning that the residual ENDS aerosol in the exhaust/room air leg and connection of the two “Y”s of the dilution system at the end of the 8 s puff exhaust, was fully analyzed.
ELPI®+ dilution system measurements and calculations.
| Product | Replicate | Set by mass flow controller | Measured | Calculations | |||
|---|---|---|---|---|---|---|---|
| ELPI®+ flowrate (L/min) | Zero air dilution (L/min) | Laboratory air entering dilution system (L/min) | Puff volume (cm3) | Range of percent of puff sampled by ELPI®+ a | Puff dilution ratio b | ||
| Mango 5.0% (nicotine by weight) | 1 | 9.859 | 9.829 | 0.030 | 55.4 | 5.1 – 12.8 | 329 |
| 2 | 9.826 | 9.792 | 0.034 | 55.6 | 5.8 – 13.4 | 289 | |
| 3 | 9.817 | 9.794 | 0.023 | 55.6 | 3.9 – 11.6 | 427 | |
| 4 | 9.913 | 9.890 | 0.023 | 55.6 | 3.9 – 11.6 | 431 | |
| 5 | 9.915 | 9.878 | 0.037 | 55.6 | 6.3 – 14.0 | 268 | |
| 6 | 9.939 | 9.911 | 0.028 | 55.4 | 4.8 – 12.5 | 355 | |
| Mean ± SD | 9.878 ± 0.051 | 9.840 ± 0.065 | 0.029 ± 0.006 | 55.5 ± 0.1 | 6.0 ± 1.0 – 12.7 ± 1.0 | 350 ± 68 | |
| Mint 5.0% (nicotine by weight) | 1 | 9.912 | 9.977 | 0.035 | 55.4 | 6.0 – 13.7 | 283 |
| 2 | 9.952 | 9.913 | 0.039 | 55.4 | 6.7 – 14.3 | 255 | |
| 3 | 9.962 | 9.928 | 0.034 | 55.5 | 5.8 – 13.5 | 293 | |
| 4 | 9.959 | 9.908 | 0.051 | 55.2 | 8.7 – 16.5 | 195 | |
| 5 | 9.961 | 9.914 | 0.047 | 55.6 | 8.0 – 15.6 | 212 | |
| 6 | 10.024 | 9.984 | 0.040 | 55.6 | 6.8 – 14.5 | 251 | |
| Mean ± SD | 9.962 ± 0.036 | 9.937 ± 0.034 | 0.041 ± 0.007 | 55.5 ± 0.2 | 7.0 ± 1.1 – 14.7 ± 1.2 | 248 ± 39 | |
SD = standard deviation
Range of percent of puff sampled = amount of laboratory air sampled over the 8 s exhaust of the pump with and without the 6 cm3 volume from the exhaust arm of dilution system divided by the total puff flow and multiplied by 1 minus aerosol deposition efficiency within the puffing machine piston. Measured aerosol deposition within the puffing machine piston was 29.045% so 1 minus deposition efficiency = 70.955 % of the puff aerosol mass was available for sampling.
Ratio of ELPI®+ flowrate set by mass flow controller (column 3) divided by measured amount of laboratory air entering the dilution system (column 5), which is also the amount of the puff that was sampled for the 8 s exhaust from the puffing machine.
There were small differences in the average MMAD and GSD for the Mango- and Mint-flavored ENDS products when measured by the two impactors with greater differences for the Mango-flavored ENDS product (Table 2). This was consistent with puffs from the Mango-flavored ENDS being diluted 100 times more than the puffs from the Mint-flavored ENDS. The ELPI®+ provided consistently larger GSD values, however the biggest difference between the two impactors was the calculated recovery efficiency.
Measurement of Particle Size Distribution and Recovery Efficiency Calculations.
| Product | Replicate | Impactor | |||||
|---|---|---|---|---|---|---|---|
| Mini MOUDI™ | ELPI®+ | ||||||
| MMAD (μm) | GSD | Recovery % | MMAD (μm) | GSD | Recovery range (%) a | ||
| Mango 5.0% (nicotine by weight) | 1 | 0.83 | 1.48 | 79.1 | 1.13 | 1.69 | 62.9 – 157.0 |
| 2 | 0.90 | 1.54 | 77.3 | 1.13 | 1.69 | 59.8 – 138.6 | |
| 3 | 0.78 | 1.46 | 77.0 | 1.14 | 1.67 | 51.3 – 152.2 | |
| 4 | NP | NP | NP | 1.17 | 1.67 | 53.3 – 158.1 | |
| 5 | NP | NP | NP | 0.98 | 1.66 | 59.4 – 132.4 | |
| 6 | NP | NP | NP | 1.21 | 1.72 | 54.6 – 142.6 | |
| Mean ± SD | 0.84 ± 0.06 | 1.49 ± 0.04 | 77.8 ± 1.1 | 1.13 ± 0.08 | 1.68 ± 0.02 | 56.8 ± 4.5 – 146.8 ± 10.5 | |
| Mint 5.0% (nicotine by weight) | 1 | 1.04 | 1.50 | 79.8 | 1.04 | 1.65 | 56.2 – 128.7 |
| 2 | 1.10 | 1.40 | 79.3 | 0.96 | 1.58 | 65.0 – 139.0 | |
| 3 | 1.02 | 1.48 | 82.9 | 1.09 | 1.66 | 62.0 – 144.9 | |
| 4 | NP | NP | NP | 0.81 | 1.62 | 69.4 – 130.6 | |
| 5 | NP | NP | NP | 0.85 | 1.65 | 68.8 – 134.2 | |
| 6 | NP | NP | NP | 1.07 | 1.67 | 63.0 – 134.3 | |
| Mean ± SD | 1.05 ± 0.4 | 1.46 ± 0.05 | 80.7 ± 1.9 | 0.97 ± 0.12 | 1.64 ± 0.03 | 64.1 ± 4.9 – 135.3 ± 5.9 | |
GSD = geometric standard deviation; MMAD = mass median aerodynamic diameter; NP = not performed; SD = standard deviation
Based upon percent puff sampled range from Table 1.
There were substantial differences in the number and amount of volatile chemicals identified in the air blank samples from each impactor (Table 3). This trend continued with substantially more volatile chemicals identified in the exhaust from the ELPI®+ impactor compared to the Mini MOUDI™ impactor (Tables 4 and 5).
Chemicals identified in impactor air blank samples.
| Mini MOUDI™ | ELPI®+ | ||||||
|---|---|---|---|---|---|---|---|
| Quantitative | Semi-quantitative | Quantitative | Semi-quantitative | ||||
| Chemical | Quantity (ng) | Chemical | Quantity (ng) | Chemical | Quantity (μg) | Chemical | Quantity (μg) |
| Acetone | 77 | Diethylene glycol | 100 | Acetone* | 5.9 | Propylene + propane | 0.3 |
| Methylene chloride | 22 | C6-C8 Hydrocarbon | 230 | Methylene chloride * | 14 | Dichlorodifluoro methane | 0.1 |
| Hexane | 11 | Acetic acid | 130 | Hexane | 1.4 | Isobutane | 0.2 |
| Acetonitrile | 59 | Acetonitrile | 0.1 | Butane | 0.4 | ||
| Ethylacetate | 7.8 | Ethylacetate | 0.05 | Acetaldehyde | 0.9 | ||
| Carbon disulfide | 15 | Carbon Disulfide | 0.9 | 2-Methylbutane | 0.7 | ||
| Ethanol | 0.4 | Trichlorofluoro methane | 0.4 | ||||
| Toluene | 0.1 | Pentane | 0.4 | ||||
| 1,1,2-Trichloro-1,2,2-trifluoroethane | 0.09 | Isoprene | 0.4 | ||||
| Isopropanol | 1.2 | 3-Methylpentane | 0.3 | ||||
| Carbon tetrachloride | 0.04 | 2-Methyl-2-propenal | 0.2 | ||||
| Isopropylbenzene | 0.06 | Methylcyclopentane | 0.4 | ||||
| Cyclohexane | 0.02 | Butanal | 0.09 | ||||
| Isooctane | 0.3 | Methyl ethyl ketone | 0.1 | ||||
| Chloroform | 0.05 | Pentanal | 0.1 | ||||
| Benzene | 0.04 | Propylene glycol | 0.4 | ||||
| 4-Methyl-2-pentanone | 0.006 | Hexanal | 0.2 | ||||
| m,p-Xylene | 0.03 | α-Pinene | 0.1 | ||||
| o-Xylene | 0.02 | Octanal | 0.1 | ||||
| 1,2,4-Trimethylbenzene | 0.009 | Nonanal | 0.3 | ||||
| Ethylbenzene | 0.007 | Decanal | 0.4 | ||||
| Naphthalene | 0.006 | Undecanal | 0.1 | ||||
| Diethyl ether* | 5.9 | Tetradecane | 0.2 | ||||
| Dodecanal | 0.1 | ||||||
| Pentadecane | 0.1 | ||||||
| 2-Dodecanone | 0.3 | ||||||
| 2-Tridecanone | 0.4 | ||||||
| 2,6-Ditertbutylphenol | 0.1 | ||||||
| Siloxane | 0.1 | ||||||
| C13-C15 Hydrocarbon | 0.1 | ||||||
| C15-C17 Hydrocarbon | 0.1 | ||||||
Value exceeded calibration range by more than a factor of 10.
Quantitative and semi-quantitative analysis of vapor phase constituents from the Mini MOUDI™ Impactor. Unless otherwise noted chemicals listed were found in all three replicate samples.
| Product | Chemical | CAS # | Amount (Mean ± SD) | ||
|---|---|---|---|---|---|
| Measured (μg/sorbent tube) | Calculated for entire sampled volume (μg) | Collected aerosol (μg/mg) | |||
| Quantitative analysis Mini MOUDI™ | |||||
| Mango 5.0% (nicotine by weight) | Total amount a | NA | 65.5 ± 21.1 | 1310 ± 422 | 77.6 ± 25.0 |
| Ethanol | 64-17-5 | 38.2 ± 13.3 | 764 ± 266 | 45.2 ± 15.8 | |
| Isopropanol | 67-63-0 | 0.076 ± 0.015 | 1.52 ± 0.3 | 0.09 ± 0.02 | |
| Toluene | 108-88-3 | 0.007 ± 0.001 | 0.14 ± 0.02 | 0.008 ± 0.001 | |
| Mint 5.0% (nicotine by weight) | Total amount a | NA | 34.8 ± 23.6 | 696 ± 472 | 36.2 ± 24.5 |
| Ethanol b | 64-17-5 | 0.05 | 1.0 | 0.05 | |
| Isopropanol c | 67-63-0 | 0.08 ± 0.02 | 1.6 ± 0.4 | 0.08 ± 0.02 | |
| p-Isopropyltoluene c | 99-87-6 | 0.007 ± 0.001 | 0.14 ± 0.02 | 0.14 ± 0.02 | |
| Benzene b | 71-43-2 | 0.008 | 0.16 | 0.008 | |
| Toluene b | 108-88-3 | 0.008 | 0.16 | 0.008 | |
| m,p-Xylene b | 108-38-3 or 106-42-3 | 0.02 | 0.4 | 0.02 | |
| Semi-quantitative analysis Mini MOUDI™ | |||||
| Mango 5.0% (nicotine by weight) | Propylene glycol | 57-55-6 | 27.5 ± 11.9 | 550 ± 238 | 32.6 ± 14.1 |
| Nicotine | 54-11-5 | 0.17 ± 0.12 | 3.4 ± 2.4 | 0.2 ± 0.1 | |
| Menthol | 89-78-1 or 1490-04-6 | 0.098 ± 0.004 | 1.96 ± 0.08 | 0.116 ± 0.005 | |
| Acetaldehyde | 75-07-0 | 0.83 ± 0.12 | 16.6 ± 2.4 | 0.98 ± 0.14 | |
| Ethylbutyrate | 105-54-4 | 0.35 ± 0.1 | 7.0 ± 2.0 | 0.41 ± 0.12 | |
| Methylcyclopentane c | 96-37-7 | 0.145 ± 0.078 | 2.90 ± 1.56 | 0.17 ± 0.09 | |
| Limonene or | 138-86-3 or 5989-27-5 | 0.182 ± 0.045 | 3.64 ± 0.9 | 0.22 ± 0.05 | |
| Decanalc | 112-31-2 | 0.15 ± 0.06 | 3.0 ± 1.2 | 0.18 ± 0.07 | |
| 3-Methylpentane b | 96-14-0 | 0.2 | 4.0 | 0.24 | |
| Linalool c | 78-70-6 | 0.09 ± 0.01 | 1.8 ± 0.2 | 0.11 ± 0.01 | |
| Nonanal b | 124-19-6 | 0.09 | 1.8 | 0.11 | |
| 3-Hexen-1-ol | 544-12-7 | 0.53 ± 0.18 | 10.6 ± 3.6 | 0.62 ± 0.21 | |
| Allyl hexanoate b | 123-68-2 | 0.088 ± 0.013 | 1.76 ± 0.26 | 0.1 ± 0.02 | |
| 2-Methyl-4-phenyl-1H-imidazole b | 13739-48-5 | 0.043 ± 0.012 | 0.86 ± 0.24 | 0.051 ± 0.014 | |
| Mint 5.0% (nicotine by weight)* | Propylene glycol | 57-55-6 | 20.1 ± 16.8 | 402 ± 336 | 20.9 ± 17.5 |
| Nicotine c | 54-11-5 | 0.15 ± 0.13 | 3.0 ± 2.6 | 0.16 ± 0.14 | |
| Acetol c | 116-09-6 | 0.07 | 0.05 – 0.09 | 0.003 – 0.005 | |
| Acetaldehyde b | 75-07-0 | 0.8 | 1.6 | 0.083 | |
| 3-Octanol b | 589-98-0 | 0.05 | 1.0 | 0.052 | |
| Decanal c | 112-31-2 | 0.2 ± 0.1 | 4.0 ± 2.0 | 0.21 ± 0.1 | |
| Eucalyptol c | 470-82-6 | 0.28 ± 0.1 | 5.6 ± 2.0 | 0.29 ± 0.1 | |
| Menthone c | 89-80-5 | 0.67 ± 0.39 | 13.4 ± 7.8 | 0.7 ± 0.4 | |
| Menthol c | 89-78-1 or 1490-04-6 | 5.4 ± 3.5 | 108 ± 70 | 5.6 ± 3.6 | |
| Menthyl acetate c | 89-48-5 | 0.11 ± 0.06 | 2.2 ± 1.2 | 0.11 ± 0.06 | |
| Benzyl alcohol c | 100-51-6 | 0.09 ± 0.01 | 1.8 ± 0.2 | 0.094 ± 0.01 | |
| Nonanal b | 124-19-6 | 0.3 | 6.0 | 0.3 | |
| 1,1-Difluorethane | 75-37-6 | 4.0 | 0.09 – 8.0 | 0.005 – 0.42 | |
| 2-Methyl-4-phenyl-1H-imidazole c | 13739-48-5 | 0.045 | 0.04 – 0.05 | 0.002 – 0.003 | |
| Nerylacetone b | 3879-26-3 | 0.09 | 1.8 | 0.09 | |
NA = not available; SD = standard deviation
C6-C8 and C9-C11 hydrocarbons found.
Calculated based upon internal standard, summation of individual chemical levels will not match due to semi-quantitative analysis.
Found in one of three samples.
Found in two of three samples (mean ± range).
Quantitative and semi-quantitative analysis of vapor phase constituents from the ELPI®+ Impactor. Unless otherwise noted chemicals listed were found in all six replicate samples.
| Product | Chemical | CAS # | Mean ± SD (μg/collection) | Collected aerosol (μg/mg) |
|---|---|---|---|---|
| Quantitative analysis ELPI®+ | ||||
| Mango 5.0% (nicotine by weight) | Total amount a | NA | 9.5 ± 2.9 | 0.07 ± 0.03 |
| 1,3-Butadiene b | 106-99-0 | 0.02 | 0.00014 | |
| Tetrahydrofuran | 109-99-9 | 0.0147 ± 0.0006 | 0.0001 ± 0.000004 | |
| 2-Methyl-1-propanol c | 78-83-1 | 0.0009 ± 0.0001 | 0.000006 ± 0.0000007 | |
| Methyl tertiary butyl ether f | 1634-04-4 | 0.021 ± 0.027 | 0.00015 ± 0.00019 | |
| trans 1,2-Dichloroethene c | 156-60-5 | 0.007 ± 0.001 | 0.00005 ± 0.000007 | |
| 1,2-Dichloroethane b | 107-06-2 | 0.0065 ± 0.0005 | 0.000046 ± 0.000035 | |
| Bromodichloromethane b | 75-27-4 | 0.007 | 0.00005 | |
| Styrene b | 100-42-5 | 0.005 | 0.000035 | |
| Bromoform b | 75-25-2 | 0.009 | 0.00006 | |
| 1,3,5-Trimethylbenzene b | 108-67-8 | 0.006 | 0.000043 | |
| p-Isopropyltoluene b | 99-87-6 | 0.005 | 0.000035 | |
| Ethylmethacrylate c | 97-63-2 | 0.006 ± 0.002 | 0.0000436 ± 0.000014 | |
| Trichloroethene b | 79-01-2 | 0.007 | 0.00005 | |
| Mint 5.0% (nicotine by weight) | Total amount a | NA | 15.5 ± 7.6 | 0.21 ± 0.1 |
| 1,3-Butadiene b | 106-99-0 | 0.03 | 0.0004 | |
| Tetrahydrofuran | 109-99-9 | 0.023 ± 0.014 | 0.0003 ± 0.0002 | |
| trans 1,2-Dichloroethene c | 156-60-5 | 0.014 ± 0.006 | 0.0002 ± 0.00008 | |
| Styrene b | 100-42-5 | 0.009 | 0.00012 | |
| 1,3,5-Trimethylbenzene b | 108-67-8 | 0.005 | 0.000067 | |
| p-Isopropyltoluene | 99-87-6 | 0.027 ± 0.005 | 0.00036 ± 0.000067 | |
| Tetrachloroethene c | 127-18-4 | 0.0135 ± 0.0065 | 0.00018 ± 0.000087 | |
| Diethyl ether b | 60-29-7 | 0.06 | 0.0008 | |
| Naphthalene c | 91-20-3 | 0.0075 ± 0.0005 | 0.0001 ± 0.000007 | |
| 1,2-Dichloroethane b | 107-06-2 | 0.008 | 0.00011 | |
| Bromodichloromethane b | 75-27-4 | 0.007 | 0.00009 | |
| Semi-quantitative analysis ELPI®+ | ||||
| Mango 5.0% (nicotine by weight) f | 2-Methyl-1-propene b | 115-11-7 | 0.1 | 0.0007 |
| 1-Propanol b | 71-23-8 | 0.3 | 0.002 | |
| Menthol | 89-78-1 or 1490-04-6 | 1.08 ± 0.46 | 0.008 ± 0.003 | |
| Menthone f | 89-80-5 | 0.138 ± 0.057 | 0.001 ± 0.0002 | |
| Ethylbutyrate | 105-54-4 | 2.62 ± 1.58 | 0.02 ± 0.1 | |
| Limonene or | 138-86-3 or 5989-27-5 | 0.3 ± 0.17 | 0.002 ± 0.001 | |
| Decanoic acid e | 334-48-5 | 0.1 ± 0.0 | 0.0007 ± 0.0 | |
| Noanaoic acid e | 112-05-0 | 0.125 ± 0.05 | 0.0009 ± 0.0004 | |
| 2-Pentanone | 107-87-9 | 0.182 ± 0.078 | 0.001 ± 0.0006 | |
| Propanal e | 123-38-6 | 0.15 ± 0.06 | 0.001 ± 0.0004 | |
| 2-Methylpentane e | 107-83-5 | 0.12 ± 0.05 | 0.0009 ± 0.0004 | |
| tert-Butanol b | 75-65-0 | 0.1 | 0.0007 | |
| Methyl vinyl ketone d | 78-94-4 | 0.17 ± 0.06 | 0.001 ± 0.0004 | |
| 4-Methyloctane | 2216-34-4 | 0.1 ± 0.0 | 0.0007 ± 0.0 | |
| Heptanal | 111-71-7 | 0.183 ± 0.075 | 0.0013 ± 0.0005 | |
| Ethylhexanoate e | 123-66-0 | 0.125 ± 0.05 | 0.0009 ± 0.0004 | |
| Acetic acid b | 64-19-7 | 0.1 | 0.0007 | |
| Diethylene glycol c | 11-46-6 | 0.15 ± 0.05 | 0.001 ± 0.0004 | |
| 3-Methylbutanol b | 590-86-3 | 0.09 | 0.0006 | |
| Hexamethylchclotrisiloxane c | 541-05-9 | 0.1 ± 0.0 | 0.0007 ± 0.0 | |
| Mint 5.0% (nicotine by weight) f | Limonene or | 138-86-3 or 5989-27-5 | 0.2 ± 0.0 | 0.0027 ± 0.0 |
| Heptane b | 142-82-5 | 0.095 ± 0.005 | 0.001 ± 0.0001 | |
| Propanal b | 123-38-6 | 0.1 | 0.001 | |
| Menthol | 89-78-1 or 1490-04-6 | 6.25 ± 3.71 | 0.084 ± 0.05 | |
| Menthone | 89-80-5 | 1.82 ± 0.78 | 0.024 ± 0.01 | |
| Eucalyptol | 470-82-6 | 0.72 ± 0.19 | 0.01 ± 0.003 | |
| Benzaldehyde c | 100-52-7 | 0.15 ± 0.05 | 0.002 ± 0.0007 | |
| 4-methyloctane e | 2216-34-4 | 0.2 ± 0.0 | 0.003 ± 0.0 | |
| 2-Methyl-1-propene d | 115-11-7 | 0.17 ± 0.12 | 0.0023 ± 0.0016 | |
| Trimethylsilanol d | 1066-40-6 | 0.1 ± 0.0 | 0.001 ± 0.0 | |
| 2-Methylpentane c | 107-83-5 | 0.2 ± 0.14 | 0.003 ± 0.002 | |
| tert-Butanol e | 75-65-0 | 0.15 ± 0.06 | 0.002 ± 0.0008 | |
| Methyl vinyl ketone d | 78-94-4 | 0.2 ± 0.1 | 0.003 ± 0.001 | |
| 2-Pentanone | 107-87-9 | 0.2 ± 0.1 | 0.003 ± 0.001 | |
| Heptanal e | 111-71-7 | 0.3 ± 0.2 | 0.004 ± 0.003 | |
| Acetic acid e | 64-19-7 | 0.12 ± 0.5 | 0.002 ± 0.007 | |
| Hexamethylchclotrisiloxane d | 541-05-9 | 0.097 ± 0.006 | 0.013 ± 0.0001 | |
| Chlorodifluormethane b | 75-45-6 | 0.1 | 0.001 | |
| 1,1-Difluoroethane b | 75-37-6 | 0.4 | 0.005 | |
| Nonanoic acid c | 112-05-0 | 0.45 ± 0.15 | 0.006 ± 0.002 | |
| 2-Methyl-2-propenal b | 78-85-3 | 0.4 | 0.005 | |
| 2-Hexanone b | 591-52-4 | 0.1 | 0.001 | |
| Pentanoic acid b | 109-52-4 | 0.1 | 0.001 | |
| 3-Octanol b | 589-98-0 | 0.2 | 0.003 | |
| Heptanoic acid b | 111-14-8 | 0.1 | 0.001 | |
| Triacetin b | 102-76-1 | 0.1 | 0.001 | |
NA = not available; SD = standard deviation
Calculated based upon internal standard, summation of individual chemical levels will not match due to semi-quantitative analysis.
Found in one of six samples.
Found in two of six samples (mean ± range).
Found in three of six samples.
Found in four of six samples.
Found in five of six samples.
Numerous unidentified hydrocarbons with various number of carbon atoms (C6-C8, C7-C9, C8-C10, C9-C11, C10-C12, C12-C14, C13-C15, C14-C16, and C15-C17) and siloxanes.
The mean total amount of volatile chemicals measured (background corrected) in the exhaust air of the Mini MOUDI™ impactor for JUUL Mango 5.0% ENDS was 65.5 ± 21.1 μg/thermal desorption tube and for Mint 5.0% ENDS was 34.8 ± 23.6 μg/thermal desorption tube. Since the thermal desorption tube flowrate represented only 1/20th of the total Mini MOUDI™ impactor flowrate (100 cm3/min vs. 2000 cm3/min) a mean total of 1.31 mg and 696 μg/Mini MOUDI™ impactor exhaust sample could be used to recalculate the recovery efficiency for JUUL Mango 5.0% and Mint 5.0% ENDS products, respectively (Table 6). For JUUL Mango 5.0%, the range of total device mass loss (mass loss of the pod) for the six samples using the Mini MOUDI™ impactor was from 17.4–23.3 mg. The mean of 1.31 mg of volatile compounds represents 5.6–7.5% of the device mass loss and resulted in an average recovery efficiency of 82.8% for JUUL Mango 5.0% ENDS when volatile chemicals were included. A similar situation occurred with the Mint 5.0% ENDS products where the mean amount of measured volatile compounds was 34.8 μg/thermal desorption tube or 696 μg/Mini MOUDI™ impactor exhaust sample. The range of device mass loss for the three samples of JUUL Mint 5.0% ENDS was 22.20–23.80 mg, so the volatile compounds represented 3.1–3.6% of the collected aerosol mass and resulted in an average recovery efficiency for these samples of 83.1%. The mean total amount of volatile chemicals measured (background corrected) in the ELPI®+ impactor exhaust from JUUL Mango 5.0% ENDS ranged from 40 to 360 μg/replicate and from JUUL Mint 5.0% ENDS from 60 to 430 μg/replicate considering the range in amount of puff sampled in each replicate. With the pod mass loss for the ELPI®+ impactor samples ranging from 34.2–201.2 mg, the measured volatile compounds did not substantively change the recovery efficiency for these samples (< 0.4%; Table 6).
Collection efficiency calculated including the measured vapor phase.
| Impactor | Parameter | Mango 5.0% (nicotine by weight) | Mint 5.0% (nicotine by weight) | ||||
|---|---|---|---|---|---|---|---|
| Replicate 1 | Replicate 2 | Replicate 3 | Replicate 1 | Replicate 2 | Replicate 3 | ||
| Mini MOUDI™ | Device mass loss (mg) | 20.60 | 23.30 | 17.40 | 23.80 | 22.20 | 23.40 |
| Mass collected (mg)* | 16.30 | 18.00 | 13.40 | 19.00 | 17.60 | 19.40 | |
| Calculated mass of volatiles (mg) | 1.08 | 0.62 | 1.24 | 0.68 | 0.08 | 0.96 | |
| Recovery efficiency (%) a | 84.4 | 79.9 | 84.1 | 82.7 | 79.6 | 87.0 | |
| Mango 5.0% (nicotine by weight) | |||||||
| Replicate 1 | Replicate 2 | Replicate 3 | Replicate 4 | Replicate 5 | Replicate 6 | ||
| ELPI®+ | Device mass loss (mg) | 116.8 | 122.0 | 185.5 | 201.2 | 65.1 | 155.4 |
| Mass collected (mg)* | 73.4 – 183.4 | 72.9 – 169.1 | 95.1 – 282.4 | 107.2 – 318.2 | 38.1 – 86.2 | 84.8 – 221.6 | |
| Calculated mass range of volatiles (mg) | 0.06 – 0.16 | 0.04 – 0.1 | 0.07 – 0.21 | 0.12 – 0.36 | 0.09 – 0.19 | 0.07 – 0.19 | |
| Recovery efficiency range (%) | 62.9 – 157.2 | 59.8 – 138.7 | 51.3 – 152.4 | 53.3 – 158.3 | 58.7 – 132.7 | 54.6 – 142.7 | |
| Mint 5.0% (nicotine by weight) | |||||||
| Replicate 1 | Replicate 2 | Replicate 3 | Replicate 4 | Replicate 5 | Replicate 6 | ||
| Device mass loss (mg) | 96.5 | 71.9 | 113.7 | 34.2 | 43.4 | 89.1 | |
| Mass collected (mg)* | 54.3 – 124.2 | 46.8 – 99.9 | 70.5 – 164.7 | 23.7 – 45.0 | 29.9 – 58.3 | 56.1 – 119.7 | |
| Calculated mass range of volatiles (mg) | 0.06 – 0.13 | 0.10 – 0.21 | 0.14 – 0.33 | 0.06 – 0.11 | 0.08 – 0.16 | 0.20 – 0.43 | |
| Recovery efficiency range (%) | 56.3 – 128.8 | 65.1 – 139.2 | 67.2 – 145.1 | 69.5 – 131.9 | 69.1 – 134.7 | 63.2 – 134.8 | |
Measured on each stage and final filter of Mini MOUDI™ and only on each stage of ELPI®+ based upon percent of puff sampled.
Revised mean collection efficiency including calculated volatiles for Mango 5.0% = 84.5 ± 3.2% and for Mint 5.0% = 81.6 ± 7.7%.
The differences in total puffing duration, dilution air setups, and the resulting differences in aerosol residence times between the two impactors resulted in:
- 1)
Small to no differences in the average MMAD;
- 2)
Consistently larger GSD values from the ELPI®+;
- 3)
Substantially larger number of vapor phase constituents measured with the ELPI®+;
- 4)
Less total vapor phase mass measured by the ELPI®+ from the two JUUL ENDS products used in this study;
- 5)
Collection efficiency range consistently greater than 100% for the two JUUL ENDS products from the ELPI®+ measurements.
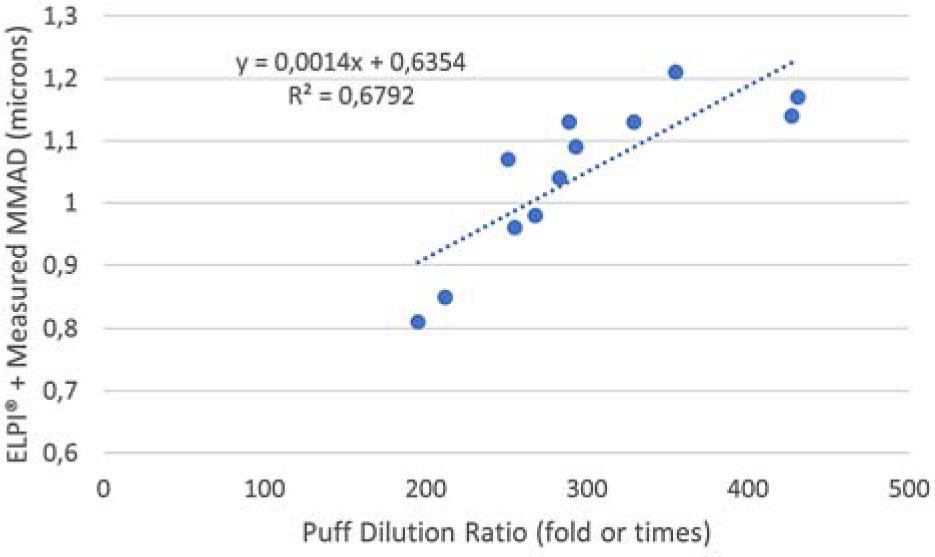
The difference in residence time of 0.06 s for the Mini MOUDI™ impactor vs. 8 s of exhaust from the puffing machine into the “Y” for the ELPI®+ allowed significantly more time for coagulation due to Brownian motion and probably contributed to consistently larger GSD values from the ELPI®+. The small difference in JUUL ENDS product age is unlikely to explain the difference in number or quantity of volatile substances measured by the ELPI®+ since JUUL ENDS products were tested with the ELPI®+ after the MSP-135-8 Mini Moudi™ impactor and considering the similarity in particle size distribution over 12 months for similar ENDS products (Supplemental Tables 1–6). One difference was the total amount of laboratory air sampled by each impactor. The total Mini MOUDI™ impactor sampling time of 123–125 s resulted in a total of 275 cm3 of laboratory room air (55 cm3/puff × 5 puffs) being pulled through Mini MOUDI™ compared to 3,500–4,523 cm3 of laboratory room air (Laboratory Air Entering Dilution system per second × 22 s/puff × 2 puffs/min × 49.5 min/sampling time + 3.34 cm3/s × 8 s/exhaled puff × 100 puffs) sampled by the ELPI®+ over its 49.5 min sampling time. The substantially greater sampling of laboratory room air by ELPI®+ (> 13 times) is consistent with the difference in the number of volatile compounds detected using the ELPI®+ setup, but not their smaller measured mass. If there were trace levels of volatile compounds in the ultra-zero dilution air (> 122 times), its greater use by the ELPI®+ would also explain the difference in the number of volatile compounds detected, but again not their smaller measured mass. The most likely explanation for the difference in measured volatile compound mass between the two impactors and their setups is that the vacuum oil in the sintered collection plates of the ELPI®+ and/or the pleated HEPA filter collects and retains most of the volatile compounds compared to the uncoated aluminum foils and glass fiber filter used in the Mini MOUDI™ impactor. The collection of vapor phase constituents by the vacuum oil in the sintered collection plates of the ELPI®+ would also explain the larger GSD values provided by the ELPI®+ impactor (See Supplemental Tables 9 and 10). Additionally, some of the unidentified volatile hydrocarbon compounds from sampling with the ELPI®+ (Table 5, Footnote f) may have been volatile components of the vacuum oil used on the ELPI®+ sintered collection plates. The wide recovery efficiency range of the ELPI®+ is primarily due to the variability in estimating the amount of the puff sampled, which is difficult when puffs are diluted between approximately 150–400 to 1. Contrary to what was expected with the ELPI®+ puff dilution ratio and measured MMAD, the ELPI®+ measured MMAD tended to increase with increasing puff dilution ratio suggesting that hygroscopic growth, due to humectants (glycerin and propylene glycol) may have a larger effect than evaporation for the JUUL Products used in this study (Figure 2). This would likely apply to all ENDS product formulations that use propylene glycol and glycerin. To refine the puff sampled amount and reduce the range of calculated recovery efficiency, more work with the existing ELPI®+ dilution system is required. Some of the variability in puff dilution is likely due to the two calibrated mass flow controllers (accurate to ± 1%) that were used to set the ELPI®+ and ultra-zero air dilution resulting in the range of laboratory air entering the dilution system (0.023–0.051 L/min). The wide calculated ELPI®+ collection efficiency could also partially be due to the aerosol density value (1.15 g/cm3) used in the ELPI®+ software, which was based upon the density of the two most abundant primary ingredients, glycerin and propylene glycol. Hygroscopicity of the deposited humectants within the ELPI®+ from the JUUL ENDS products does not explain the range of recovery efficiency since only approximately 60 μg of water vapor was available in 4,523 cm3 of 65% relative humidity air at 21° C (30) and there was reduced humidity in the lower stages (cutoff diameters of 0.17 μm and below) of the ELPI®+ (31). It is also clear that particulate matter in the 3,500–4,523 cm3 of laboratory air (in the μg/m3 range) sampled by the ELPI®+ does not explain the wide calculated recovery efficiency range.
Since some laboratory air was sampled either by puffing or as dilution air in the two impactor setups and these studies were performed in an active environmental chemistry laboratory (Enthalpy Analytical Inc.), it was not surprising to measure some of their commonly used chemicals (e.g., acetone, acetonitrile, carbon disulfide, methylene chloride, hexane, naphthalene, toluene, etc.), especially in the air blank samples, but also in the test samples. This highlights a limitation of this study in that both impactor setups sampled different amounts of normal laboratory room air, instead of exclusively ultra-zero air. This likely led to substantial differences in the number and amounts of measured volatile compounds between the two impactors used in this study. Significant changes to both impactor setups, that may not be feasible within a commercial laboratory situation, would be required to completely eliminate sampling of laboratory room air. Another limitation of this study was use of a standardized analytical assay designed for environmental sampling instead of analytical assays specifically designed for each ENDS product tested. Although some of the volatile chemicals identified in this study have also been identified in the e-liquid for these two JUUL Products (e.g., propylene glycol, nicotine, menthol, menthone, benzyl alcohol, menthyl acetate, eucalyptol, limonene, linalool, etc.) (32), it would have been ideal to develop specific analytical assays for the aerosol from each ENDS product tested. In a commercial laboratory situation, it is not always feasible or cost-effective to develop validated analytical assays for the aerosol from each ENDS product tested or all possible volatile chemicals and have these validated assays on the commercial laboratory's scope of accreditation (29). This is why a standardized analytical assay designed for analysis of environmental air samples was used in this study. Some of the volatile chemicals identified in this study (menthol, menthone, linalool, menthyl acetate, acetic acid, acetaldehyde, etc.) have also been reported in the aerosol from JUUL Menthol (5.0% and 3.0% nicotine) using targeted chemical analysis (33) and more extensive non-targeted analysis (GC/MS and LC-HRMS) (34).
The MMAD values obtained from both impactors used in this study are consistent with the impactor determined MMADs reported for 20 ENDS products (0.9–1.2 μm) while the GSD values from this study are slightly lower than the GSD range (1.7–2.2) reported (3). B
In conclusion, similar MMADs were obtained for the two different JUUL ENDs products tested using two different impactors (Mini MOUDI™ and ELPI®+) that required different setups resulting in ENDS product aerosol dilutions ranging from 1:0.82 to 400:1 dilution and a range of post aerosol generation residence times (0.06 to 20 s). Differences in GSD were likely due to the collection of volatile compounds by the vacuum oil used on the ELPI®+ sintered collection plates and its pleated HEPA filter. Additional work is required to narrow the calculated percent of puff sampled and calculated recovery efficiency range of the ELPI®+ setup that consistently exceeded the aerosol mass generated by the two ENDS products.