Have a personal or library account? Click to login
Illustrating the “power” of networks with candy exchange Cover

Illustrating the “power” of networks with candy exchange

Open Access
|Sep 2026

Figures & Tables

Table 1

Network position cards for 10 participants.

I am in position AMy partners are B, C, and DI am in position FMy partner is B
I am in position BMy partners are A, E, and FI am in position GMy partner is C
I am in position CMy partners are A, G, and HI am in position HMy partner is C
I am in position DMy partners are A, I, and JI am in position IMy partner is D
I am in position EMy partner is BI am in position JMy partner is D

Source: Authors’ contribution.

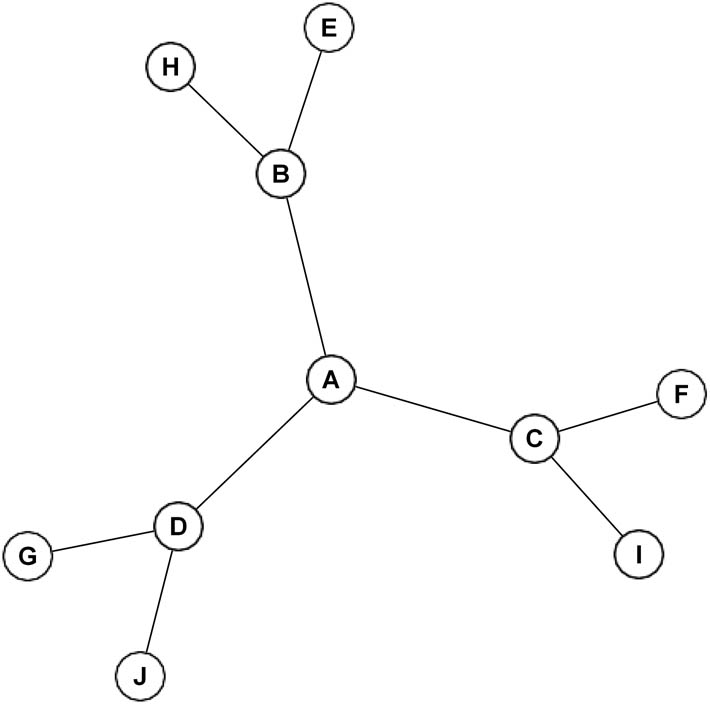
Figure 1

Exchange network for 10 participants.

Source: Authors’ contribution.
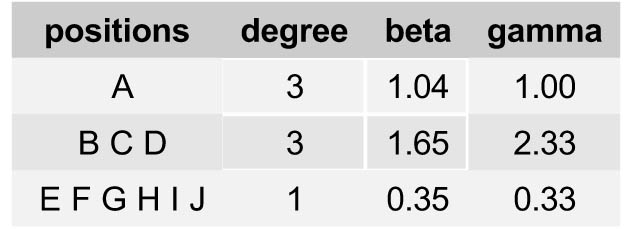
Figure 2

Centrality metrics for 10 node positions.

Source: Authors’ contribution.

DOI: https://doi.org/10.2478/connections-2026-0004 | Journal eISSN: 2816-4245 (formerly 0226-1766) | Journal ISSN: 0226-1766
Language: English
Page range: 9 - 15
Submitted on: Jan 27, 2026
Accepted on: Jul 16, 2026
Published on: Sep 9, 2026
Published by: International Network for Social Network Analysis (INSNA)
In partnership with: Paradigm Publishing Services
Publication frequency: 1 issue per year

© 2026 Zachary P. Neal, Mariah Kornbluh, Andrew MacIntosh, published by International Network for Social Network Analysis (INSNA)
This work is licensed under the Creative Commons Attribution 4.0 License.