
1. Introduction
This paper describes an activity designed to illustrate the importance of networks and network structure as participants exchange candy with one another. In the activity, each participant is assigned a position in an unobserved network, and in a series of rounds, exchanges candy with their network partners. Following the activity, which includes multiple variants involving new players, positions, and resource distributions, discussion focuses on how the network shapes how much candy each participant has at the end. This discussion provides an opportunity to explore three lessons of increasing complexity: local knowledge, structural inequality, and measuring power.
2. Goals
This activity is designed to illustrate three aspects of networks: local knowledge, structural inequality, and measuring power. It is suitable for use with participants of middle school age or older and does not require that participants have any prior experience with network analysis. When used in college classrooms, it is suitable for use in general education courses as a general introduction to the power of networks, as well as in specialized social science or natural science courses covering networks in greater detail.
First, the activity is designed to illustrate the fact that although we are all embedded in a social network, we cannot see the whole network. We only have “local knowledge” of who our friends are, and maybe who their friends are. However, we do not know what the whole network looks like, or where we are located in it. Milgram (1967) first demonstrated in his “small world experiment” that we are all connected indirectly to one another through a small number of intermediaries, but we do not necessarily know which chain of acquaintances connects us. This means that it can be difficult to use our social networks to efficiently find a person (or piece of information, or resource) that we are looking for (Kleinberg, 2000). Moreover, even when we think we know what the network looks like, our perceptions of other people’s social relationships are often inaccurate (Bernard et al., 1984; Neal et al., 2016). The limitations of local knowledge are readily apparent after completing the activity, so this lesson is appropriate for participants of any age and experience level.
Second, the activity is designed to illustrate the role of power and the consequences of structural inequality. Dahl (1957) suggested that “A has power over B to the extent that he can get B to do something that B would not otherwise do” (pp. 202–203), which implies that “having power” is a characteristic of a relationship, and not a characteristic of an individual. Emerson (1962) later clarified that “power resides implicitly in the other’s dependence” (p. 32), which highlighted the specific feature of the relationship between two people that gives one of them power. Finally, using the framework of social exchange theory, Cook et al. (1983) experimentally demonstrated this by showing that when A has an exchange relationship with B, who has no other exchange partners and thus is dependent on A, A will wind up with more resources than B. That is, a person’s position in a network structure can be a source of power (or powerlessness) and can result in unequal distributions of resources or structural inequality. Importantly, this power and inequality occur because of the network’s structure and the individuals’ positions in it, and not because of the individuals’ own characteristics (e.g., their wealth, skill, education, etc.). The inequality of candy at the end of a round of exchanges is readily apparent, so lessons about the existence of structural inequality are appropriate for participants of any age and experience level. However, lessons about the specific reasons for or implications of structural inequality may be more appropriate for older participants.
Third, the activity is designed to illustrate how a network position’s “power” in exchanges can be measured, and the importance of choosing the correct metric. Measuring the importance of a given network position often involves computing its centrality, and many different conceptions of centrality exist, including degree, closeness, and betweenness (Freeman, 1978). These metrics are useful for identifying highly connected positions. However, being highly connected does not necessarily give a network position power in exchanges. Instead, following the theory of power dependence (Emerson, 1962), a network position has power when it is connected to poorly connected others who are dependent and thus can be exploited. Multiple metrics exist for assessing this property (Bonacich, 1987; Neal, 2011, 2024), and when computed on the network used in the activity, they accurately predict the final distribution of resources among network positions. Because these lessons involve formal computations and comparing different approaches to measurement, they are most appropriate for more advanced participants with some prior experience in network analysis.
3. Setup
At the beginning of the activity, each participant receives five pieces of candy and one network position card. Small wrapped candy (e.g., hard candies, fun-size bars) works best because multiple participants will be handling and exchanging the candy during the activity. Table 1 provides the network position cards for a 10-participant version of the activity, while cards for between 7 and 17 participants are available at https://osf.io/rtv8m. After receiving their candy and card, each participant introduces themselves and their position (e.g., “Hi, I’m Zachary, and I’m in position B”). Importantly, at the beginning of the activity, participants do not know the structure of the whole network. Instead, mirroring our limited knowledge of real networks, each participant only knows their own position and partners.
Table 1
Network position cards for 10 participants.
| I am in position AMy partners are B, C, and D | I am in position FMy partner is B |
| I am in position BMy partners are A, E, and F | I am in position GMy partner is C |
| I am in position CMy partners are A, G, and H | I am in position HMy partner is C |
| I am in position DMy partners are A, I, and J | I am in position IMy partner is D |
| I am in position EMy partner is B | I am in position JMy partner is D |
Source: Authors’ contribution.
4. Procedure
During the activity, participants exchange candy in a series of rounds. In each round, each participant who has candy gives one piece of candy to one of their partners. Participants
(1) must give away one piece of candy if they have any left,
(2) can only give candy to their partners, and
(3) can only give away one piece of candy in a single round. However, within these simple rules, participants can bargain, negotiate, promise, and strategize.
The activity begins with an explanation of the rules of exchange, which should be written on a chalk/whiteboard or projected on a slide as a reminder. The three rules noted above are essential for the activity. Participants often enjoy the apparent competition for candy, so the activity can be more engaging if participants are also reminded that they can bargain and negotiate. For example, participants will sometimes agree to only exchange candy with each other, or promise a future exchange of candy in return for an exchange in the present round. This can also heighten the impact of the realization, at the end of the activity, that strategy and skill do not impact exchange outcomes.
Next, the facilitator begins the first round and asks the participants to exchange one piece of candy with one of their partners. After all participants have completed an exchange, the facilitator begins the second round and asks the participants to exchange one piece of candy with one of their partners. This process repeats, each time pausing until the prior round’s activity has subsided, for the desired number of rounds. When there are 10 participants, 5–8 rounds are usually sufficient for a stable pattern to emerge. Activities with fewer participants will require more rounds. In contrast, activities with more participants will require fewer rounds, but each round will take longer to complete.
At the end of the last exchange round, the facilitator asks each participant how many pieces of candy they have and records their position and candy count on the board or in a slide. Participants will notice that some positions have substantially more candy than others, and some positions may have no candy at all. Depending on the amount of time and the number of potential participants available, the activity can be repeated using one or more of the following variants.
4.1. Variant: Shuffle positions
The facilitator can draw participants’ attention to the inequality in the resulting candy distribution and suggest that the outcome may have depended on whether participants’ exchange partners were their friends. The facilitator then proposes giving everyone a new position and new partners in the network and redistributes the position cards among the participants. The candy is also redistributed so that each participant again has five pieces. Next, the facilitator repeats the activity, following the same rules as above. At the end of the last round, the facilitator again records each participant’s position and candy count. Despite each participant having new exchange partners, the final distribution of candy across network positions will mirror the original activity.
4.2. Variant: New players
The facilitator can draw participants’ attention to the continuing inequality and suggest that some participants might just be better at playing the game, or more strategic about how they make their exchanges. The facilitator then collects all the candy and cards and distributes them to a new group of participants. Next, the facilitator repeats the activity, following the same rules as above. At the end of the last round, the facilitator again records each participant’s position and candy count. Despite new participants exchanging candy, the final distribution of candy across network positions will mirror the original activity.
4.3. Variant: Head start
The facilitator can draw participants’ attention to the inequality in the resulting candy distribution and propose that some positions should be given a “head start” with extra candy at the beginning of the activity. The facilitator asks the participants to redistribute the candy so that each has five pieces, then gives an additional three pieces of candy to the participants in positions that had the least candy at the end of the prior activity. Next, the facilitator repeats the activity, following the same rules as above, but allowing for a few extra rounds to account for the additional candy now circulating among participants (e.g., 8–10 rounds in a 10-participant activity). At the end of the last round, the facilitator again records each participant’s position and candy count. Despite the head start given to some positions, the final distribution of candy across network positions will mirror the original activity.
5. Lessons
The primary activity and its variants can be used to illustrate three lessons of increasing complexity: local knowledge, structural inequality, and measuring power.
5.1. Local knowledge
At the end of the activity, the facilitator can ask participants what they think the whole network looks like. Participants will often speculate that positions ending up with more candy have more connections. However, except when the activity is used with a small number of participants and a small network, they typically will be unable to describe the precise structure of the network. This mirrors an earlier activity by Leavitt (1951), where participants could accurately guess the structure of some networks (a star) but not others (a cycle).
The facilitator can then show the structure of the network. Figure 1 shows the network defined by the position cards in Table 1, while the networks containing between 7 and 17 participants are available at https://osf.io/rtv8m. The network’s true structure is often consistent with some of the participants’ intuitions, but is still surprising to many. This presents an opportunity to discuss the fact that, although we are all embedded in a larger network that affects our lives, we do not know what that network looks like or where we are located within it. Instead, we only have “local knowledge” of the people we know, and sometimes who they know. This means that it is easy to overestimate how advantaged we might be, or underestimate how disadvantaged we might be, based on how well-connected we think we are. It also means that it is difficult to use our networks strategically, because we do not know much about where we are in the larger network.
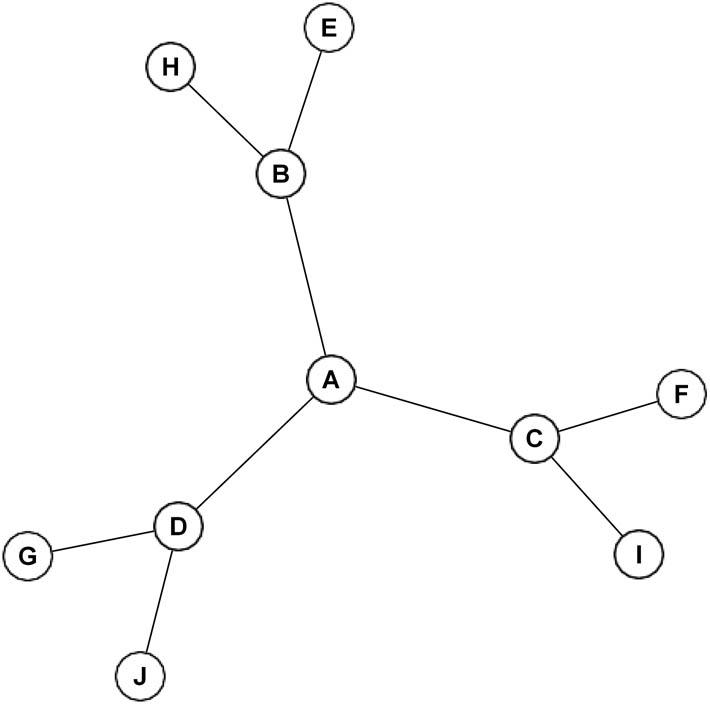
Figure 1
Exchange network for 10 participants.
Source: Authors’ contribution.
5.2. Structural inequality
At the end of the activity, the facilitator can review the resulting distributions of candy. For the main activity and each of the variants, the same positions will usually be at the top (have lots of candy) or bottom (have no candy) of the distribution. This presents an opportunity to discuss the fact that a person’s position in a network can be a source of inequality called “structural inequality.” Unlike inequality that comes from starting with fewer resources (distributional inequality) or having a particular characteristic (demographic inequality), structural inequality comes from occupying an advantageous or disadvantageous position. This lesson can be easier to illustrate when multiple activity variants are used because they highlight that the inequality comes from the network positions themselves and persists even when different people are involved or certain positions start with extra resources. However, it is important to note that in real-world settings, structural inequality is often highly correlated with demographic or distributional sources of inequality.
Because the inequality in resource distributions that emerges from the activity is solely the result of participants’ positions within the network, discussion can explore how individuals’ access to or possession of resources may often not depend on individual merit or effort. This can help participants understand how real-world disparities often emerge from systemic patterns rather than personal shortcomings. It can also help participants critically think about appropriate responses to structural inequality, which may include empathy for those occupying structurally marginal positions or a shift in focus from equality to equity. For example, all participants start the activity with an equal number of resources, but this is insufficient to guarantee equity of opportunity. Additionally, in Figure 1, positions A–D have an equal number of exchange partners, but this does not guarantee equitable exchanges among them. That is, resolving inequities requires looking beyond the equality of resources or equality of connections and involves considering the equity of the opportunities afforded by the larger structure.
This lesson can also be linked to the lesson of local knowledge by highlighting that, because we do not know what the whole network looks like or where we are in it, it is difficult to know whether we are benefiting from or harmed by structural inequality. Discussion can explore how the origins of structural inequality are hard to see, and thus low-resource individuals’ outcomes may be incorrectly attributed to personal weaknesses, while high-resource individuals’ outcomes may be incorrectly attributed to personal strengths. By examining the structure of the whole network, discussion can also explore how the network would need to change to reduce the amount of structural inequality and yield more equitable outcomes if the exchange activity were repeated. For example, would adding more connections improve equity or exacerbate inequality? Where would new connections do the most harm or good?.
5.3. Measuring power
Given a network, researchers are often interested in computing a node’s potential advantage or disadvantage given its position in the overall structure, often using a centrality metric. However, some centrality metrics are more useful than others for understanding advantage and disadvantage in exchange. Figure 2 shows three centrality metrics for each position in the 10-participant network shown in Figure 1; tables of values for between 7 and 17 participants are available at https://osf.io/rtv8m. This offers an opportunity to discuss the computation of centrality metrics and their usefulness for predicting outcomes.
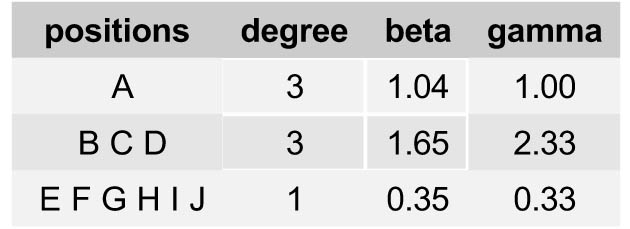
Figure 2
Centrality metrics for 10 node positions.
Source: Authors’ contribution.
Participants at all ages and levels of expertise should be able to compute degree and understand the values shown in Figure 2. Although degree is easy to compute and understand, it is not helpful for predicting exchange outcomes. Typically, positions B, C, and D will have more candy than A at the end of each exchange activities, but these four positions are tied with the highest degree. After asking participants what a simple measure like degree is missing, the facilitator can note that although degree considers how many exchange partners each position has, it does not consider how many exchange partners those partners have.
Beta centrality was developed to overcome this limitation of degree (Bonacich, 1987). It involves an adjustable parameter β that, when it takes a negative value, gives higher values to positions that are connected to poorly connected others. The beta centrality values shown in Figure 2 are computed using β = –0.402 (i.e., 90% of the network’s largest eigenvalue). Except for participants with advanced math backgrounds, most participants will not understand beta centrality’s computation; this is ok and goes beyond the scope of this activity. The beta centrality values do a good job predicting the outcomes of the exchange activity. Although the actual computation of beta centrality is complicated, the organizer can remind participants that because β is negative, beta centrality gives higher values to positions that are connected to poorly connected others, and can ask participants why this is important. This presents an opportunity to discuss the role of dominance in exchange outcomes. Position B, for example, is advantaged in exchange because it can dominate positions E and H, who have no alternatives (Cook et al., 1983; Emerson, 1962).
Gamma centrality (Neal, 2011, 2024) was developed to offer a simpler alternative to beta centrality. It also has an adjustable parameter γ that, when it takes a negative value, gives higher values to positions that are connected to poorly connected others. The gamma centrality values shown in Figure 2 are computed using γ = −1, which means that each position’s gamma centrality score is simply the sum of 1 divided by each of its partners’ degree. For example, position B’s gamma centrality is (1 divided by A’s degree) + (1 divided by E’s degree) + (1 divided by H’s degree), or 2.33.
High school age and more advanced participants should be able to compute gamma centrality when γ = –1 and understand the values shown in Figure 2. The gamma centrality scores also do a good job of predicting the outcomes of the exchange.
A final discussion about measuring power can focus on what makes a good network metric. First, the metric should do a good job of capturing what it is intended to capture (i.e., it should be valid). For predicting outcomes in exchanges, the metric should identify positions that are connected to poorly connected others. Here, the discussion can focus on the importance of selecting the right metric for the job (beta centrality and gamma centrality are appropriate for predicting exchange outcomes). Second, it should be as simple as possible. Here, the discussion can focus on the importance of simplicity and parsimony in science (degree and gamma centrality are both simple). The facilitator then can invite participants to consider which of the available metrics – degree, beta, and gamma – is best for identifying network positions of power.
6. Reflections
We have used this activity in a wide range of settings, with differing age groups and learning objectives. Zachary has used this activity in numerous graduate and undergraduate courses on networks, with class sizes ranging from 10 to 50 students. In these settings, name cards are printed on paper slips, and instructions are projected on a powerpoint slide. Students are usually excited to participate, especially given the apparent element of competition. Because students rarely have any prior experience with networks or network analysis, the activity and discussion typically unfold similarly in lower-division, upper-division, and graduate courses. Students are rarely surprised by their own position in the network (central or peripheral), which they can usually guess based on the amount of candy they receive, but often are surprised by the network’s overall structure, and especially by the fact that they could not have accurately guessed the network’s structure. For many, seeing that the resulting distributions depend on the network, and not on any individual participant’s strategy or on the facilitator’s intervention, triggers an “ah-ha” moment when they realize why networks matter and why they are worth studying.
Mariah has used this activity with younger participants, including a youth advisory council of 15–18 year olds at a larger youth summit. The activity was conducted in the evening, during a pizza dinner, with instructions delivered multiple times throughout the activity and written on posters. At this age, participants are excited to exchange candy and are eager to encourage others to give them candy. After the exchanges, participants were shown the unlabeled network and asked to guess each participant’s position. They could accurately guess the peripheral positions, but incorrectly guessed that those with the most candy occupied the most central position (A), which created an opportunity to discuss the structural origins of power and advantage. During this discussion, the participants decided, without prompting, to redistribute the candy more equitably. Their “ah-ha” moment came when they connected the abstract game network to their real-world positionalities: many had limited access to resources such as housing or transportation, but also recognized their enhanced access as members of the council. This led the activity participants to ask all summit participants to map their links to resources, with the goal of understanding how the network would need to change to improve access and reduce inequality.
Andrew has used this activity with older participants, including at workshops with boards of directors and executive leadership at professional sports organizations. The facilitator reviewed the instructions and asked participants to discuss instructions with their neighbor so that any confusing instructions could be clarified in advance. The facilitator also asked additional workshop members not directly participating in the activity to act as observers and notetakers in the style of a “fishbowl activity.” Participants sometimes view the activity with trepidation because they know it is designed to teach a lesson, but it is not immediately clear what the lesson is. Given participants’ existing familiarity with one another, and their executive roles, exchanges are often accompanied by playful teasing about who shares with whom, and about those who wind up with nothing. The discussion first introduces the basic idea of a network, and in addition to examining positions of power and advantage, invites participants to reflect on their own organization’s network and who occupies such positions. Although participants are already quite familiar with the importance of “networking” inside organizations, participants often have “ah-ha” moments about the importance of networks outside the organization, and in particular, their organization’s position relative to their clients and the communities they aim to serve.
Some common challenges can arise when using this activity, and they tend to be the same regardless of the setting or participants. The expected distribution of resources may be less obvious in smaller networks or after only a few rounds of exchange. For example, the powerful positions may not have substantially more candy than the peripheral positions if the activity is used in a small group (e.g., a 7-person network) with limited time (e.g., only 3 or 4 rounds of exchange). The distribution may also be distorted if one or more participants accidentally (e.g., due to misunderstanding) or intentionally (e.g., due to a desire for equality) do not follow the rules. However, the activity is remarkably robust, with such deviations typically being relatively small. When deviations are large, this presents an opportunity to discuss what might have caused them (e.g., how did a peripheral position wind up with so much candy) and to explore further lessons about how power and inequality are malleable through changes in the network.
Funding information
This work was not supported by funding.
Author contributions
ZPN designed the activity, prepared the materials, and drafted the version version. MK and AM provided feedback, revised the manuscript, and contributed to the reflections section.
Conflict of interest statement
The authors have no competing interests to disclose.
Data availability statement
All materials necessary for this activity are available at https://osf.io/rtv8m.