Figure 1:
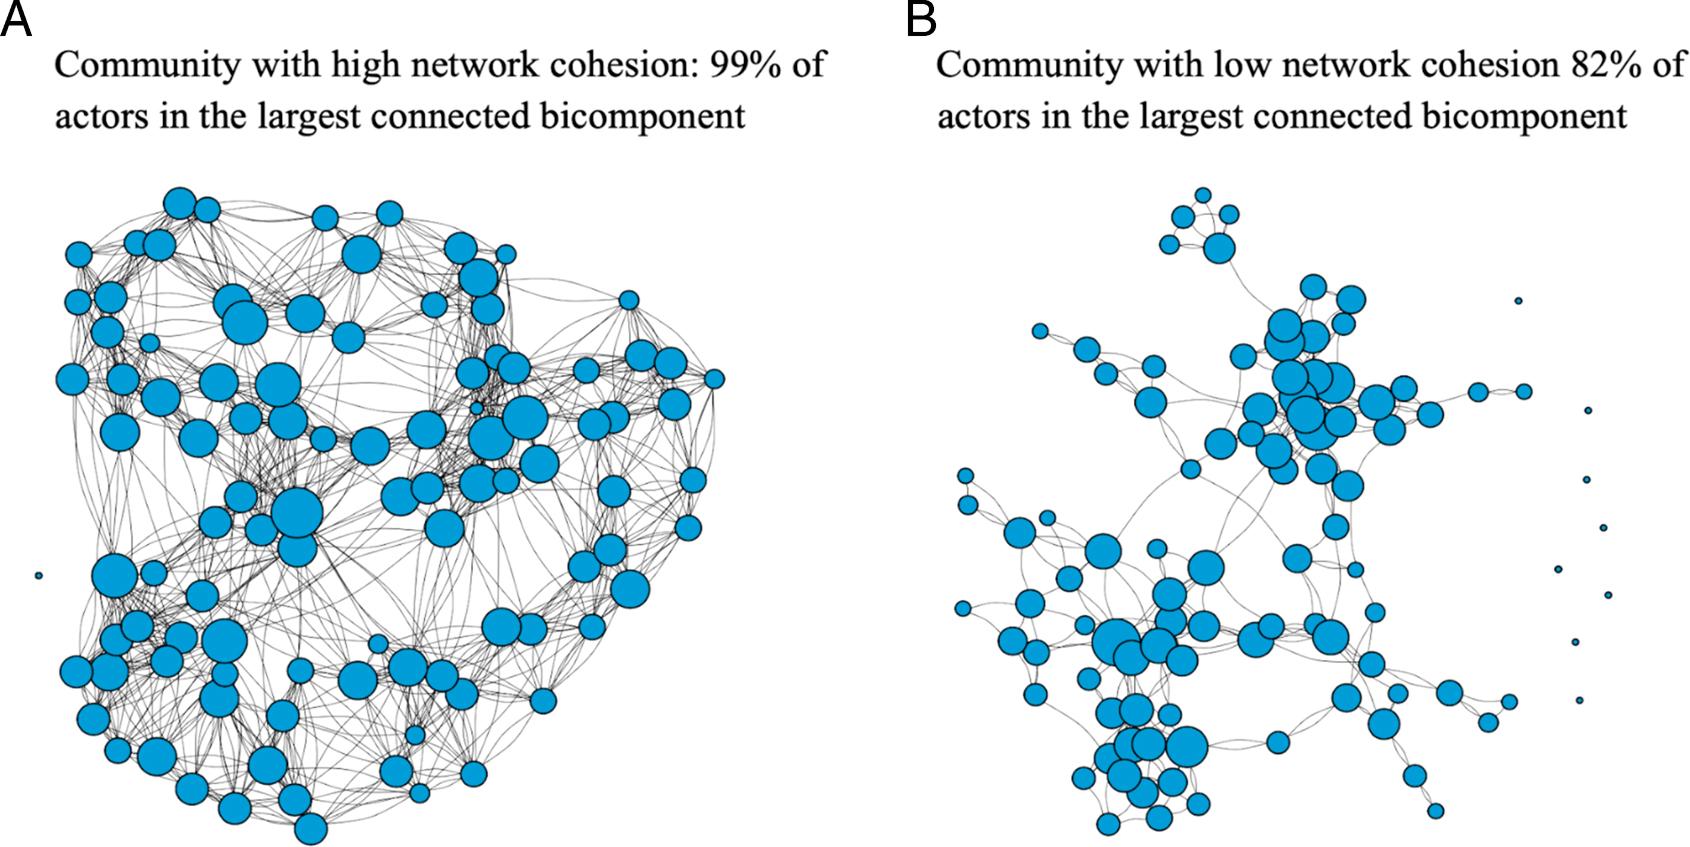
Figure 2:
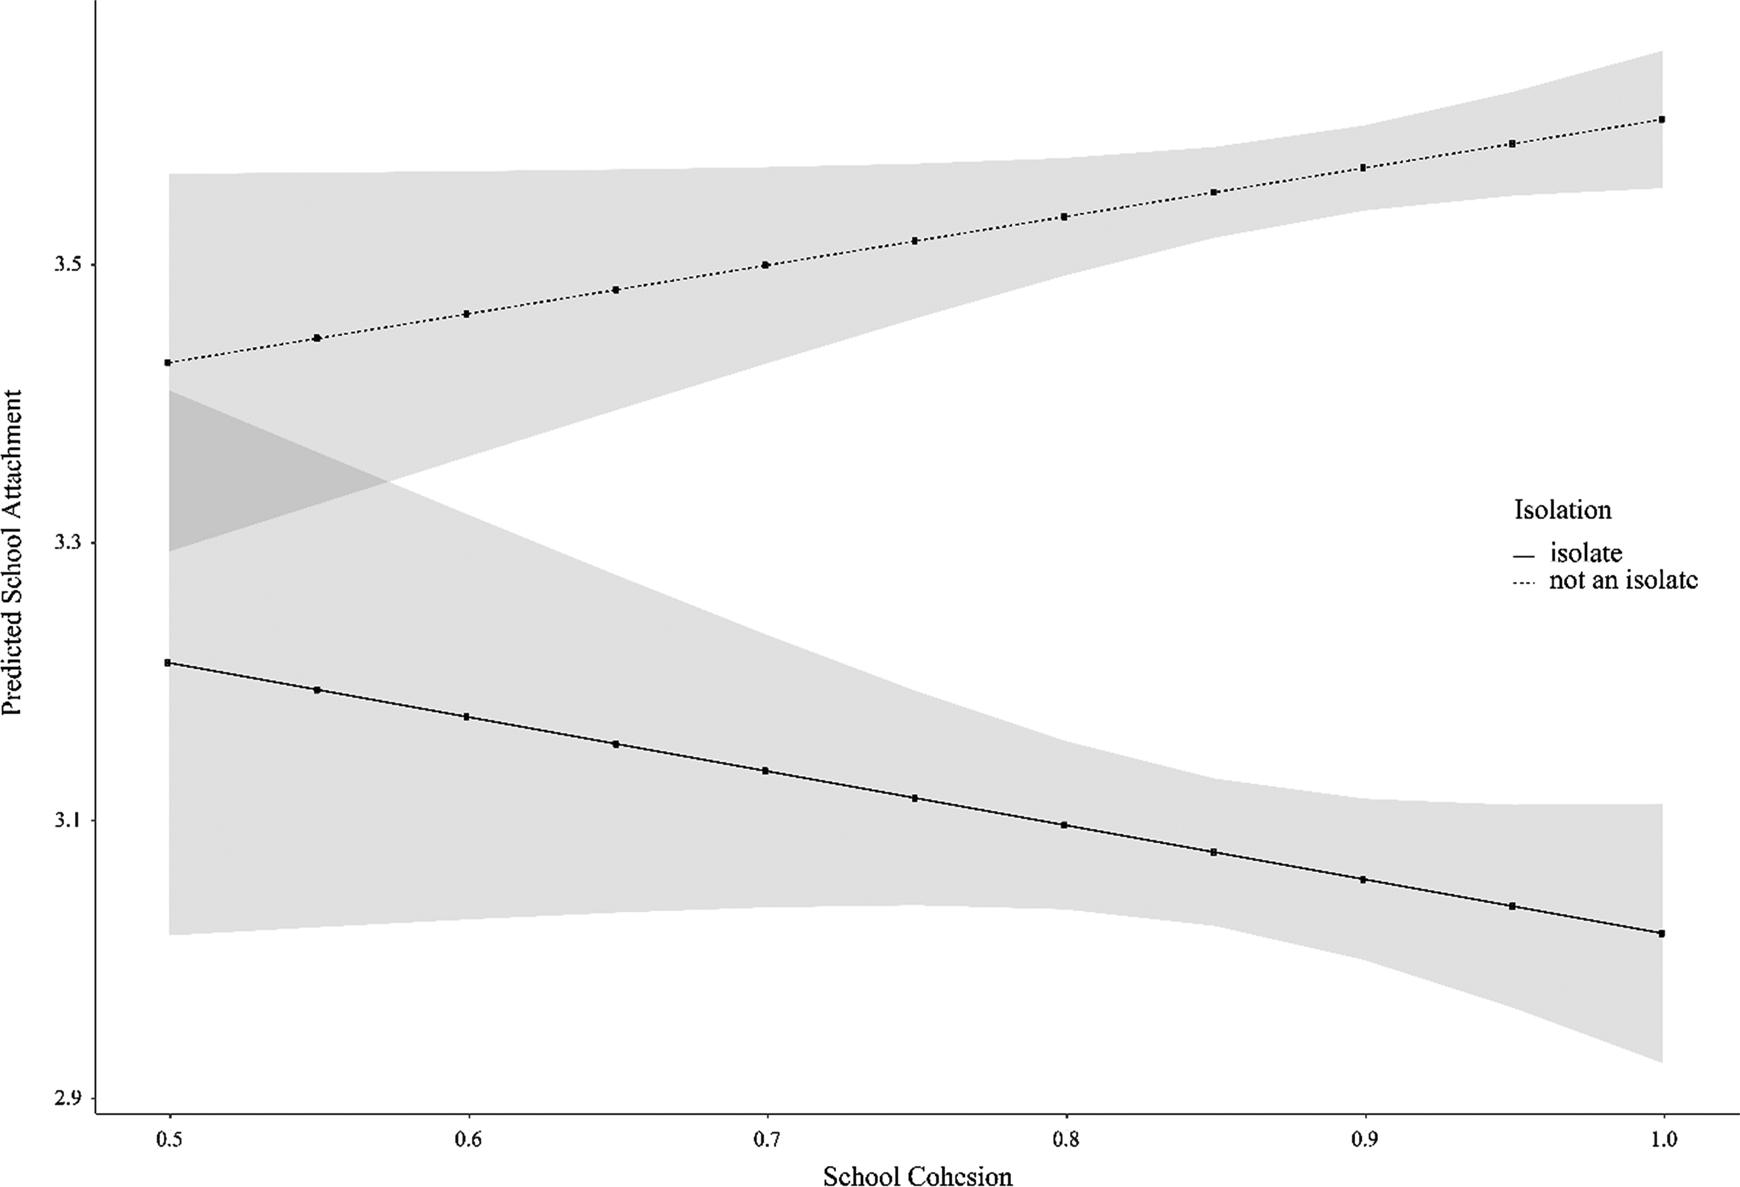
Figure 3:
Descriptive statistics_
| Mean/p | Std. Dev. | Range | |
|---|---|---|---|
| School attachment | 3.556 | 0.977 | 1–5 |
| Disengagement | 1.579 | 1.121 | 0–4 |
| Isolate | 0.037 | 0.001 | |
| School cohesion | 0.895 | 0.076 | 0.567–1 |
| Race/ethnicity | |||
| White | 0.564 | 0.002 | |
| Black | 0.147 | 0.001 | |
| Asian | 0.047 | 0.001 | |
| Hispanic | 0.146 | 0.001 | |
| Other | 0.095 | 0.001 | |
| Female | 0.513 | 0.002 | |
| Grade | 9.670 | 1.597 | 6–13 |
| Log School Size | 6.961 | 0.666 | 3.258–8.112 |
| School type | |||
| Public | 0.933 | 0.001 | |
| Catholic | 0.043 | 0.001 | |
| Private | 0.024 | 0.001 | |
| N | 61,411 | ||
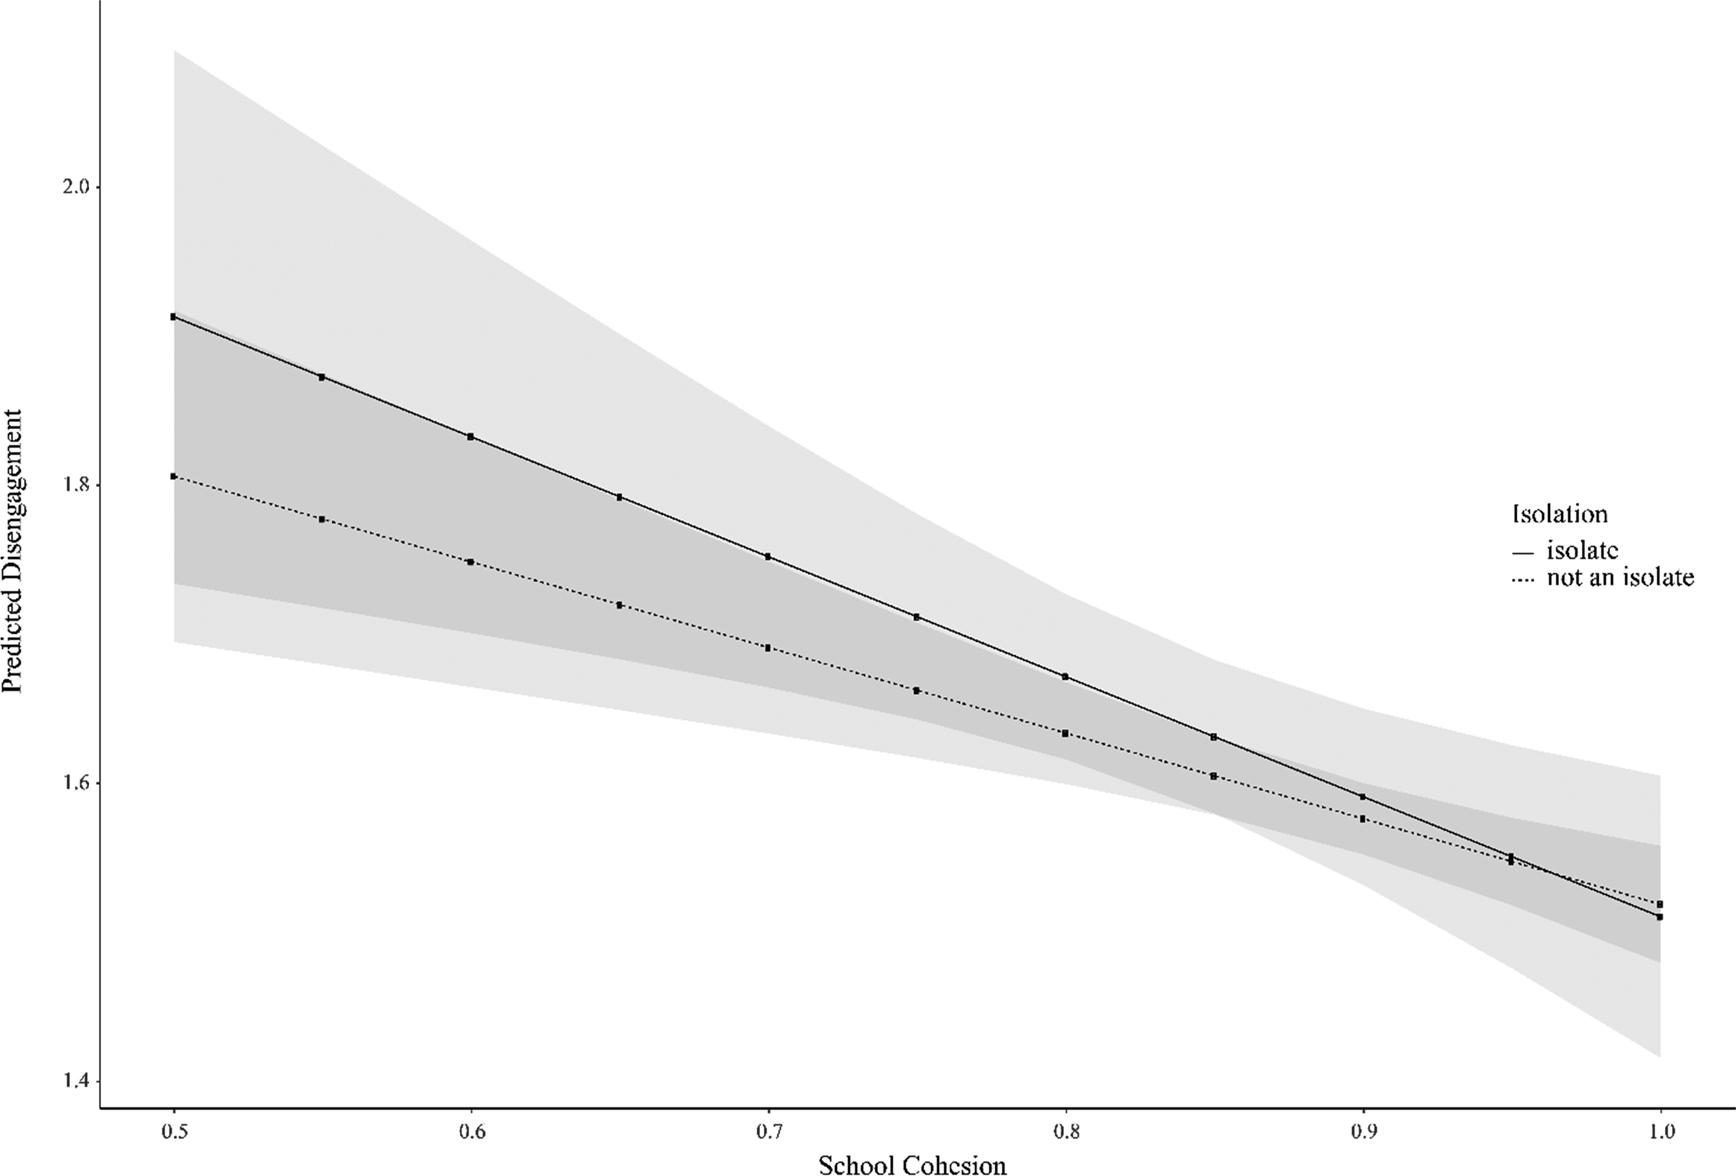
Multilevel regression models predicting school attachment and disengagement from school cohesion and individual isolation_
| Model 1a School Attachment; No interaction | Model 1b School Attachment; interaction | Model 2a Disengagement; no interaction | Model 2b Disengagement; interaction | |||||
|---|---|---|---|---|---|---|---|---|
| Coefficient | z-statistic | Coefficient | z-statistic | Coefficient | z-statistic | Coefficient | z-statistic | |
| Isolate | -0.478*** | (-19.55) | 0.154 | (0.80) | 0.029 | (1.12) | -0.231 | (-0.97) |
| School Cohesion | 0.327 | (1.87) | 0.350* | (2.00) | -0.602*** | (-6.91) | -0.575*** | (-4.02) |
| Isolate X School Cohesion | -0.740** | (-3.25) | -0.231 | (-0.97) | ||||
| Race/ethnicity | ||||||||
| Black | -0.194*** | (-14.12) | -0.194*** | (-14.10) | 0.180*** | (13.24) | 0.181*** | (11.53) |
| Asian | -0.060** | (-2.92) | -0.059** | (-2.90) | 0.148*** | (5.46) | 0.148*** | (6.27) |
| Hispanic | -0.120*** | (-8.91) | -0.119*** | (-8.87) | 0.203*** | (11.46) | 0.203*** | (13.08) |
| Other | -0.221*** | (-15.93) | -0.220*** | (-15.92) | 0.165*** | (11.31) | 0.166*** | (10.29) |
| Female | -0.078*** | (-10.01) | -0.078*** | (-10.03) | -0.169*** | (-17.70) | -0.169*** | (-18.65) |
| Grade | -0.082*** | (-24.16) | -0.082*** | (-24.14) | -0.034*** | (-9.01) | -0.0346*** | (-9.10) |
| School Size (log) | 0.006 | (0.32) | 0.006 | (0.34) | -0.033** | (-2.73) | -0.0323* | (-2.05) |
| School type | ||||||||
| Catholic | 0.061 | (0.92) | 0.0581 | (0.87) | -0.165*** | (-6.12) | -0.165** | (-3.07) |
| Private | 0.216** | (2.98) | 0.218** | (3.02) | -0.173*** | (-4.46) | -0.170** | (-2.79) |
| Intercept | 4.132*** | (18.54) | 4.107*** | (18.40) | 2.704*** | (21.18) | 2.672*** | (14.52) |
| Slope Variance | 0.009*** | 0.004*** | (-3.57) | 0.0001*** | (-32.99) | 0.00008 | (-1.23) | |
| Intercept Variance | 0.017*** | 0.018*** | (-25.43) | 0.010*** | (-35.10) | .010*** | (-23.60) | |
| Cov(Slope, Intercept) | 0.001 | -0.001 | (-0.20) | -0.001*** | (-39.08) | -0.001 | (-0.26) | |
| Residual Variance | 0.905*** | 0.905*** | (-17.55) | 1.226*** | (50.35) | 1.226*** | (35.69) | |
| N | 61411 | 61411 | 61411 | 61411 | ||||
| AIC | 168415.9 | 168408.3 | 186999.9 | 187001.0 | ||||
| BIC | 168560.3 | 168561.7 | 187144.3 | 187154.4 | ||||
Predicted values for different combinations of isolation and cohesion_
| Low cohesion | High cohesion | |||
|---|---|---|---|---|
| School attachment | Disengagement | School attachment | Disengagement | |
| Not an Isolate | 3.465 | 1.749 | 3.587 | 1.547 |
| Isolate | 3.175 | 1.832 | 3.038 | 1.551 |