

Table 1.
Comprehensive indicator framework
| Indicator | Description | Unit | Indicator type | Relevance to resilience |
|---|---|---|---|---|
| Total exports | Value of all goods and services exported | Million USD* | Stimulant | Reflects production capacity and international competitiveness |
| Total imports | Value of all goods and services imported | Million USD | Stimulant | Indicates consumption capacity and supply chain functionality |
| Customs brokers | Number of enterprises licensed for customs brokerage | Count | Stimulant | Measures trade infrastructure capacity |
| Storage warehouses | Number of enterprises operating temporary storage warehouses | Count | Stimulant | Indicates logistics infrastructure depth |
| Consumer price index | Regional price level changes | Index (%) | Destimulant | Reflects economic stability; high inflation indicates stress |
| Exports by enterprise size | Value of exports by firms categorised by employee count | Million USD | Stimulant | Shows export base diversification across firm sizes |
| Imports by enterprise size | Value of imports by firms categorised by employee count | Million USD | Stimulant | Indicates demand structure across business sectors |
| Capital investment | Total capital investment in the regional economy | Million UAH** | Stimulant | Measures future-oriented economic confidence |
| Population | Registered population of the region | Thousands | Stimulant | Controls for regional scale and market size |
| Relocated enterprises | Number of businesses officially relocated to the region from war zones | Count | Stimulant | Captures war-induced economic migration effects |
Table 2.
Summary statistics of taxonomic analysis across periods
| Statistical metric | 2015 (first year of war) | 2022 (full-scale war) | 2024 (phase of adaptation to war) | Interpretation |
|---|---|---|---|---|
| Average distance from reference vector () | 9.42 | 10.40 | 9.09 | Lower values indicate closer proximity to optimal performance |
| Standard deviation (S0) | 0.71 | 0.70 | 0.78 | Measures dispersion in regional performance |
| Maximum permissible deviation (C0) | 10.84 | 11.81 | 10.65 | Threshold for acceptable distance from reference vector |
| Average taxonomy coefficient (K̅) | 0.13 | 0.12 | 0.15 | Higher values indicate better overall regional performance |
| Maximum taxonomy coefficient | 0.27 | 0.24 | 0.35 | Best-performing region’s score in each period |
| Minimum taxonomy coefficient | 0.02 | 0.02 | 0.04 | Worst-performing region’s score in each period |
Table 3.
Ranks of Ukrainian regions according to the taxonomic analysis in dynamics
| Region | 2015 | 2022 | 2024 |
|---|---|---|---|
| Vinnytsia | 20 | 17 | 6 |
| Volyn | 5 | 10 | 9 |
| Dnipropetrovsk | 1 | 3 | 3 |
| Donetsk | 18 | 5 | 17 |
| Zhytomyr | 11 | 14 | 10 |
| Zakarpattia | 22 | 6 | 13 |
| Zaporizhzhia | 3 | 7 | 7 |
| Ivano-Frankivsk | 7 | 13 | 21 |
| Kyiv | 15 | 1 | 1 |
| Kirovohrad | 19 | 24 | 16 |
| Luhansk | 14 | 21 | 24 |
| Lviv | 4 | 4 | 4 |
| Mykolaiv | 16 | 12 | 15 |
| Odesa | 2 | 2 | 2 |
| Poltava | 8 | 11 | 5 |
| Rivne | 10 | 20 | 19 |
| Sumy | 12 | 18 | 14 |
| Ternopil | 17 | 23 | 20 |
| Kharkiv | 6 | 8 | 18 |
| Kherson | 13 | 9 | 22 |
| Khmelnytskyi | 24 | 19 | 12 |
| Cherkasy | 23 | 15 | 8 |
| Chernivtsi | 21 | 22 | 23 |
| Chernihiv | 9 | 16 | 11 |
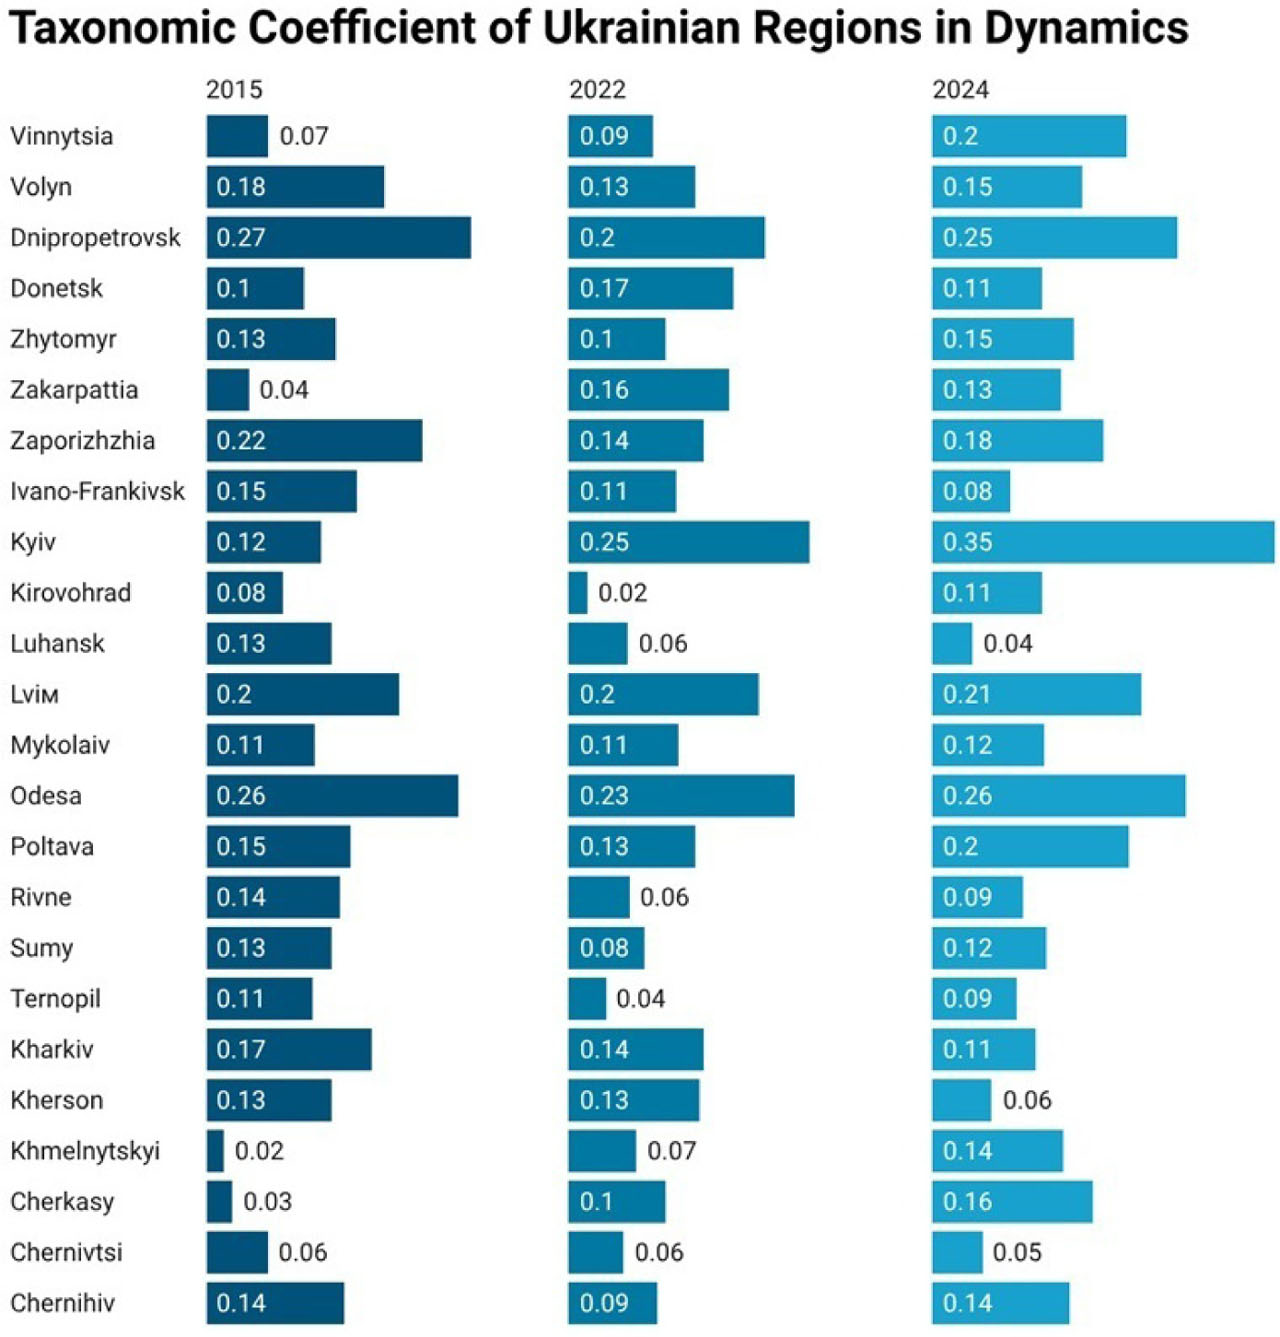
Figure 1.
Taxonomic coefficient of Ukrainian regions in dynamics
Source: Authors’ calculations
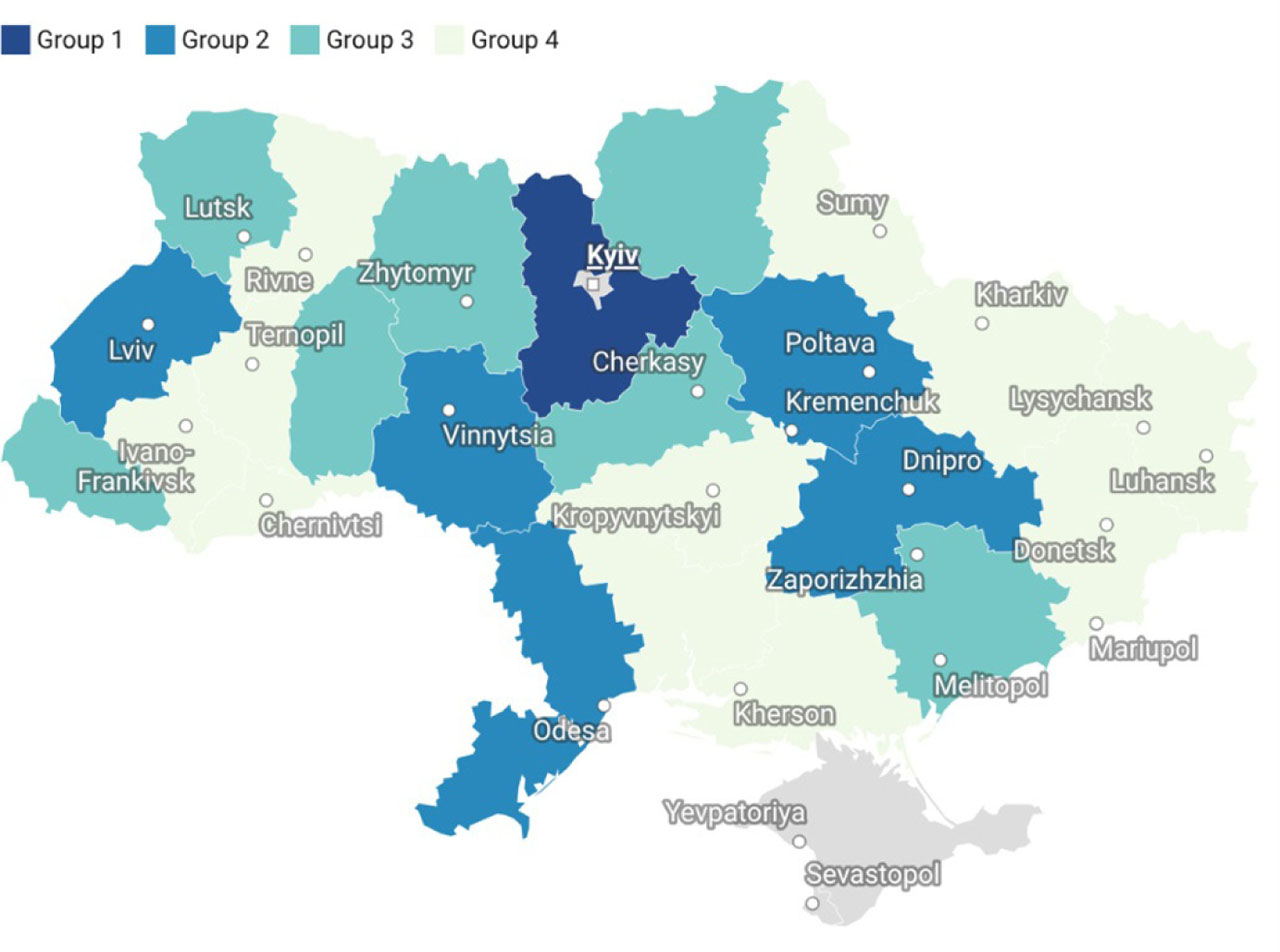
Figure 2.
Clustering Ukrainian regions by taxonomic coefficient (2024)
Source: Authors’ calculations
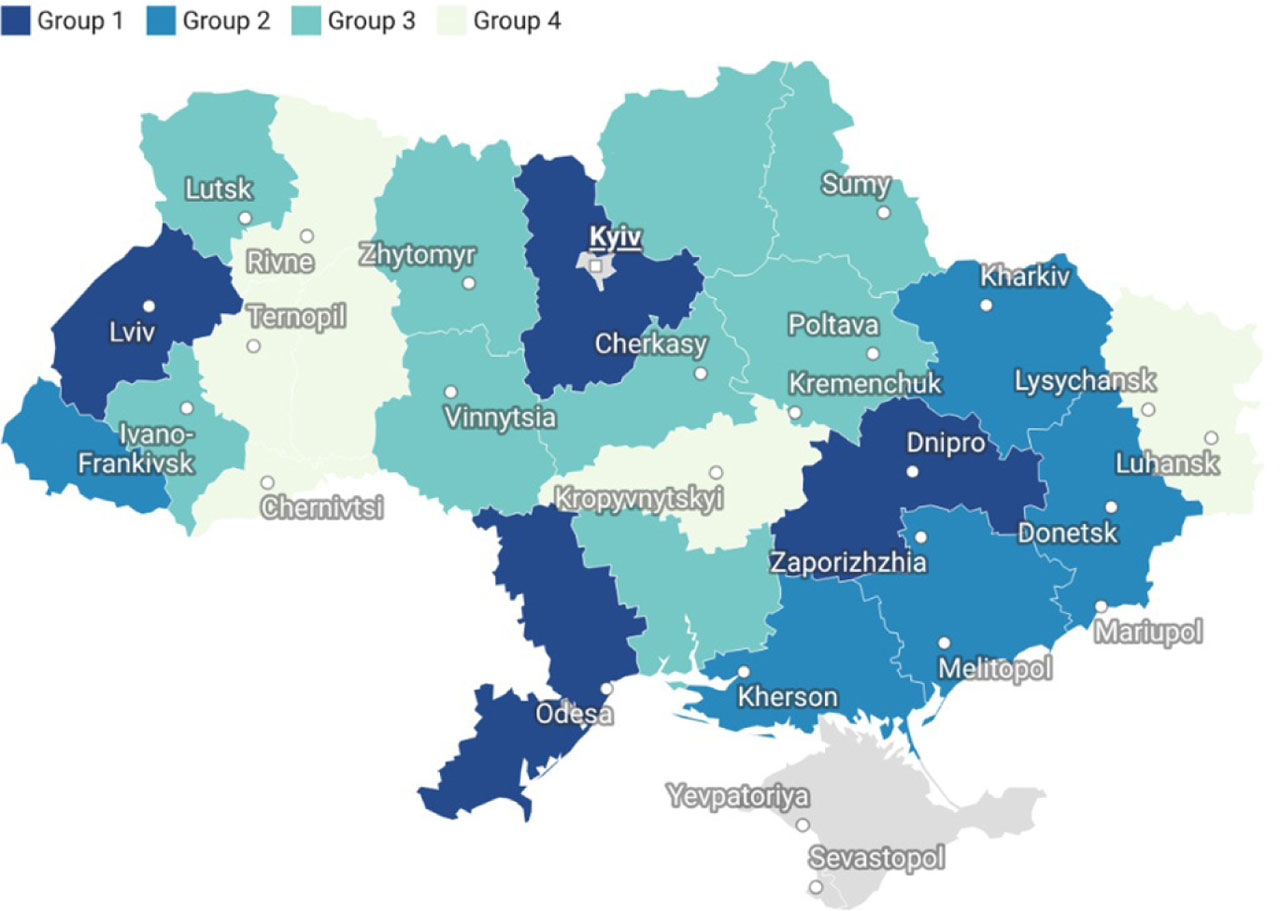
Figure 3.
Clustering Ukrainian regions by taxonomic coefficient (2022)
Source: Authors’ calculations
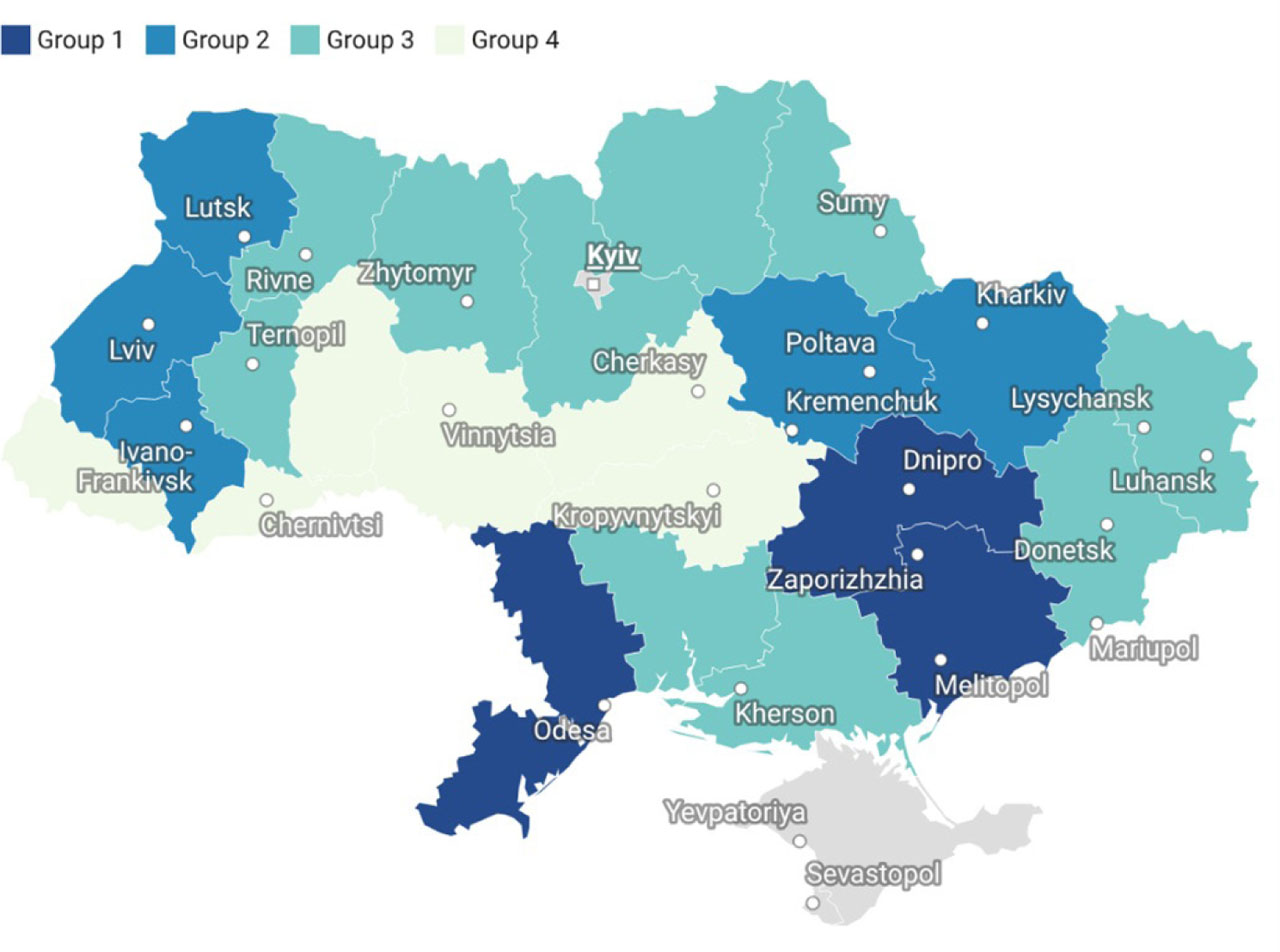
Figure 4.
Clustering Ukrainian regions by taxonomic coefficient (2015)
Source: Authors’ calculations
Table 4.
Critical contradictory cases – structure vs. geography
| Region | 2024 rank | Key pre-war structural characteristics |
|---|---|---|
| Strong frontline regions: | ||
| Zaporizhzhia | 7 | Nuclear power complex, heavy industry, Dnipro River port infrastructure |
| Dnipropetrovsk | 3 | Metallurgical industry, aerospace sector, river port, decades of industrial capacity |
| Kharkiv | 18 | Major industrial centre, education hub, transport junction |
| Weak safe regions: | ||
| Chernivtsi | 23 | Peripheral location, limited industrial base, small market |
| Ivano-Frankivsk | 21 | Peripheral location, small industrial base, agricultural focus |
| Ternopil | 20 | Peripheral location, agricultural economy, limited infrastructure |