

1. Introduction
Regional resilience under geopolitical shocks, uncertainty and shifts in the global economic landscape is increasingly becoming a subject of scholarly inquiry. Classical resilience literature extensively examines recovery from natural disasters (Wang, Xu & Wang, 2023) and financial crises (Martin, 2012; Bristow & Healy, 2014a, 2014b), or post-conflict reconstruction (MacKinnon et al., 2025). These frameworks emphasise resistance, recovery and adaptation to temporary shocks. However, active warfare introduces fundamentally different conditions: systematic infrastructure destruction, population displacement, ongoing security threats and prolonged uncertainty without clear resolution timelines. Russia’s full-scale war in Ukraine in 2022, following the initial war start in 2014, provides a unique empirical context for examining how regional economies adapt, survive and potentially thrive under extreme geopolitical pressure. A critical unanswered question emerges: What determines regional economic vulnerability during active warfare: geographical proximity to fighting or preexisting economic structures?
Regional economic resilience, understood as the ability of regional economies to adapt to and recover from major shocks, was conceptualised in Dawley, Pike and Tomaney (2010). Geopolitical uncertainty introduces new complex challenges to the classical notion of resilience, extending its scope beyond the economic dimension to include institutional (Schiappacasse & Müller, 2015; Zomchak & Lapinkova, 2023; Nijkamp et al., 2024; Libanova & Kotygorenko, 2025) and spatial dimensions (Pascariu, Kourtit, & Tiganasu, 2020; MacKinnon et al., 2025). The motivation for this study stems from a significant research gap in understanding the mechanisms of regional survival during active warfare.
The Ukrainian case serves as a basis for evaluating the applicability of conventional resilience frameworks, originally designed for natural disasters or economic disruptions, within the context of active warfare. The central objective of this study is to determine whether regional economic resilience under active warfare is driven by geography or structural factors. It explores whether internal institutional and economic capacity allows for the maintenance of external trade stability, even when confronted with proximity to the frontline.
This study addresses these gaps by applying a taxonomic analysis, which enables the assessment of multidimensional economic processes. The analysis is conducted for three key periods: 2015 (the first year after the outbreak of war), 2022 (the first year of the full-scale war) and 2024 (the phase of early adaptation).
The main research objective is to identify the mechanisms shaping and sustaining regional economic stability under conditions of extreme geopolitical uncertainty, using a taxonomic approach to capture both resilience and vulnerability factors of regional external economic systems during different stages of war.
The central hypothesis is that Ukrainian regional economies demonstrate differentiated capacities to maintain the stability of external economic activity under wartime conditions, which can be quantitatively assessed through taxonomic analysis. Additionally, the study examines the role of geographical proximity to the frontline in shaping regional vulnerability, the extent to which war alters traditional regional hierarchies by creating new centres of economic activity and the comparative dynamics of external economic performance between the onset of war in 2014 and the present.
This research makes three primary contributions. First, it extends resilience theory into the understudied context of active large-scale war, distinguishing between resilience types and mechanisms specific to warfare versus peacetime shocks. Second, it provides empirical evidence of path-dependent resilience, demonstrating that historical economic structures matter more than geographical exposure to immediate threats. Third, it offers methodological insights by applying taxonomic analysis to measure multi-dimensional regional performance under conditions of severe data constraints, a common challenge in conflict research.
The rest of this study is organised as follows. Section 2 reviews relevant literature on regional resilience, external economic activity and conflict-zone economics, identifying key research gaps. Section 3 presents our methodology, including detailed justification for taxonomic analysis and comprehensive indicator descriptions. Section 4 presents empirical results, including spatial visualisations and temporal comparisons and discusses findings in relation to existing literature and theoretical frameworks. Section 5 concludes with implications for theory, policy and future research directions.
2. Literature Review
Regional economic resilience has emerged as a central concept in economic geography and regional studies, particularly following the 2008 global financial crisis. Martin (2012) conceptualised resilience as encompassing four dimensions: resistance (the ability to withstand shocks), recovery (the speed and extent of bounce-back), reorientation (structural adaptation) and renewal (emergence of new growth paths). This multi-dimensional framework moves beyond simple equilibrium models towards understanding resilience as an evolutionary process.
Pike, Dawley, S and Tomaney (2010) further distinguished between adaptation (short-term coping) and adaptability (long-term capacity for structural change), arguing that sustainable resilience requires both. Crucially for the present study, Bristow and Healy (2014a, 2014b) demonstrated that resilience is not merely an inherent regional property but emerges from purposeful actions by regional actors, institutions and governance structures. This agency perspective is particularly relevant for understanding Ukrainian regions, where deliberate policy interventions and institutional responses have shaped resilience outcomes.
This institutional dimension of resilience is well documented empirically. Christopherson, Michie and Tyler (2010) showed that regions with responsive governance structures navigate economic shocks more effectively. Schiappacasse and Müller (2015) demonstrated how institutional capacity for coordination enhances resilience, while Nehrey and Zomchak (2022) and Nijkamp et al. (2024) emphasised institutional adaptability and digitalisation as crucial for lagging regions facing structural challenges. Most directly relevant to the Ukrainian context, Libanova and Kotygorenko (2025) examine how governance systems shape economic resilience under active wartime conditions, providing a conceptual bridge between the general resilience literature and this study’s empirical setting.
A second key determinant is the preexisting economic structure of a region. Hassink (2010) argued that economic diversification serves as both a buffer against sector-specific shocks and a platform for adaptation, though he emphasised that quality and complementarity of activities matter more than mere variety. External trade relationships reinforce this structural argument: regions deeply integrated into global value chains face disruption risks when those chains break, yet diversified external connections can provide alternative markets and resources during crises.
Enterprise mobility represents a further structural mechanism through which regional resilience is actively redistributed during conflict. Polishchuk et al. (2025) and Polishchuk et al. (2026) examined how enterprise relocation sustains resilience during wartime by spatially redistributing productive capacity from vulnerable to secure territories. This mechanism is central to our hypothesis, as it provides the channel through which pre-war structural advantages are transferred across regions. The broader institutional and economic environment conditioning this process includes financial inclusion (Shapoval et al., 2021), economic security (Kovalchuk Berezka & Karpyshyn, 2024, Kovalchuk et al., 2025), corporate social responsibility (Mei et al., 2024) and digital marketing capacity (Vysochan et al., 2025) – factors that collectively determine whether relocated enterprises can successfully integrate into receiving regions and sustain their external economic activity.
The spatial and temporal dimensions of resilience add further nuance. MacKinnon et al. (2025) showed how spatial policies influence resilience trajectories in post-crisis contexts, while Pascariu, Kourtit, and Tiganasu (2020) highlighted geographical borders as both constraints and opportunities. De Cezaro Eberhardt and Fochezatto (2024) demonstrated that crisis duration and intensity fundamentally shape resilience patterns, with prolonged shocks, as in Ukraine’s case, requiring different adaptive mechanisms than sudden disruptions. Wang, Xu and Wang (2023) showed that ecological and economic dimensions of resilience interact, reinforcing the importance of multi-dimensional assessment. Food security, a particular pressure point in war economies, has been modelled using autoregressive forecasting methods in the Ukrainian context, demonstrating how specific resilience dimensions can be tracked quantitatively (Zomchak & Kukhotska, 2025).
While resilience in the face of financial instability and natural catastrophes has been thoroughly examined, the literature lacks sufficient insight into how regional systems adapt to active, large-scale conventional warfare between states. Limited research from conflict zones suggests mixed evidence. Syrian (Shaar & Heydemann, 2024) and Afghanistan, Iraq and Palestine (Althalathini, 2020) studies indicate proximity to fighting zones predicts economic collapse, yet also show that pre-conflict economic structures influence wartime trajectories. Ukraine’s case differs fundamentally: conventional warfare with relatively protected rear areas, maintained state institutional function across most territory and international support.
Despite extensive resilience literature, one critical gap remains, namely, a limited understanding of resilience mechanisms under active, large-scale conventional warfare between states.
This study addresses this specific gap by examining how regional economies function during active conventional interstate warfare, specifically testing whether path dependence or geographical proximity primarily determines resilience in this context.
A fundamental question in resilience research is what determines which regions survive shocks and which collapse?
Two competing perspectives stand at the core of the scholarly debate on wartime economics. The first one is ‘geographical proximity’ perspective, which posits that physical distance from active combat is the primary determinant of economic collapse. The next one is ‘path dependence’ perspective, which argues that historically accumulated advantages, such as economic structure and infrastructure, enable a region to maintain resilience even under direct threat.
Comparing these factors is critical for understanding whether ‘economic geography’ carries more weight than ‘physical geography’ in a wartime environment. Of particular interest is the role of enterprise relocation as a mechanism that transfers structural potential from vulnerable territories to safer ones, thereby reshaping regional hierarchies.
Drawing upon these theoretical divergences and the identified research gap, we propose the following central hypothesis:
H1: Regional resilience of external economic activity during war is more strongly associated with pre-war structures (institutions and infrastructure) rather than geographical proximity to the frontline; simultaneously, enterprise relocation appears as a distinguishing factor among regions demonstrating absolute performance improvements during the active conflict phase
3. Methodology
This study employs taxonomic analysis. Taxonomic analysis enables simultaneous consideration of multiple indicators without arbitrary weighting, producing composite indices capturing overall performance, which is important due to the multi-dimensional regional resilience nature. Taxonomic analysis accommodates varying indicator sets by constructing period-specific reference vectors, enabling valid longitudinal comparison, which is especially important because of the limited availability of indicators due to wartime restrictions. While more data-intensive approaches, such as neural networks or entropy-based methods, have been applied to financial and engineering time series (Bielinskyi et al., 2024, 2025; Izonin et al., 2025; Yemets, Izonin & Mitoulis, 2025), these require complete, high-frequency indicator sets that are unavailable under wartime statistical restrictions, making taxonomic analysis the methodologically appropriate choice.
The application of taxonomic analysis, similar to integrated assessment, requires standardisation of indicators.
The first step involves calculating the mean value of each criterion:
where x̅i is the arithmetic mean of the criterion, xij - is the value of criterion i for object j and m is the number of objects.The second step consists of computing the standard deviation for each criterion:
where σi is the standard deviation of criterion i, x̅i is the arithmetic mean of the criterion, xij - is the value of criterion i for object j and m is the number of objects.These values are required to construct the standardised matrix Z:
where zij is the standardised value of criterion i for object j; σi is the standard deviation of criterion i, x̅i is the arithmetic mean of the criterion, xij - is the value of criterion i for object j and m is the number of objects.At this stage, criteria are divided into stimulants and destimulants. For stimulants, the maximum standardised value is taken as a benchmark; for destimulants, the minimum value is selected. This constitutes the so-called reference vector.
The next step is to calculate the distance between each observation and the reference vector:
where zij is the standardised value of criterion i for object j; z0i is the benchmark value of criterion i and Cj0 is the distance between object j and benchmark object 0.The average distance is then computed:
where Cj0 is the distance between object j and benchmark object 0, m is the number of objects and is the average distance between all objects.The standard deviation of distances is calculated as:
where Cj0 is the distance between object j and benchmark object 0, m is the number of objects, is the average distance between all objects and S0 is the standard deviation of distances.The maximum permissible deviation from the reference vector is determined as:
where is the average distance between all objects, S0 is the standard deviation of distances and C0 is the maximum permissible deviation from the reference vector.Finally, the synthetic development index dj and the taxonomy coefficient Kj are calculated:
where dj is a synthetic index for object j; Kj is the taxonomy coefficient for object j.The taxonomic method represents an effective tool for systematising and analysing the external economic activity of regions. It reveals key differences in levels of development across research objects and helps identify the determinants of regional economic performance. This approach enables the identification of both strengths and weaknesses of each region, which is crucial for designing targeted strategies and policies aimed at fostering growth.
Moreover, the method allows for ranking Ukrainian regions by external economic resilience, clustering regions with similar patterns of crisis response and tracing the dynamics of regional rankings under conditions of geopolitical instability.
For the study of the adaptation of Ukraine’s regional external economic activity to wartime conditions, three critical periods were selected, reflecting distinct phases of geopolitical instability:
2015 – the first year after the onset of Russia’s war against Ukraine, marked by the annexation of Crimea and the beginning of hostilities in the Donbas. This period reflects the outcomes of initial adaptation and establishes a ‘wartime baseline.’ Analysis of the pre-2014 period was excluded due to the impossibility of data comparison resulting from large-scale territorial changes and shifts in statistical methodology following the loss of control over parts of the territory.
2022 – the year of Russia’s full-scale war in Ukraine, the largest and deadliest war in Europe since the Second World War. This year represents the peak shock intensity and the survival phase; therefore, its inclusion is critical for testing the performance of resilience mechanisms under extreme pressure in contrast to gradual adaptation.
2024 – 10 years since the war began and 2 years since the escalation to full-scale war, when regional economies have already demonstrated certain patterns of adaptation to the new environment.
Thus, the perceived ‘asymmetry’ of the research intervals is a deliberate methodological choice designed to compare the immediate shock response (2022) with long-term systemic adaptability (2024) against the backdrop of prior wartime experience (2015). Furthermore, the selection of 2024 over 2023 allows for the capture of more mature adaptation outcomes and significant structural shifts resulting from the relocation of thousands of enterprises.
The study covers 24 Ukrainian regions (oblasts). Unfortunately, due to wartime conditions, not all statistical data, particularly at the regional level, are available. Many indicators are considered too sensitive to be published, and in some cases, data cannot be collected at all. Therefore, only those indicators that are accessible through official open sources have been used. Data were collected for 24 oblasts of Ukraine, with the city of Kyiv included within Kyiv Oblast, from the following sources: the State Statistics Service of Ukraine (State Statistics Service of Ukraine (n.d.)), the National Bank of Ukraine (National Bank of Ukraine (n.d.)) and the State Customs Service of Ukraine (Customs Service of Ukraine (n.d.)).
4. Results and Discussion
Given the wartime state in Ukraine, data for 2024 are missing for several indicators. Therefore, the analysis involves an assessment of the current state in 2024, complemented by a parallel comparative study of 2022 and 2015 based on the available information. For 2024, the analysis of regional foreign economic activity relies on the following criteria:
total value of exports of goods and services;
total value of imports of goods and services;
number of enterprises licensed to conduct customs brokerage activities;
number of enterprises licensed to establish and operate temporary storage warehouses;
number of relocated enterprises that moved to a given region;
consumer price indices.
For 2022 and 2015, the following criteria were used:
total value of exports of goods and services;
total value of imports of goods and services;
number of enterprises licensed to conduct customs brokerage activities;
number of enterprises licensed to establish and operate temporary storage warehouses;
exports of goods by enterprises classified by the number of employees;
consumer price indices;
capital investment;
population size;
imports of goods by enterprises classified by the number of employees.
An important limitation must be acknowledged at the outset: comprehensive data for the pre-2014 period are not available due to subsequent territorial changes and statistical methodology revisions following the annexation of Crimea and occupation of parts of Donbas. Therefore, 2015 serves as our earliest baseline, representing the first full year after the war outbreak.
Due to wartime conditions, many regional-level indicators are classified as sensitive or cannot be collected reliably. Our indicator selection reflects these constraints while capturing key dimensions of external economic activity and regional capacity. Table 1 presents the complete indicator framework.
Table 1.
Comprehensive indicator framework
| Indicator | Description | Unit | Indicator type | Relevance to resilience |
|---|---|---|---|---|
| Total exports | Value of all goods and services exported | Million USD* | Stimulant | Reflects production capacity and international competitiveness |
| Total imports | Value of all goods and services imported | Million USD | Stimulant | Indicates consumption capacity and supply chain functionality |
| Customs brokers | Number of enterprises licensed for customs brokerage | Count | Stimulant | Measures trade infrastructure capacity |
| Storage warehouses | Number of enterprises operating temporary storage warehouses | Count | Stimulant | Indicates logistics infrastructure depth |
| Consumer price index | Regional price level changes | Index (%) | Destimulant | Reflects economic stability; high inflation indicates stress |
| Exports by enterprise size | Value of exports by firms categorised by employee count | Million USD | Stimulant | Shows export base diversification across firm sizes |
| Imports by enterprise size | Value of imports by firms categorised by employee count | Million USD | Stimulant | Indicates demand structure across business sectors |
| Capital investment | Total capital investment in the regional economy | Million UAH** | Stimulant | Measures future-oriented economic confidence |
| Population | Registered population of the region | Thousands | Stimulant | Controls for regional scale and market size |
| Relocated enterprises | Number of businesses officially relocated to the region from war zones | Count | Stimulant | Captures war-induced economic migration effects |
Stimulants are indicators where higher values indicate better performance (exports, infrastructure, population). Destimulants are indicators where lower values indicate better performance (inflation).
The variation in available indicators across periods reflects data availability constraints rather than methodological choice. By 2024, Ukrainian authorities discontinued publishing enterprise-size-disaggregated trade data and capital investment figures at regional levels for security reasons. However, data on relocated enterprises became available for the first time in 2024, as this phenomenon only emerged after the 2022 full-scale war. While this limits perfect comparability, the core indicators (exports, imports, trade infrastructure, inflation) remain consistent, enabling valid longitudinal comparison of overall external economic performance.
Taxonomic analysis, in the context of Ukraine’s regional foreign economic activity, represents a useful tool for evaluating and comparing the economic characteristics of different regions. This method allows for the classification of regions according to a range of indicators, such as foreign trade volumes, export and import structures and trade orientation toward different international partners. This section presents the taxonomic analysis results examining patterns consistent with our hypothesis that regional resilience during war is more strongly associated with pre-war structures than with geographical proximity and that enterprise relocation co-occurs with superior regional performance. It should be noted that taxonomic analysis identifies patterns and rankings rather than causal relationships; the association between pre-war structures and wartime resilience observed here cannot be interpreted as evidence of causation without further quasi-experimental or longitudinal analysis.
The first stage of this method involves data standardisation (transformation of matrix X into matrix Y). Analogous to integral evaluation, the mean value of each indicator and its standard deviation are calculated using formulas Eqs (1) and (2). Standardised values are then derived using formula Eq. (3). The next step, as in integral evaluation, is the determination of the reference vector. Stimulating and de-stimulating indicators are treated in the same way as in the integral method. The taxonomic method requires determining the maximum value among stimulators and the minimum value among de-stimulators. These values constitute the reference points for each criterion and serve as benchmarks for subsequent calculations.
The next step involves calculating the distance between individual elements of the standardised matrix and the reference vector, using formula Eq. (5), where j denotes the ordinal number of a region. Using formula Eq. (6), the average distance between observations was calculated: 9.09 in 2024; 10.40 in 2022; and 9.42 in 2015.
The standard deviation was then computed using formula Eq. (7). The values proved to be relatively close across the 3 years: 0.78 in 2024, 0.70 in 2022 and 0.71 in 2015. These results are comparatively large, indicating the need for improvements in foreign economic performance across most regions. One of the final steps is to calculate the maximum possible deviation from the benchmark across all regions of Ukraine, using formula Eq. (8). The final calculation involves determining the taxonomy coefficients, derived using formula Eq. (9).
The taxonomic analysis calculated distances from the reference vector for all 24 Ukrainian regions across three periods. Table 2 presents the summary statistics, while Table 3 shows detailed results for each region.
Table 2.
Summary statistics of taxonomic analysis across periods
| Statistical metric | 2015 (first year of war) | 2022 (full-scale war) | 2024 (phase of adaptation to war) | Interpretation |
|---|---|---|---|---|
| Average distance from reference vector () | 9.42 | 10.40 | 9.09 | Lower values indicate closer proximity to optimal performance |
| Standard deviation (S0) | 0.71 | 0.70 | 0.78 | Measures dispersion in regional performance |
| Maximum permissible deviation (C0) | 10.84 | 11.81 | 10.65 | Threshold for acceptable distance from reference vector |
| Average taxonomy coefficient (K̅) | 0.13 | 0.12 | 0.15 | Higher values indicate better overall regional performance |
| Maximum taxonomy coefficient | 0.27 | 0.24 | 0.35 | Best-performing region’s score in each period |
| Minimum taxonomy coefficient | 0.02 | 0.02 | 0.04 | Worst-performing region’s score in each period |
Table 3.
Ranks of Ukrainian regions according to the taxonomic analysis in dynamics
| Region | 2015 | 2022 | 2024 |
|---|---|---|---|
| Vinnytsia | 20 | 17 | 6 |
| Volyn | 5 | 10 | 9 |
| Dnipropetrovsk | 1 | 3 | 3 |
| Donetsk | 18 | 5 | 17 |
| Zhytomyr | 11 | 14 | 10 |
| Zakarpattia | 22 | 6 | 13 |
| Zaporizhzhia | 3 | 7 | 7 |
| Ivano-Frankivsk | 7 | 13 | 21 |
| Kyiv | 15 | 1 | 1 |
| Kirovohrad | 19 | 24 | 16 |
| Luhansk | 14 | 21 | 24 |
| Lviv | 4 | 4 | 4 |
| Mykolaiv | 16 | 12 | 15 |
| Odesa | 2 | 2 | 2 |
| Poltava | 8 | 11 | 5 |
| Rivne | 10 | 20 | 19 |
| Sumy | 12 | 18 | 14 |
| Ternopil | 17 | 23 | 20 |
| Kharkiv | 6 | 8 | 18 |
| Kherson | 13 | 9 | 22 |
| Khmelnytskyi | 24 | 19 | 12 |
| Cherkasy | 23 | 15 | 8 |
| Chernivtsi | 21 | 22 | 23 |
| Chernihiv | 9 | 16 | 11 |
The dynamic shifts in the taxonomic resilience indicators of Ukrainian regions are illustrated in Figure 1.
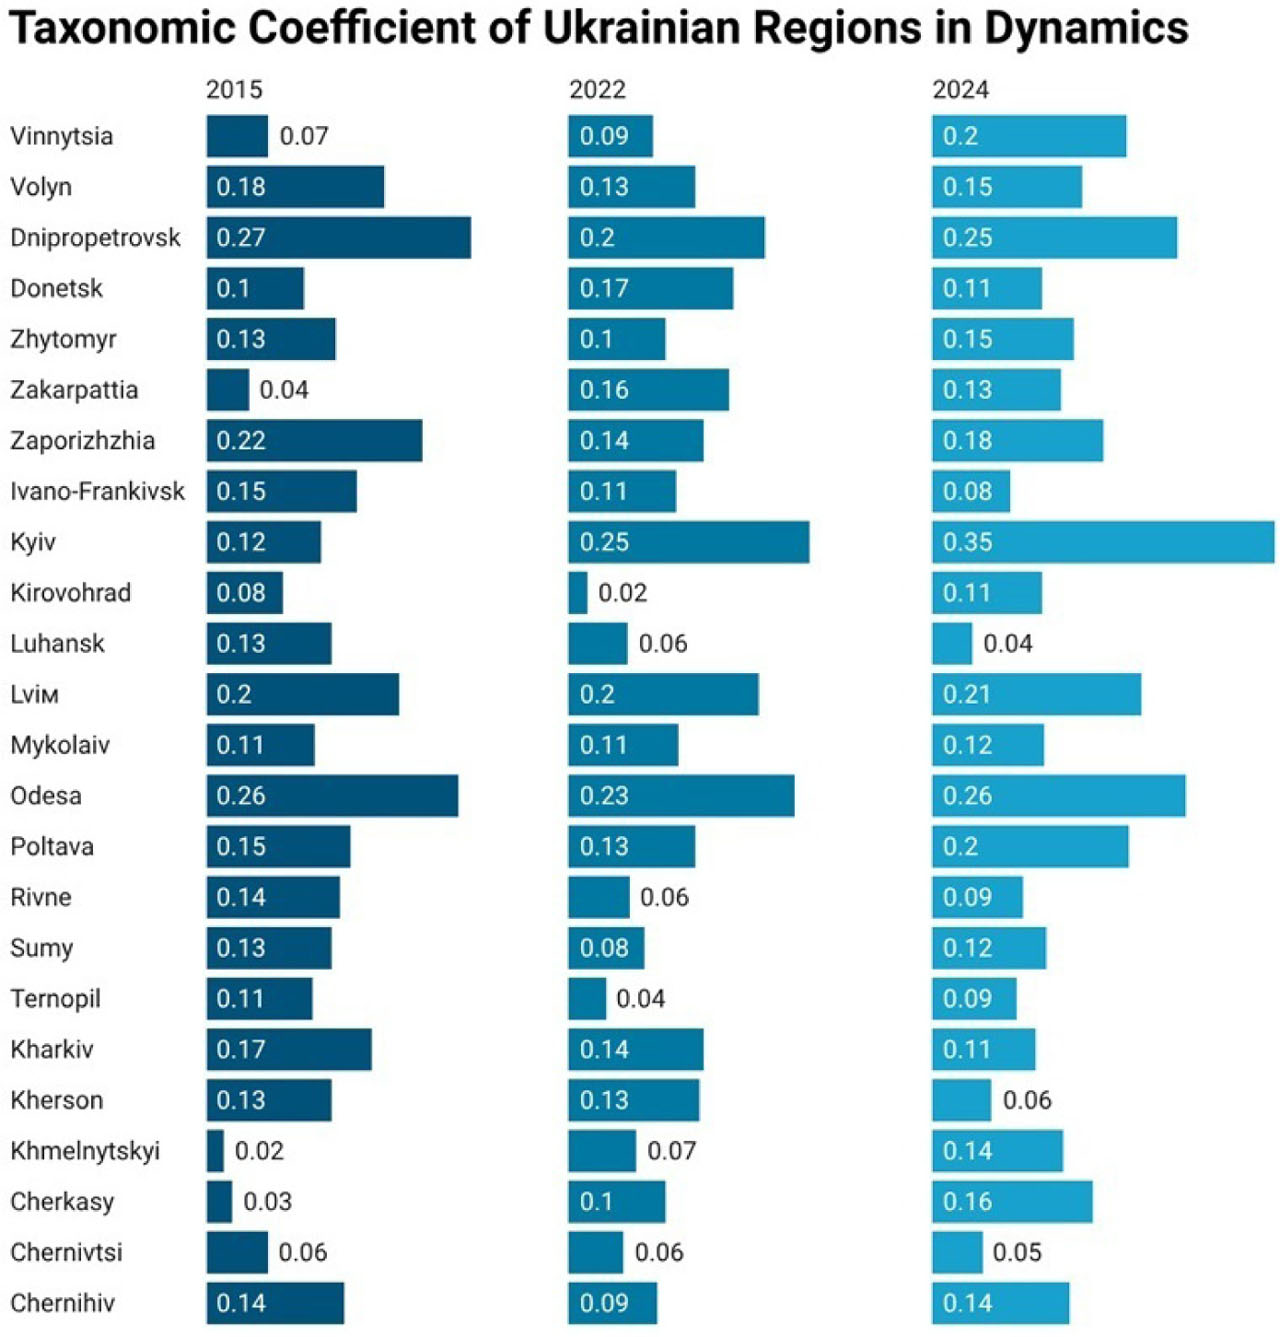
Figure 1.
Taxonomic coefficient of Ukrainian regions in dynamics
Source: Authors’ calculations
The results of the conducted taxonomic analysis made it possible to determine the ranking of Ukrainian regions by key indicators of external economic activity in 2024, 2022 and 2015 and to divide them into four groups (Figure 2).
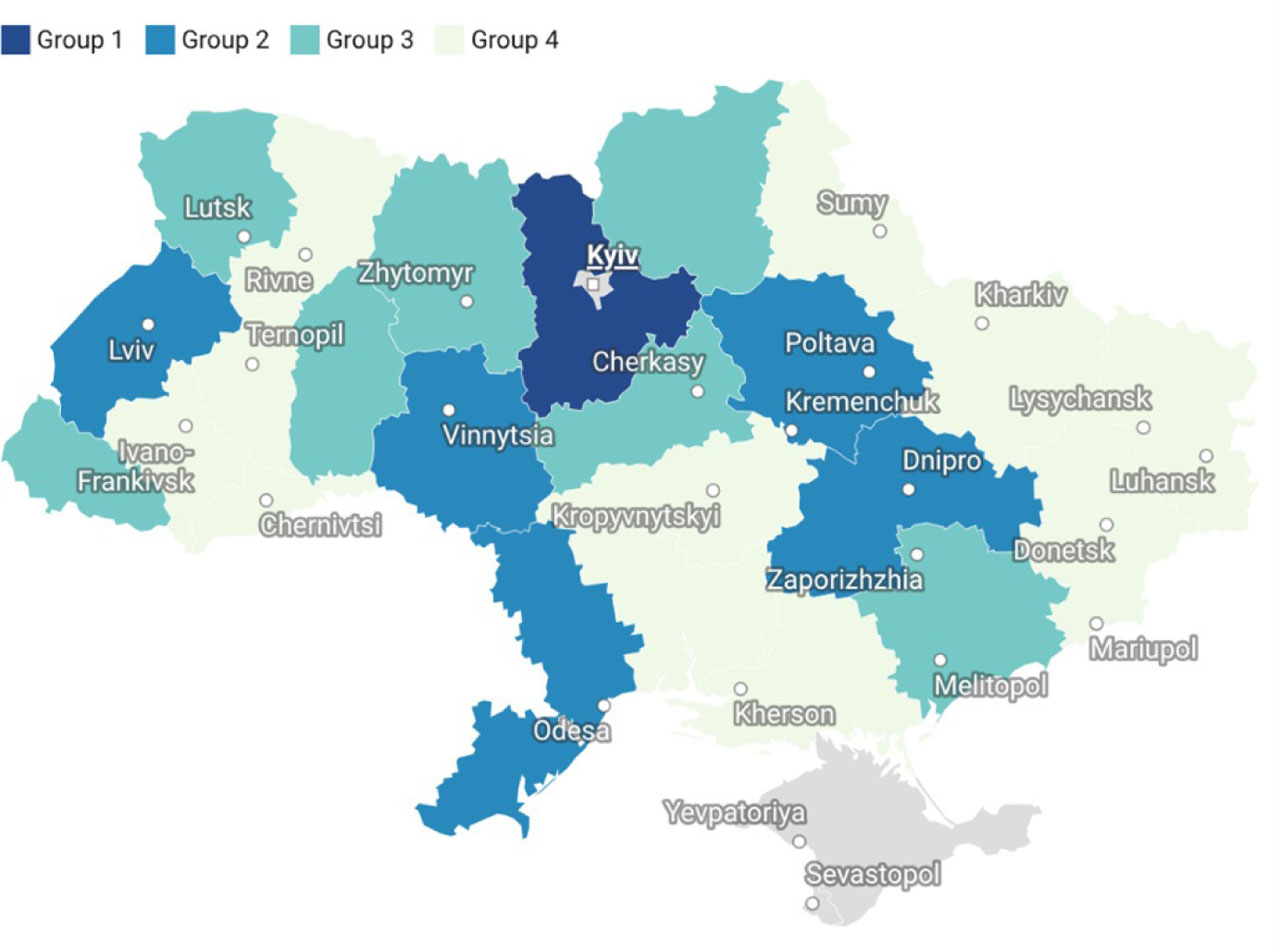
Figure 2.
Clustering Ukrainian regions by taxonomic coefficient (2024)
Source: Authors’ calculations
The resulting taxonomy coefficients demonstrate substantial variation across regions, ranging from 0.04 (Luhansk) to 0.35 (Kyiv), with an average value of 0.15. This represents a notable improvement from 2022 (average: 0.12) and exceeds the 2015 baseline (average: 0.13), providing preliminary evidence regarding both absolute and relative resilience.
For 2024, the first two groups include Kyiv, Odesa, Dnipropetrovsk, Poltava, Vinnytsia and Lviv regions. In these regions, external economic activity demonstrates a certain balance between stimulating factors, such as export volumes, the number of enterprises engaged in brokerage activities and the operation of temporary storage warehouses and the number of relocated enterprises to the region and factors that exert a destabilising influence on the development of Ukraine’s foreign economic activity.
The next group comprises Zaporizhzhia, Cherkasy, Volyn, Chernihiv, Zhytomyr, Khmelnytskyi and Zakarpattia regions, where import volumes and the consumer price index play a more significant role in shaping external economic activity, though the situation is not critical. The last group includes Zakarpattia, Sumy, Mykolaiv, Kirovohrad, Donetsk, Kharkiv, Rivne, Ternopil, Ivano-Frankivsk, Kherson, Chernivtsi and Luhansk regions, where negative (destimulating) indicators prevail, although stimulating indicators still remain at satisfactory levels.
The analysis of external economic activity for 2024 reveals numerous problems and inefficiencies across 13 regions of the country. However, a particularly critical situation is observed in Ivano-Frankivsk, Kherson, Chernivtsi and especially Luhansk regions, where state intervention and regulatory measures are urgently needed.
The concentration of relocated enterprises emerges as a critical differentiator. Kyiv region absorbed 2,847 relocated businesses, Dnipropetrovsk 1,523 and Odesa 1,089, substantially more than other regions. This pattern demonstrates that regions hosting enterprise relocations exhibit superior resilience outcomes.
A similar analysis for 2022 again divides the regions into four groups (Figure 3), allowing us to observe changes across them.
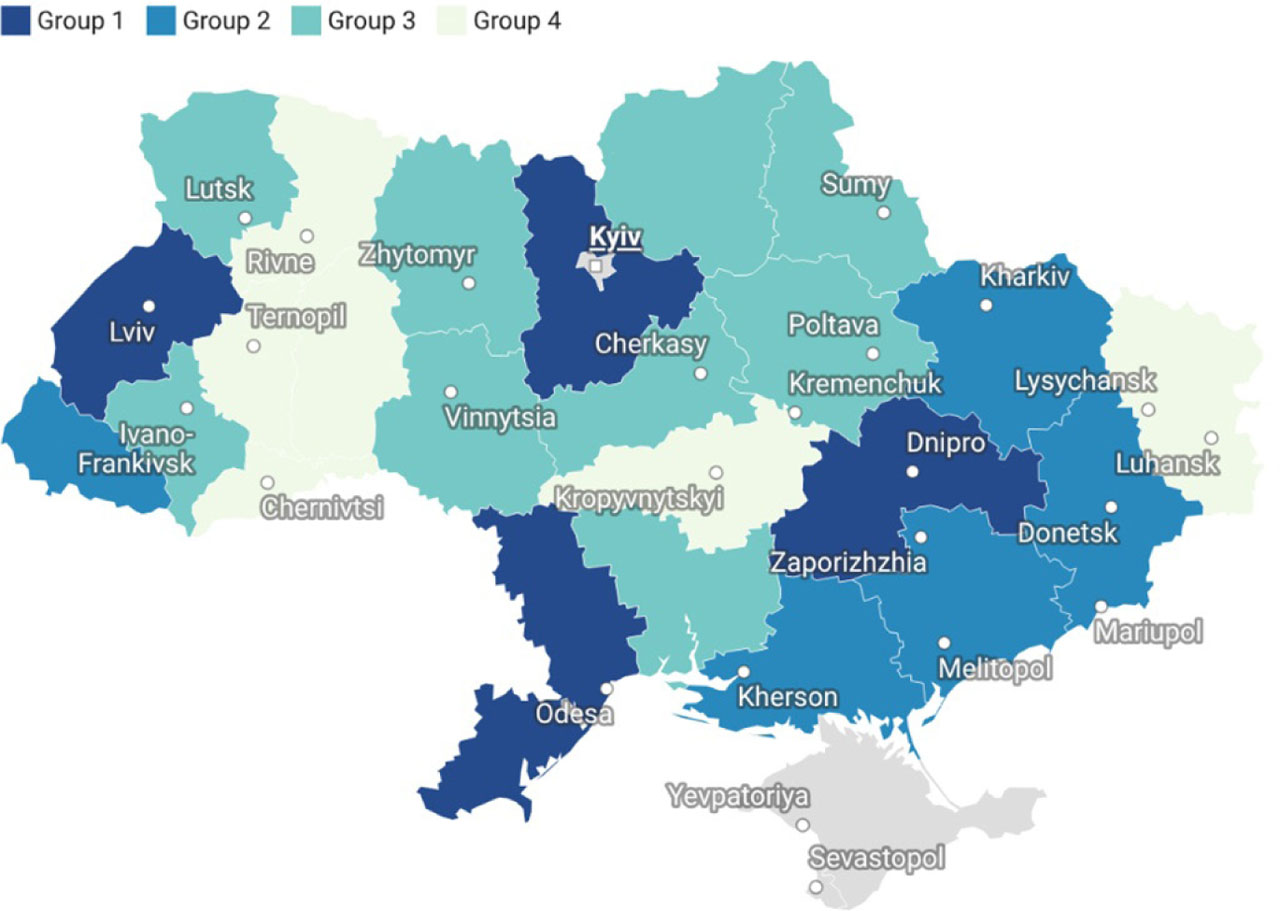
Figure 3.
Clustering Ukrainian regions by taxonomic coefficient (2022)
Source: Authors’ calculations
The first group comprises Kyiv, Odesa, Lviv and Dnipropetrovsk regions, which demonstrated the highest values of the taxonomic evaluation of external economic activity. The second group consists of Donetsk, Zakarpattia, Zaporizhzhia, Kharkiv, Kherson, Volyn and Poltava regions.
The remaining regions fall into the third and fourth groups, with Ternopil, Luhansk and Kirovohrad regions displaying the lowest values.
The full-scale war reveals the immediate impact of extreme geopolitical shock. The average distance from the reference vector increased to 10.40 (compared to 9.42 in 2015), with a standard deviation of 0.70 and a maximum permissible deviation of 11.81. The average taxonomy coefficient declined to 0.12, the lowest across all three periods, reflecting widespread disruption.
Despite this overall decline, regional hierarchies remained remarkably stable. Kyiv (0.09), Odesa (0.13) and Dnipropetrovsk (0.20) maintained leadership positions, while Luhansk (0.02), Kirovohrad (0.06) and Ternopil (0.06) remained in the lowest tier. This stability supports the hypothesis regarding path-dependent resilience, where pre-war economic structures continue to provide competitive advantages even under extreme shocks.
Compared to 2015 (Figure 4), the situation in 2022 was somewhat worse, though 2024 shows improvement relative to both years. Following the classification principle of previous years, the regions in 2015 may also be divided into four groups, with group composition largely resembling that of 2022.
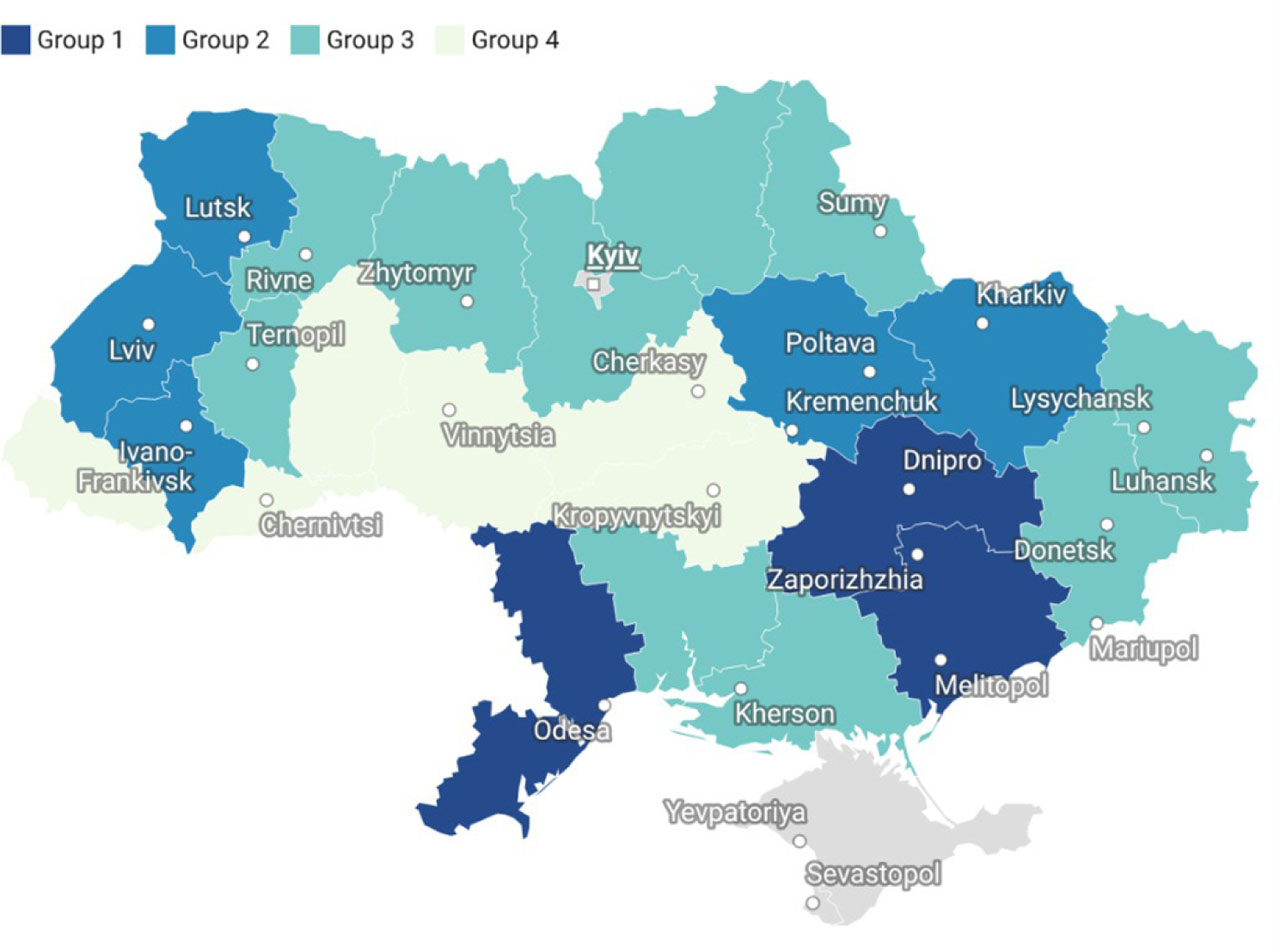
Figure 4.
Clustering Ukrainian regions by taxonomic coefficient (2015)
Source: Authors’ calculations
This allows us to trace certain trends in the development of Ukrainian regions during 2015, 2022 and 2024.
Khmelnytskyi, Cherkasy and Zakarpattia regions demonstrate strong development dynamics, moving from the lowest positions in 2015 to mid-ranking by 2024. Kyiv region, which belonged to the third group in 2015, now shows the best taxonomic score in 2024, with a difference of 0.9 compared to the following regions. In contrast, the Dnipropetrovsk region slightly slowed its external economic growth between 2015 and 2024.
The increase in average taxonomy values from 0.12 (2022) to 0.15 (2024), exceeding the 2015 baseline (0.13), demonstrates both relative and absolute resilience. Ukrainian regions collectively achieved not merely recovery but improvement during active warfare, a remarkable finding rarely documented in conflict economics literature.
The maximum values increased from 0.24 (2022) to 0.35 (2024), while the minimum values improved from 0.02 to 0.04, indicating resilience across the performance distribution rather than concentrated only in leading regions. This suggests systemic adaptation rather than isolated success stories.
The stability of regional rankings strongly supports the hypothesis. Kyiv, Dnipropetrovsk and Odesa consistently occupied top positions across all three periods, while Luhansk remained persistently disadvantaged. This path dependence demonstrates that pre-war economic structures, industrial capacity, trade infrastructure, institutional quality and human capital provide enduring competitive advantages that persist through extreme shocks.
A strong correlation between relocated enterprise absorption and regional performance in 2024 was identified. Regions receiving more than 1,000 relocated businesses (Kyiv, Dnipropetrovsk, Lviv and Kharkiv) significantly outperformed demographically similar regions without such inflows. This pattern suggests that managed economic migration represents an effective crisis response mechanism, redistributing productive capacity from vulnerable to secure locations.
The evidence decisively rejects simple geographical proximity explanations for economic vulnerability. Multiple patterns demonstrate this:
frontline regions, such as Zaporizhzhia and Kharkiv, maintain moderate-to-stable performance (Groups 2–3) despite direct war exposure;
western regions, such as Ivano-Frankivsk and Chernivtsi, occupy the lagging group (Group 4) despite geographical safety;
partially occupied regions, such as Donetsk, demonstrate higher resilience than some peaceful western regions.
These patterns indicate that pre-war economic structures, diversified industrial bases, established trade networks and institutional capacity matter more than geographical distance from the frontline. This finding contradicts conventional wisdom in conflict-zone economics and demands theoretical reconsideration of vulnerability factors.
Overall, no radical differences in taxonomic evaluation are observed across the 7-year period. The situation worsened in 2022 due to the full-scale war, yet by 2024, the regions had regained their prior standing and even surpassed previous results.
Based on the results of the 2024 taxonomic analysis of regional external economic activity, Ukrainian regions may be typologized into four groups:
Leading region (Kyiv) – characterised by high export volumes, developed infrastructure and balanced external economic activity.
Stable regions (Odesa, Dnipropetrovsk, Lviv, Poltava and Vinnytsia) – with relatively stable performance and potential for further improvement.
Problematic regions (Zaporizhzhia, Cherkasy, Volyn, Zhytomyr, Chernihiv, Khmelnytskyi and Zakarpattia) – where destimulating indicators play a dominant role.
Lagging regions (Sumy, Mykolaiv, Kirovohrad, Donetsk, Kharkiv, Rivne, Ternopil Ivano-Frankivsk, Kherson, Chernivtsi and Luhansk) – with critically low levels of external economic activity.
To test whether pre-war structures or geographical proximity primarily determine resilience, we examine performance patterns by geographical position and compare critical contradictory cases (Table 4).
Table 4.
Critical contradictory cases – structure vs. geography
| Region | 2024 rank | Key pre-war structural characteristics |
|---|---|---|
| Strong frontline regions: | ||
| Zaporizhzhia | 7 | Nuclear power complex, heavy industry, Dnipro River port infrastructure |
| Dnipropetrovsk | 3 | Metallurgical industry, aerospace sector, river port, decades of industrial capacity |
| Kharkiv | 18 | Major industrial centre, education hub, transport junction |
| Weak safe regions: | ||
| Chernivtsi | 23 | Peripheral location, limited industrial base, small market |
| Ivano-Frankivsk | 21 | Peripheral location, small industrial base, agricultural focus |
| Ternopil | 20 | Peripheral location, agricultural economy, limited infrastructure |
Zaporizhzhia, despite being partially occupied with active combat, ranks seventh overall, outperforming eight western regions experiencing no combat. Dnipropetrovsk, located 50 km from the frontline with frequent missile attacks, ranks third nationally. Meanwhile, Chernivtsi and Ivano-Frankivsk, located 450–600 km from any fighting, rank 23rd and 21st, among the worst performers nationally.
These results directly contradict the limited existing conflict-zone research. Martin (2012) documented that regional hierarchies remain remarkably stable across economic cycles during financial crises, with historically strong regions maintaining advantages, a phenomenon he termed ‘hysteresis.’ Our evidence extends this concept to extreme warfare contexts. Dnipropetrovsk ranked first in 2015 and third in 2024 despite sustained proximity to fighting; Luhansk ranked last across all three periods. Pre-war structural characteristics, decades of accumulated infrastructure, institutional capacity and industrial networks provide competitive advantages that persist even under extreme physical shocks.
Our findings strongly support Christopherson Michie and Tyler. (2010) findings that regions with responsive governance structures and adaptive institutions navigate economic shocks more effectively: leading regions, such as Kyiv, Dnipropetrovsk and Odesa, possess institutional capacity for crisis coordination, regulatory adaptation and strategic decision-making developed over decades. Western peripheral regions, such as Chernivtsi, despite geographical safety, lack this institutional depth, explaining their poor performance despite favourable positioning.
The evidence demonstrates that even diversified peripheral regions (Chernivtsi has agriculture, tourism and light industry) underperform specialised but centrally-located regions (Dnipropetrovsk’s metallurgy concentration) due to infrastructure deficits and network effects. This supports Hassink (2010)’s hypothesis that economic diversification serves as both a buffer against shocks and a platform for adaptation, though quality matters more than mere variety.
The critical insight is that economic geography (centrality in trade networks, infrastructure accumulated over decades, and institutional capacity) matters far more than physical geography (distance from fighting) in determining warfare resilience. Ukraine’s conventional interstate war with defined frontlines creates protected rear areas, but only regions with appropriate structural capacity can capitalise on this protection.
5. Conclusions
The results of the taxonomic analysis of Ukraine’s regional external economic activity confirm that geopolitical shocks (in particular, Russia’s war against Ukraine) pose significant challenges for the regions. At the same time, they also demonstrate considerable adaptability to new operating conditions.
The average taxonomic indicator increased from 0.12 in 2022 to 0.15 in 2024, exceeding the 2015 level of 0.13. This confirms not only the adaptive capacity of Ukrainian regions to maintain performance under crisis conditions but also their ability to improve external economic outcomes even during the active phase of war. This is a highly important finding and a clear manifestation of regional resilience.
This research examined whether pre-war economic structures or geographical proximity to frontlines primarily determine regional resilience during warfare, using taxonomic analysis of 24 Ukrainian regions across 2015, 2022 and 2024. Near-frontline regions with strong pre-war structures (Dnipropetrovsk, Zaporizhzhia) significantly outperformed geographically safe western regions with weak structures (Chernivtsi, Ivano-Frankivsk and Ternopil). Near-frontline regions averaged a taxonomy coefficient of 0.175 versus western safe regions’ 0.115. Dnipropetrovsk, located 50 km from active combat, ranks third nationally; Chernivtsi, located 450 km from any fighting, ranks 23rd.
Another notable observation is that regions hosting relocated enterprises generally performed better, suggesting that economic migration can serve as an effective tool of crisis management. Furthermore, geographical proximity to war zones does not necessarily translate into economic vulnerability: relatively safe western regions, such as Chernivtsi and Ivano-Frankivsk, nevertheless fell into the lagging group. The dynamic analysis of regional resilience also highlights the importance of historical development trajectories. Kyiv and Dnipropetrovsk regions consistently remained among the leaders, while Luhansk was a stable laggard, indicating that structural characteristics provide enduring competitive advantages or disadvantages, even under extreme shocks. At the same time, the case of the Khmelnytskyi region shows that upward mobility in the ranking is possible even for regions that historically underperformed, through systematic efforts and improved effectiveness.
These findings contribute to resilience theory in two ways. First, they extend the concept of path-dependent resilience (which is documented by Martin (2012) for financial crises) to the context of active large-scale conventional warfare, demonstrating that structural hysteresis operates even under extreme physical shocks. Second, they challenge the geographical determinism implicit in much conflict-zone economics research: physical proximity to fighting is a poor predictor of economic performance when pre-war structural capacity is accounted for. This suggests that wartime resilience frameworks must incorporate economic geography alongside physical geography as an explanatory dimension.
For policymakers, the findings highlight some actionable priorities. Regions with weak pre-war structural foundations require targeted institutional capacity-building and infrastructure investment, as geographical safety alone does not translate into economic resilience. At the same time, managed enterprise relocation emerges as an effective crisis response instrument: the experience of Kyiv, Dnipropetrovsk and Odesa demonstrates that receiving regions with sufficient absorptive capacity can improve their external economic performance even during active warfare. Systematic relocation management programmes, combining logistical support with institutional integration measures, should be a central element of wartime economic policy.
This study has several limitations that should be acknowledged. The analysis is descriptive and pattern-based; the associations observed between pre-war structures and wartime resilience cannot be interpreted as causal without further quasi-experimental or longitudinal analysis. The indicator set varies across periods due to wartime data restrictions, which limit perfect comparability between 2015, 2022 and 2024. The study does not explicitly operationalise geographical proximity as a continuous variable, relying instead on qualitative case comparisons; a formal statistical test of structural versus geographical predictors was not feasible given available data. The absence of pre-2014 data prevents analysis of the pre-war baseline, and the 2024 data reflect an ongoing war whose trajectory remains uncertain.
These limitations point to several directions for future work. Quasi-experimental designs would allow causal inference on the relative importance of structural and geographical factors. As war-period data become available over time, panel regression models could formally test the structural predictors identified here. Future studies should also examine the micro-level mechanisms of enterprise relocation, specifically, the conditions under which relocated firms successfully integrate into receiving regional economies and sustain export activity, with firm-level data. Finally, comparative analysis extending this framework to other active conflict settings would assess the generalisability of the path-dependence finding beyond the Ukrainian case.