

Table 1.
Variable information
| Variables | Description | Sources |
|---|---|---|
| INF | Inflation is proxied by the GDP deflator | World Bank |
| REM | Remittance inflows as % of GDP | World Bank |
| GE | Government expenditure as % of GDP | World Bank |
| MS | Broad money supply as % of GDP | Asian Development Bank |
| EXR | Exchange rate (somoni per USD) | International Financial Statistics |
| EG | Real economic growth rate in % | World Bank |
| INV | Gross capital formation, proxy for investment, % of GDP | World Bank |
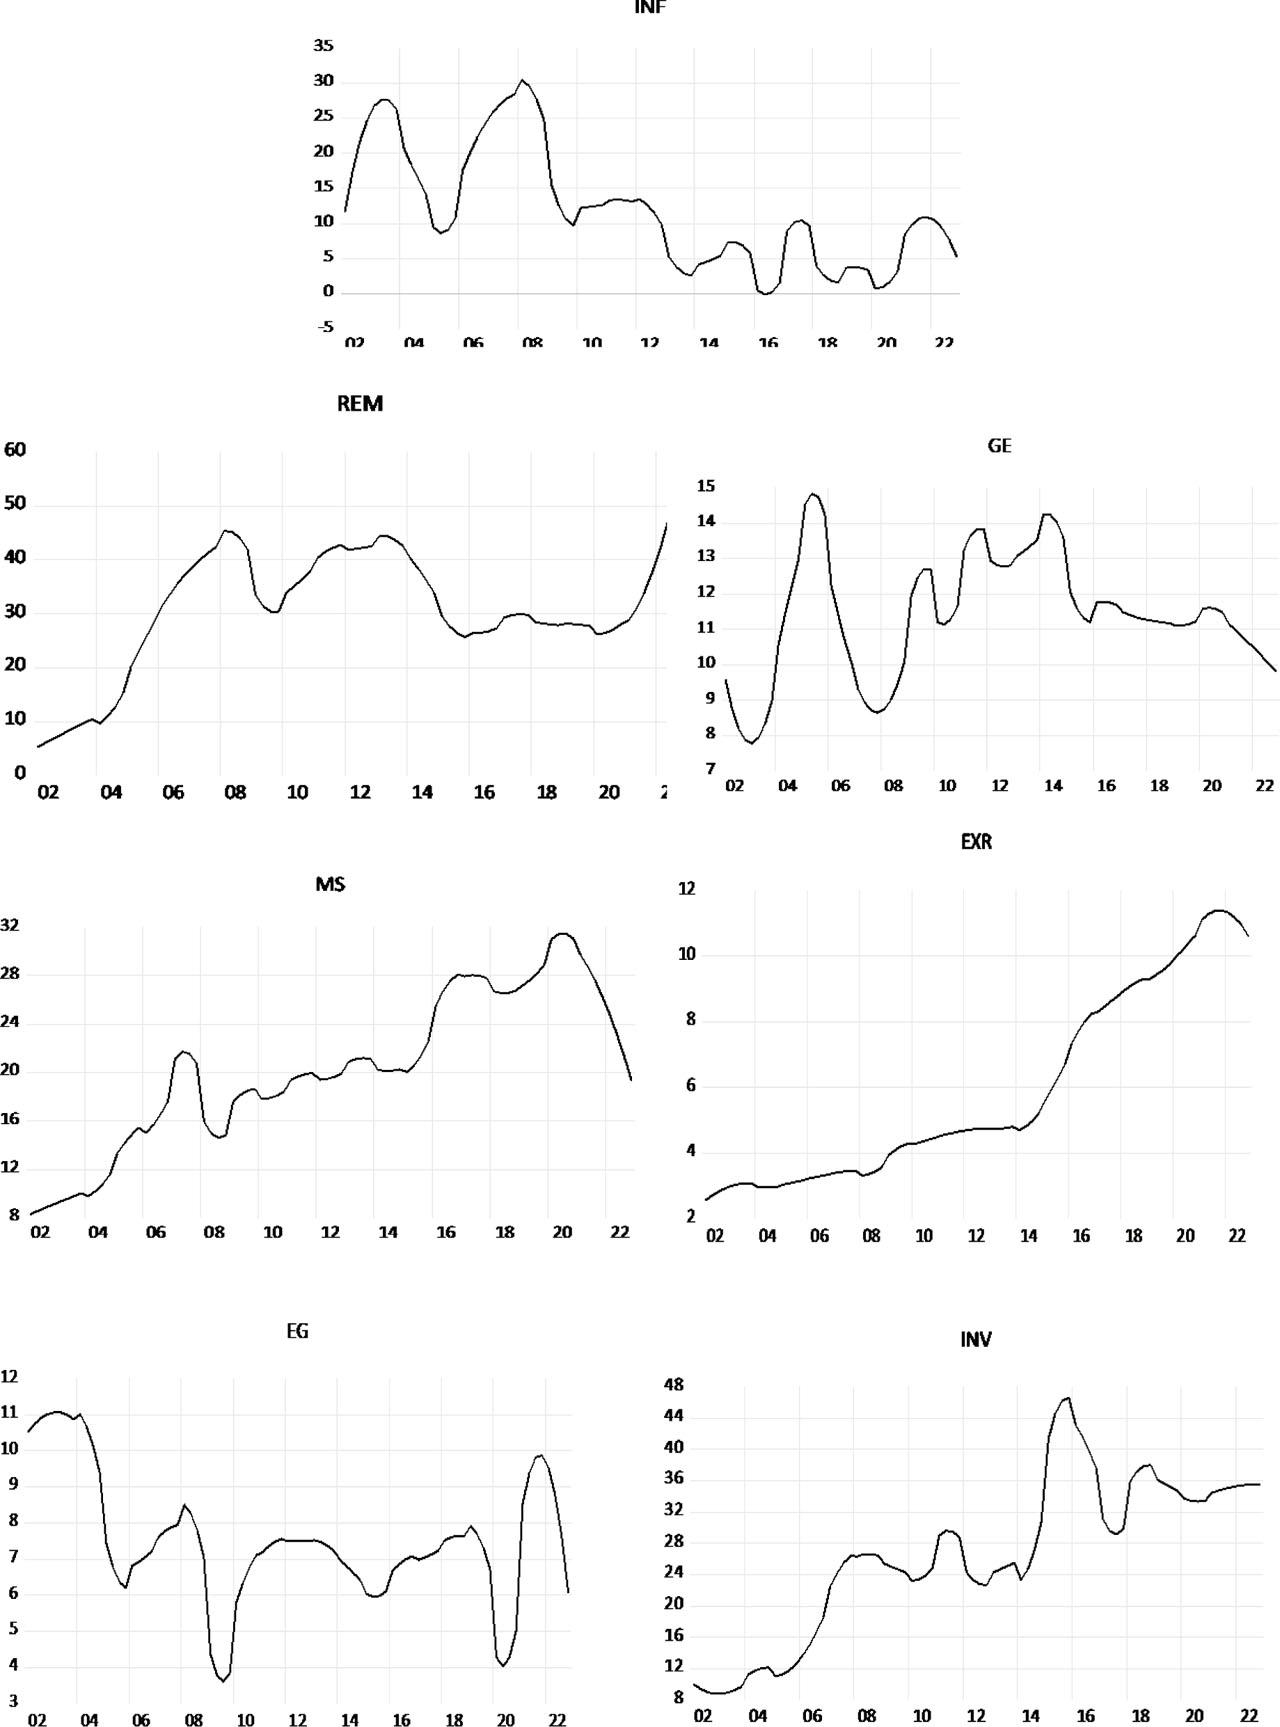
Figure 1.
Trends of the variables. EG, economic growth; EXR, exchange rate; GE, government spending; INV, investment; MS, money supply; REM, remittances
Table 2.
Unit root test results
| ADF | ADF with breaks | |||
|---|---|---|---|---|
| Variable | Level | 1st Diff. | Level | 1st Diff. |
| INF | −1.807 | −4.191*** | −3.488 | −7.841*** (2011Q1) |
| REM | −0.06 | −2.492** | −3.099 | −4.405** (2020Q2) |
| GE | −0.621 | −4.622*** | −4.718** (2014Q1) | |
| MS | −0.353 | −2.247** | −3.162 | −4.711*** (2021Q2) |
| EXR | −0.406 | −2.310** | −3.222 | −4.222* (2021Q2) |
| EG | −1.450 | −3.400*** | −4.966** (2008Q3) | |
| INV | −0.674 | −2.597*** | −3.128 | −4.587** (2004Q1) |
Table 3.
ARDL bounds test
| F-statistics | Significance level (%) | Lower bound | Upper bound |
|---|---|---|---|
| 8.954*** | 10 | 2.631 | 3.589 |
| 5 | 3.043 | 4.100 | |
| 1 | 3.966 | 4.630 |
Table 4.
ARDL approach test results
| Variable | Coefficient | Std error | t-statistic | Prob | Conclusion |
|---|---|---|---|---|---|
| REM | 0.2267 | 0.1143 | 1.9831 | 0.0526 | Significant |
| GE | −1.7010 | 0.3958 | −4.2971 | 0.0001 | Significant |
| MS | −0.6213 | 0.1866 | −3.3297 | 0.0016 | Significant |
| EXR | 2.6336 | 0.7046 | 3.7375 | 0.0005 | Significant |
| EG | 0.3124 | 0.1522 | 2.0526 | 0.0452 | Significant |
| INV | 0.0342 | 0.0407 | 0.8390 | 0.4053 | Insignificant |
| TREND | −0.5635 | 0.1102 | −5.1130 | 0.0000 | Significant |
| ECT (-1) | −0.7582 | 0.8409 | −9.0175 | 0.0000 | Significant |
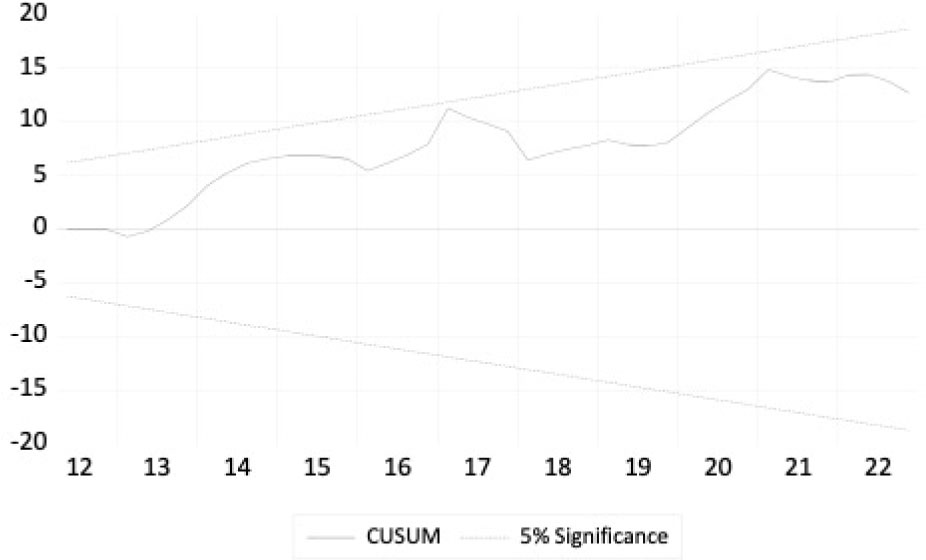
Figure 2.
Result of the CUSUM
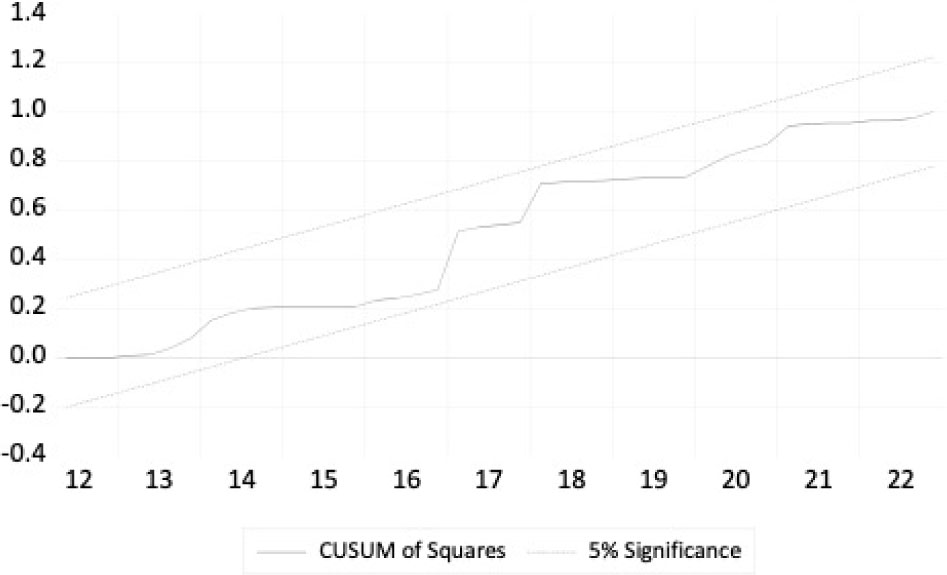
Figure 3.
Result of the CUSUM of squares.
Table 5.
Diagnostic and stability tests
| Test | Null hypothesis | Test stat. (prob) | Conclusion |
|---|---|---|---|
| BPG | Homoscedasticity | 0.2613 (0.9991) | The model is homoscedastic |
| BGLM | No serial correlation | 2.2684 (0.1140) | No evidence of serial correlation |
| Ramsey | No misspecification errors | 0.6108 (0.4381) | No misspecification error |
| CUSUM | Stable | ||
| CUSUM SQ | Stable |
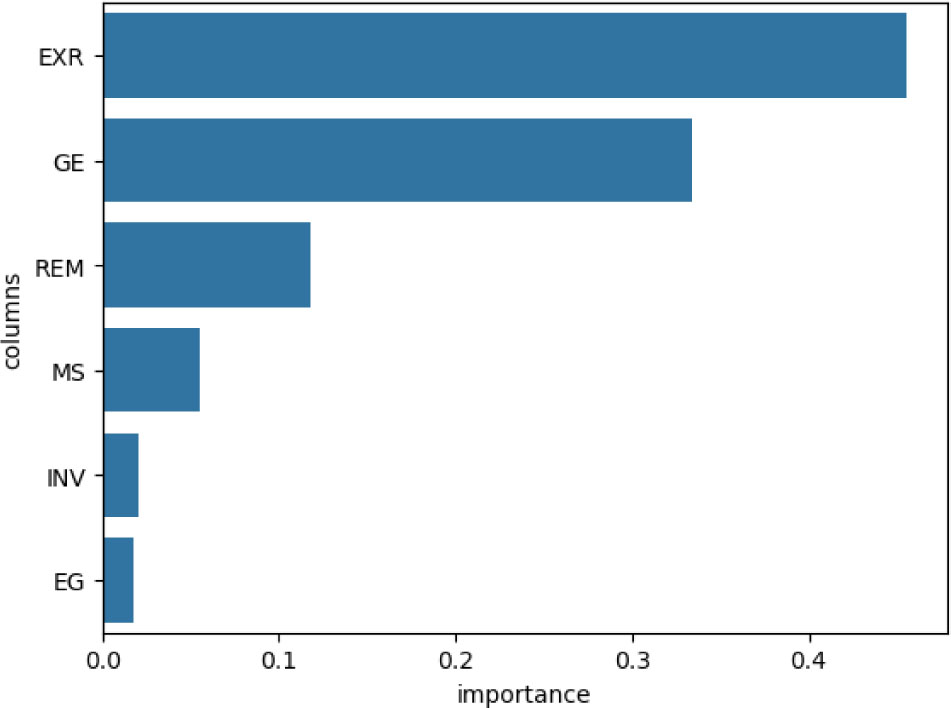
Figure 4.
Feature importance. EG, economic growth; EXR, exchange rate; INV, investment; MS, money supply; REM, remittances.