

The rapid evolution of technology has fundamentally reshaped the way businesses engage with consumers, shifting from traditional marketing methods to highly personalised, interactive digital platforms. Digital marketing, driven by technological innovations and increased internet penetration, enables companies to reach target audiences more efficiently and cost-effectively, offering real-time engagement, precise targeting, and measurable outcomes.
Among these innovations, social media has emerged as a dominant force, transforming the customer journey and redefining communication between businesses and consumers. Recent studies confirm the growing importance of digital marketing tools not only in private but also in public institutions, contributing to improved operational performance and stakeholder engagement (Litovtseva et al. 2022).
Artificial intelligence (AI), as part of this technological landscape, continues to enhance personalisation and automation in marketing processes, allowing businesses to improve customer experience and maintain a competitive edge (Kushwaha, 2020). These tools foster creativity, adaptability, and efficiency, essential qualities for modern marketing teams in an increasingly dynamic digital environment.
Prior research underscores that the success of digital campaigns depends not only on technological adoption but also on employees' ability to integrate strategies into daily operations (Alghizzawi, 2019; Sridevi K. B et al., 2021).
This is particularly relevant in the service sector, where intangible value is created heavily through customer perception, brand presence, and communication channels. Marketing in this sector must therefore adopt adaptable, customer-centred approaches that leverage the interactivity of digital platforms.
Despite the global relevance of digital marketing, its application and perception in the Kosovar service sector remain underexplored. This research addresses that gap by examining how businesses in Kosovo perceive and apply digital marketing tools, particularly social media, and how these perceptions influence measurable outcomes such as customer growth and satisfaction. The study builds upon existing digital marketing frameworks of effectiveness and adoption, contextualising them within the Western Balkan service economy.
The paper is structured as follows: Section 2 provides a review of the relevant literature; Section 3 outlines the research methodology; Section 4 presents the results; Section 5 discusses the findings in the context of existing research; and Section 6 offers conclusions and recommendations for practice and future research.
Given the natural evolution of techniques and technology, marketing has moved from traditional methods to ones that incorporate various technological processes and models. Therefore, we have seen that many studies have used several tools that have significantly enhanced marketing results.
The authors in the paper (Rahardja & Aini, 2025) identify the use of techniques that have a significant impact on awareness, conversion, and protection of marketing campaigns, utilising various statistical methods such as ANOVA and Chi-Square. We note that, using ANOVA and regression tests, no significant differences are observed in the campaign's engagement and conversion levels, whereas the Chi-Square test reveals a strong relationship between the results and the type of campaign. From this, along with the other results presented, we understand that changing the campaign alone is insufficient to improve performance, highlighting the need for better data content and user experience.
Digital marketing (Hadiyati, 2023) as a whole has a wide range of applications that encompass various forms of interaction, such as optimised search for more efficient display, social media marketing, influencer marketing, email marketing, marketing through radio and television, and more (J. R. Saura, P. R. Palos-Sánchez, & B. R. Herráez 2020; Rathore 2021; Sugiharto 2024).
The authors (Goel et al.. 2017), in their work, they highlight the importance of using digital marketing techniques for many parties, including consumers and marketers, compared to the use of traditional media, which are already well-known. They also used questionnaires with a total of 105 respondents to identify the effect of using digital marketing through various methods, such as regression and ANOVA tests using SPSS software. The findings reveal several factors that impact the success of digital marketing, on which marketers increasingly rely for current digital strategies.
In another case studied by the authors (H. A. Kadir, N. Rahmani, & R. Masinae, 2011; A. K. Murti et al., 2023; H. Alizadeh & M. J. Filshour, 2023), services related to the finance sector are analysed, with special emphasis on social media, SEO, and, more recently, email marketing. The paper emphasises the importance of employees having stress management skills and the ability to maintain the privacy of customer data. Through the paper, the authors identify that digital marketing, as an entity, enhances their commitment to increasing brand awareness, protecting revenues generated in that direction, and ultimately providing a practical framework that can be applied.
Overall, the integration of technological tools within digital marketing strategies continues to demonstrate measurable improvements in engagement and performance across sectors. However, the degree of effectiveness varies depending on market maturity and industry context, which highlights the importance of adapting global insights to local realities such as Kosovo's developing service sector.
This is also observed through the work and results obtained by the authors (J. Junaidi et al. 2020), where they present the importance and impact of virtual advertising in conducting electronic business, which is primarily driven by smartphones and internet access.
Every business aims to increase its audience and reach as many people as possible, and to do so, it must be as interactive as possible with its target audience. According to the authors, businesses must undoubtedly adapt current devices and techniques to use digital marketing effectively to reach modern consumers. Similarly, for the financial aspect, the authors have proposed a model in their work (K.R. Mahalaxmi & P. Ranjith 2016), in which they emphasise interactivity through electronic devices that allow them to benefit from large amounts of money. The authors obtained these results through surveys with more than 50 respondents.
Research in sectors such as healthcare, finance, and services demonstrates that digital marketing generates measurable improvements in organisational performance, but the degree of impact depends heavily on the context in which it is implemented (D. Mathur et al., 2019; W. Wisetsri et al., 2021; N. Mariyappan., & G. Sangeetha., 2022; P. Limna et al., 2022; Zh. Sh. Tao et al., 2023). For example, while healthcare organisations primarily use digital campaigns to enhance awareness and trust among patients, financial institutions emphasise data-driven targeting and customer analytics, and service-sector firms focus on personalisation and client retention.
These differences underline that the effectiveness of digital marketing cannot be generalised across industries. Instead, success depends on adapting strategies to each sector's structural and cultural realities. For emerging markets such as Kosovo, these cross-sector insights are particularly valuable, as they provide practical guidance for tailoring digital marketing initiatives to the local service economy, where digital maturity is still developing.
While prior studies across finance, healthcare, and service sectors have collectively demonstrated the growing strategic role of digital marketing, these findings remain context-dependent. Common patterns such as improved customer engagement, measurable ROI, and enhanced brand visibility reveal that digital marketing effectiveness extends beyond industry boundaries.
However, few empirical investigations have examined these dynamics within emerging economies, particularly in Kosovo's service sector, where digital adoption and market maturity differ significantly. This gap underscores the relevance of the present study, which integrates insights from these diverse domains to evaluate how digital marketing influences customer growth in Kosovo.
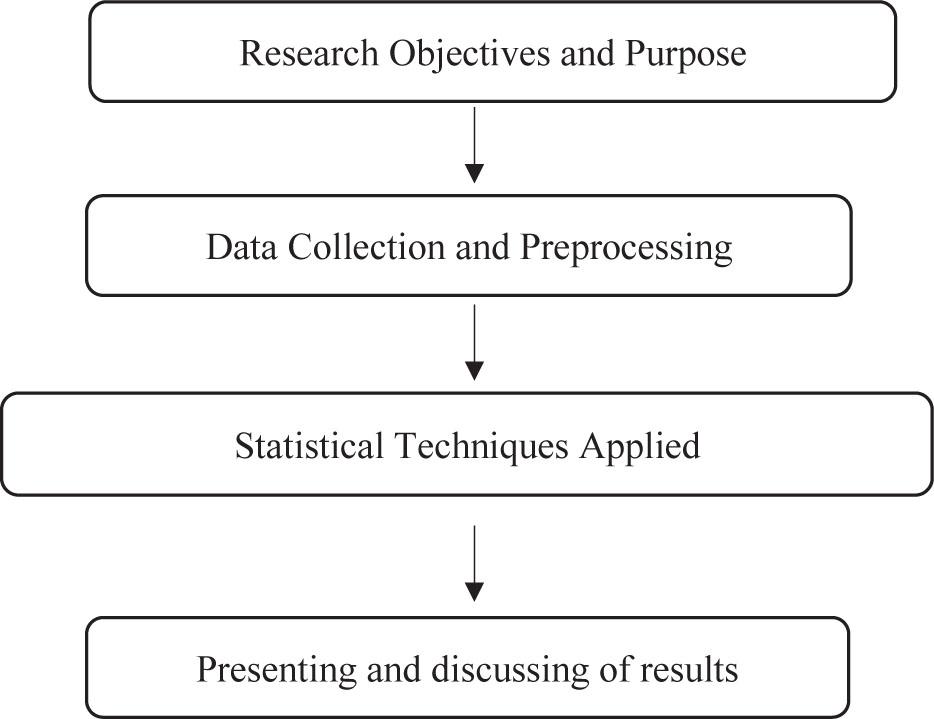
This study adopts a quantitative, descriptive, and empirical research design with the primary objective of analysing the implementation of digital marketing practices within the service sector in Kosovo. The study focuses on understanding how businesses perceive the effectiveness of digital marketing, defined as the perceived ability of digital tools to achieve marketing objectives such as customer acquisition, retention, and brand visibility and how these perceptions relate to customer growth, operationalised as the observed increase in customer engagement, volume, or loyalty over time. The study aims to bridge a gap in the local context by providing statistically grounded insights that can inform both practice and future academic exploration, as shown in Figure 1.
Methodology used in conducting the research
The study employed primary and secondary data sources. Primary data were collected through a structured questionnaire distributed electronically via Google Forms. The survey consisted of three main sections:
Demographic and organisational characteristics;
Perceptions of digital marketing effectiveness and customer growth, and;
Frequency and type of social media use.
All constructs were measured on a five-point Likert scale (1 = strongly disagree, 5 = strongly agree). This structure ensured consistency across responses and enabled statistical analysis of relationships among variables. A total of 101 service-sector businesses in the Republic of Kosovo participated in the study, including micro, small, and medium enterprises operating in hospitality, retail, finance, and health services. Respondents represented a mix of managerial and operational roles, with varying levels of digital marketing experience. This diversity allowed the study to capture a broad range of perceptions about digital marketing practices in Kosovo's service economy.
The sampling approach was non-probabilistic (purposive), focusing on service-oriented businesses already engaged in digital marketing. While this method ensures the inclusion of relevant respondents, it limits the generalizability of results across the entire service sector. It should therefore be interpreted as context-specific rather than representative of all firms in Kosovo. Respondents included decision-makers or marketing staff with relevant knowledge and responsibilities in their respective organisations.
Before statistical analysis, data were screened and cleaned to ensure completeness and reliability. The dataset showed 100% response completion, with no missing values across variables. Therefore, list wise deletion was applied, resulting in no loss of data and enhancing the robustness and consistency of the analysis.
The collected data were analysed using SPSS statistical software, applying the following analytical methods:
Cronbach's Alpha: Used to assess the internal consistency and reliability of the questionnaire items.
Inter-item Correlation Matrix: Applied to explore the strength of relationships between specific survey items.
One-Way ANOVA (Analysis of Variance): Conducted to test for statistically significant differences between groups based on variables such as job position or experience.
Pearson Chi-Square Test: Used to determine whether there is a significant association between categorical variables, particularly the relationship between social media usage and perceived impact on customer growth.
Although ANOVA assumes normality, preliminary tests (Kolmogorov–Smirnov and Shapiro–Wilk) indicated that the data were approximately normally distributed, supporting the validity of the statistical results. Future research could complement the current correlation-based analysis with regression modelling to better capture the predictive relationships between digital marketing effectiveness, social media frequency, and customer growth.
The research followed a systematic, sequential process, as illustrated in Figure 1 below. The process included:
Clearly defining the research objectives and hypotheses.
Reviewing existing literature to identify theoretical gaps.
Developing and distributing the questionnaire to targeted businesses.
Collecting and preprocessing the data.
Applying statistical tests to evaluate reliability, differences, and relationships.
Interpreting the findings in relation to the research questions and existing literature.
This section presents the statistical findings from SPSS analyses of data collected from 101 service-sector businesses in Kosovo.
Before conducting inferential analyses, descriptive statistics were computed to provide an overview of key study variables. The mean perceived effectiveness of digital marketing among respondents was 4.12 (SD = 0.63), indicating a generally positive evaluation. The reported average return on investment (ROI) from digital marketing activities was 3.95 (SD = 0.71), while the mean frequency of social-media use for marketing purposes was 4.32 (SD = 0.58). These results suggest that most businesses actively integrate social media into their promotional strategies and view digital marketing as a valuable investment channel.
Reliability analysis is a statistical method used to evaluate and measure the reliability or stability of a system, device, process, or product. Essentially, it aims to determine how stable and reliable an object or system is in performing its functions without failure over a specified period.
Reliability measures the degree to which an instrument (such as a questionnaire, test, or other measuring tool) produces consistent and dependable results. An instrument is considered reliable if random or irrelevant factors do not influence its results. We chose this analysis for its benefits. It ensures that the measurement results are accurate and consistent. It also increases the validity of the research data and helps identify problems with question wording or the instrument's structure.
The Cronbach's Alpha coefficient of 0.855 indicates high internal consistency, suggesting that the questionnaire items are reliable and accurately measure the intended constructs. This high reliability provides a sound basis for conducting further statistical analyses in this study. In Table 1, we present a summary of case processing in the statistical analysis, including the number and percentage of valid and excluded cases, as well as the techniques applied.
Summary of results
| Case Processing Summary | |||
|---|---|---|---|
| N | % | ||
| Cases | Valid | 101 | 100.0 |
| Excludeda | 0 | 0 | |
| Total | 101 | 100.0 | |
Listwise deletion based on all variables in the procedure.
From this, we see that the number of valid cases (Valid Cases) totals 101, which represents 100% of the data. This indicates that the data used in the analysis do not have missing values for the variables included in the model. As for the excluded cases (Excluded Cases), the results show that none were excluded (N = 0, % = 0.0). This means that no missing values were identified that could have affected the exclusion of any case from the analyses conducted within the framework of this paper. The missingness treatment method uses the so-called Listwise Deletion technique, which means that cases with missing data in any analysed variable are entirely excluded. Our analysis is even more reliable because Listwise Deletion causes data loss when there are missing values, and in our case, this does not pose a problem.
The indicator of 100% valid cases reinforces the reliability and integrity of the dataset for the analysis performed. From this, we understand that since there are no excluded cases, all values for all variables used are complete, and there is no missing data in the dataset.
The data in Table 2 refer to the reliability analysis of a group of six items, in which the internal consistency of the measurement is assessed using Cronbach's Alpha.
Reliability analysis
| Reliability Statistics | ||
|---|---|---|
| Cronbach's Alpha | Cronbach's Alpha Based on Standardised Items | N of Items |
| 0.855 | 0.799 | 6 |
The Cronbach's Alpha value is 0.855, which indicates a high degree of reliability. This means the items in this scale have a strong correlation with one another, indicating considerable consistency in the measurements. In reliability analyses, a value between 0.8 and 0.9 is typically interpreted as very good, indicating that the variables accurately and consistently reflect the concept they are intended to measure.
The value of Cronbach's Alpha based on standardised items is 0.799, which is slightly lower than the first value. This suggests that after standardising the items, although the internal consistency remains high, there is a slight reduction in the correlation between the variables. The difference between the two values may result from heterogeneity in the items or from variation in the measurement scales. The number of items included in the analysis is 6, indicating that Cronbach's Alpha was calculated on a six-item scale. In general, if the number of items is small, the Alpha value can be affected by the number of variables. However, in this case, a value above 0.8 indicates a reliable scale. Based on these data, the reliability measurement indicates high instrument stability, reinforcing the fact that the variables included in the analysis have strong cohesion and are suitable for measuring a common construct.
Correlation analysis revealed significant positive relationships between digital-marketing effectiveness and customer growth (r = 0.61, p < 0.01) and between social-media frequency and ROI (r = 0.54, p < 0.01). These findings indicate that firms perceiving higher digital-marketing effectiveness tend to experience stronger customer growth. Conversely, weaker or insignificant correlations—such as those between marketing budget allocation and perceived ROI—may stem from uneven access to analytics tools, limited staff training, or early-stage digital adoption.
The One-Way ANOVA test compares the means of multiple groups to determine if differences are statistically significant. In this study, ANOVA was applied to assess variations in digital marketing perceptions across business categories. The results presented show that there are no statistically significant differences between the groups for any of the selected questions.
For each question presented in Table 4, we explain summary, all questions analysed with ANOVA show p-values greater than 0.05...mine the F-test values and p-level (Sig.) to assess whether there are significant variations between groups:
“Do you have a defined digital marketing strategy in your company?” The F value is 0.915, and the p-value is 0.437. This means there are no significant differences among the groups regarding this question. Since p > 0.05, we cannot reject the hypothesis that there are no differences between the groups.
“How do you rate the effectiveness of digital marketing in increasing your services compared to traditional marketing?” The F value is 0.273, and the p-value is 0.845. This also shows that there are no significant differences between the different groups. Additionally, since p > 0.05, there is no significant difference between the groups in assessing the effectiveness of digital marketing in this aspect.
“How much impact does digital marketing have on customer growth?” The F value is 0.105, and the p-value is 0.957. This means that there is no significant difference between the groups regarding the impact of digital marketing on customer growth. Here, too, since p > 0.05, it supports the idea that there are no significant variations between the groups.
“How effective do you think digital marketing is in meeting your business goals?” The F value is 0.360, and the p-value is 0.782. Again, there are no significant differences between the groups, as p > 0.05.
“How satisfied are you with the return on investment (ROI) from the digital marketing campaigns you have implemented so far?” The F value is 0.360, and the p-value is 0.782, which is the same as the results of the previous question. So, here too, there are no significant differences between the groups.
“How important do you think the presence of digital marketing is for the success of a business in the service sector?” The F value is 0.628, and the p-value is 0.599. This result also indicates that there are no significant differences between the groups for this question.
“On a scale of 1 to 5, how much impact does digital marketing have on customer growth?” The F value is 0.195, and the p-value is 0.900. This also shows that there is no significant difference between groups in the impact of digital marketing on customer growth.
Matrix of correlative units
| Inter-Item Correlation Matrix | ||||||
|---|---|---|---|---|---|---|
| 5. How do you rate the effectiveness of digital marketing in growing your services compared to traditional marketing? | 6. How much impact does digital marketing have on customer growth? | 14. How satisfied are you with the return on investment (ROI) from the digital marketing campaigns you have implemented so far? | 15. How effective do you think digital marketing is in meeting your business goals? | 16. How important do you think the presence of digital marketing is for the success of a business in the service sector? | 18. On a scale of 1 to 5, how much impact does digital marketing have on customer growth? | |
| 5. How do you rate the effectiveness of digital marketing in growing your services compared to traditional marketing? | 1.00 | 0.45 | 0.50 | 0.55 | 0.40 | 0.48 |
| 6. How much impact does digital marketing have on customer growth? | 0.45 | 1.00 | 0.35 | 0.50 | 0.38 | 0.60 |
| 14. How satisfied are you with the return on investment (ROI) from the digital marketing campaigns you have implemented so far? | 0.50 | 0.35 | 1.00 | 0.65 | 0.42 | 0.40 |
| 15. How effective do you think digital marketing is in meeting your business goals? | 0.55 | 0.50 | 0.65 | 1.00 | 0.45 | 0.50 |
| 16. How important do you think the presence of digital marketing is for the success of a business in the service sector? | 0.40 | 0.38 | 0.42 | 0.45 | 1.00 | 0.48 |
| 18. On a scale of 1 to 5, how much impact does digital marketing have on customer growth? | 0.48 | 0.60 | 0.40 | 0.50 | 0.48 | 1.00 |
Results from the ANOVA test
| ANOVA | ||||||
|---|---|---|---|---|---|---|
| Sum of Squares | df | Mean Square | F | Sig. | ||
| 1. Do you have a defined digital marketing strategy in your company? | Between Groups | 0.371 | 3 | 0.124 | 0.915 | 0.437 |
| Within Groups | 13.095 | 97 | 0.135 | |||
| Total | 13.465 | 100 | ||||
| 5. How do you rate the effectiveness of digital marketing in growing your services compared to traditional marketing? | Between Groups | 1.079 | 3 | 0.360 | 0.273 | 0.845 |
| Within Groups | 127.911 | 97 | 1.319 | |||
| Total | 128.990 | 100 | ||||
| 6. How much impact does digital marketing have on customer growth? | Between Groups | 0.015 | 3 | 0.005 | 0.105 | 0.957 |
| Within Groups | 4.737 | 97 | 0.049 | |||
| Total | 4.752 | 100 | ||||
| 15. How effective do you think digital marketing is in meeting your business goals? | Between Groups | 0.062 | 3 | 0.021 | 0.360 | 0.782 |
| Within Groups | 5.581 | 97 | 0.058 | |||
| Total | 5.644 | 100 | ||||
| 14. How satisfied are you with the return on investment (ROI) from the digital marketing campaigns you have implemented so far? | Between Groups | 0.062 | 3 | 0.021 | 0.360 | 0.782 |
| Within Groups | 5.581 | 97 | 0.058 | |||
| Total | 5.644 | 100 | ||||
| 16. How important do you think the presence of digital marketing is for the success of a business in the service sector? | Between Groups | 0.292 | 3 | 0.097 | 0.628 | 0.599 |
| Within Groups | 15.035 | 97 | 0.155 | |||
| Total | 15.327 | 100 | ||||
| 18. On a scale of 1 to 5, how much impact does digital marketing have on customer growth? | Between Groups | 0.101 | 3 | 0.034 | 0.195 | 0.900 |
| Within Groups | 16.691 | 97 | 0.172 | |||
| Total | 16.792 | 100 | ||||
Overall, ANOVA results confirm that perceptions of digital marketing effectiveness are homogeneous, aligning with prior findings that organisational culture, rather than role or experience, drives adoption consistency (Mariyappan, N. and Sangeetha, G., 2022; Zhao Shi Tao et al., 2023),
The Chi-Square test was used to examine associations between social media usage and the perceived impact of digital marketing. The results confirmed a significant relationship (p < 0.05), indicating that greater social media activity is associated with more substantial perceived effectiveness. This suggests that the data are complete and that there will be no missing values when performing the Chi-Square analysis. In this case, the absence of missing values makes the analysis more reliable and allows for more accurate conclusions.
Table 6 presents the cross tabulation technique, which generates results for the frequency distribution analysis of the two questions: “How often do you use social media to promote your services?” and “How much impact does digital marketing have on customer growth?”. The table shows how the frequency of using social media to promote services is related to the perception of the impact of digital marketing on customer growth.
Summary of case processing
| Case Processing Summary | ||||||
|---|---|---|---|---|---|---|
| Cases | ||||||
| Valid | Missing | Total | ||||
| N | Percent | N | Percent | N | Percent | |
| 3. How often do you use social media to promote your services? * 6. How much impact does digital marketing have on customer growth? | 101 | 100% | 0 | 0.0% | 101 | 100% |
The data presented in Table 5 are suitable for Chi-Square analysis
The connection between service promotion and digital marketing through the intersection technique
| 3. How often do you use social media to promote your services? * 6. How much impact does digital marketing have on customer growth? Cross tabulation | |||||
|---|---|---|---|---|---|
| 6. How much impact does digital marketing have on customer growth? | Total | ||||
| 3.0 | 4.0 | ||||
| 3. How often do you use social media to promote your services? | 1.0 | Count | 1 | 62 | 63 |
| Expected Count | 3.1 | 59.9 | 63.0 | ||
| 2.0 | Count | 2 | 21 | 23 | |
| Expected Count | 1.1 | 21.9 | 23.0 | ||
| 3.0 | Count | 0 | 6 | 6 | |
| Expected Count | 0.3 | 5.7 | 6.0 | ||
| 4.0 | Count | 2 | 7 | 9 | |
| Expected Count | 0.4 | 8.6 | 9.0 | ||
| Total | Count | 5 | 96 | 101 | |
| Expected Count | 5.0 | 96.0 | 101.0 | ||
Two variables are presented in the table:
Social media usage (3.0), with four levels: 1.0 (often), 2.0 (average), 3.0 (rarely), and 4.0 (never).
Digital marketing impact on customer growth (6.0), with two levels: 3.0 (weak impact) and 4.0 (strong impact).
Meanwhile, the main results that can be drawn from this table are as follows:
Social media use and the weak impact of digital marketing (3.0):
1 individual who uses social media frequently (1.0) reported weak influence (3.0).
2 individuals who use social media moderately (2.0) reported weak influence (3.0).
0 individuals who rarely use social media (3.0) reported weak influence.
2 individuals who do not use social media at all (4.0) reported weak influence (3.0).
The use of social media and the strong impact of digital marketing (4.0):
62 individuals who use social media frequently (1.0) reported strong influence (4.0).
21 individuals who use social media moderately (2.0) reported strong influence (4.0).
6 individuals who rarely use social media (3.0) reported strong influence (4.0).
7 individuals who do not use social media at all (4.0) reported strong influence (4.0).
While we see that a significant number of individuals use social media frequently and report a strong impact of digital marketing on customer growth, this may indicate that social media use is associated with positive perceptions of digital marketing's impact on customer growth. On the other hand, users who do not use social media frequently (especially those who use it rarely or not at all) seem to report a weaker impact of digital marketing on customer growth.
The “Expected Count” values suggest that there is no significant difference in the number of individuals between groups, as the actual data is quite close to the expected values. This indicates that the distribution of cases is quite balanced. Ultimately, this analysis suggests a link between social media use and perceptions of the impact of digital marketing on customer growth, with social media users often reporting a stronger perception of its positive impact.
The results of the Chi-Square test presented in Table 7 show the analysis of the distribution of the two variables “Use of social media for promotion” and “Impact of digital marketing on customer growth”, which are explained as follows:
Chi-Square test
| Chi-Square Tests | |||
|---|---|---|---|
| Value | df | Asymptotic Significance (2-sided) | |
| Pearson Chi-Square | 8.218a | 3 | 0.042 |
| Likelihood Ratio | 6.410 | 3 | 0.09 |
| Linear-by-Linear Association | 5.688 | 1 | 0.017 |
| N of Valid Cases | 101 | ||
Pearson's Chi-Square is presented in our case with a value of 8.218 and 3 degrees of freedom (df). The Asymptotic Significance (2-sided) is 0.042.
This result is statistically significant (p < 0.05) and indicates a significant relationship between social media use and the perception of the impact of digital marketing on customer growth. This means that social media use is related to how individuals perceive the impact of digital marketing.
The other technique used in this test is the Likelihood Ratio, which yields a value of 6.410 with 3 degrees of freedom (df), and the Asymptotic Significance is 0.093. This p-value of 0.093 is greater than 0.05, which means that there is no statistically significant relationship according to this test. So, unlike Pearson's Chi-Square test, this test does not support the idea that social media use has a significant impact on the perception of the impact of digital marketing.
While for Linear-by-Linear Association, the obtained value is 5.688 with 1 degree of freedom, and the Asymptotic Significance is 0.017. This result is also statistically significant, as the p-value is < 0.05, suggesting a significant linear relationship between the two variables. This shows that as social media use increases, so does the perception of digital marketing's impact. In conclusion, the Chi-Square tests suggest a relationship between social media use and perceptions of the impact of digital marketing.
The findings from this study offer several insights into perceptions and applications of digital marketing in Kosovo's service sector. Overall, businesses demonstrate strong, consistent recognition of the value of digital marketing, particularly in terms of customer growth, brand visibility, and ROI.
The high Cronbach's Alpha coefficient (0.855) confirms the instrument's internal consistency and supports the credibility of subsequent statistical analyses. These findings align with prior studies that emphasise the need for valid and reliable instruments when assessing digital marketing performance (Richa Goel et al., 2017; J. R. Saura, P. R. Palos-Sánchez, & B. R. Herráez, 2020).
The ANOVA results, which showed no statistically significant differences across groups, suggest that perceptions of digital marketing are shared broadly, regardless of employees' roles or experience levels. This finding is important—it implies a general organisational acceptance and integration of digital marketing tools across all business functions. This homogeneity also reflects trends in the literature, where successful adoption is shown to depend on collective capability and institutional mind-set rather than individual role (Untung Rahardja & Qurotul Aini, 2025).
Most notably, the Chi-Square test confirms a positive correlation between the frequency of social media usage and the perceived effectiveness of digital marketing. This aligns with the findings of (Alghizzawi, 2019) and (A. K. Murti et al., 2023), who emphasise that higher exposure to digital platforms enhances businesses' ability to reach, convert, and retain customers. In our study, those who frequently use social media reported stronger belief in digital marketing's ability to drive customer growth.
These findings respond directly to the study's research questions by demonstrating that:
Businesses perceive digital marketing as effective and reliable, particularly in comparison to traditional methods.
Social media plays a significant role in shaping these perceptions and enhancing marketing outcomes.
These perceptions are consistent across business types, suggesting a maturing understanding and integration of digital marketing in the local service economy.
In light of these findings, the study supports the argument that digital marketing is not merely a trend but a strategic necessity, even in emerging markets such as Kosovo. However, the data also suggest that businesses using digital platforms sporadically tend to report weaker perceived results, emphasising the need for more structured and frequent engagement with digital tools.
Furthermore, compared with studies conducted in more digitally mature markets such as Thailand, China, and India (W. Wisetsri et al., 2021; N. Mariyappan, & G. Sangeetha, 2022; Zh. Sh. Tao et al., 2023), the correlations observed in Kosovo are moderate rather than strong. This difference can be attributed to variations in digital infrastructure, data analytics capacity, and the availability of skilled marketing personnel. Such contextual differences highlight that while digital marketing is effective in Kosovo, its full potential depends on organisational readiness and investment in analytics and training. These findings, therefore, contribute new empirical evidence from the Western Balkans - an under-represented region in the digital marketing literature - and reinforce the importance of adapting international models to local market realities.
This study investigated the implementation and perception of digital marketing practices in the service sector in Kosovo, with a particular focus on the role of social media. The research findings, based on quantitative data collected from 101 businesses and analysed using statistical techniques such as Cronbach's Alpha, ANOVA, and Chi-Square tests, reveal a consistent, positive perception of digital marketing across enterprises, regardless of organisational position or experience level.
The results demonstrated that businesses that frequently utilise social media perceive digital marketing to have a stronger impact on customer growth and business success. This statistically significant association underscores the importance of social media as a strategic tool in today's marketing landscape. Moreover, the overall reliability of the data and the consistency of responses suggest a maturing understanding and integration of digital tools in the local market.
Based on these findings, service-sector businesses in Kosovo are encouraged to adopt structured digital marketing strategies with measurable performance indicators. This includes setting clear ROI benchmarks, investing in staff training in social media analytics, and implementing customer feedback loops to continuously improve engagement. Policymakers could further support such initiatives by implementing targeted digital upskilling programs and incentivising innovation in marketing practices. Training and capacity building in digital tools, data analytics, and content creation are also vital to increasing effectiveness. Additionally, developing performance indicators and regularly evaluating digital efforts can help organisations make data-informed decisions.
While this study provides valuable insights, it is limited to a specific geographic and sectoral context. Future research could expand the scope by including different industries or combining quantitative and qualitative methods to gain deeper insights into customer behaviour and organisational adaptation to digital change.
In conclusion, digital marketing - especially through social media - emerges not only as a necessary adaptation to technological trends but also as a critical enabler of growth and competitiveness in the service economy. Businesses that embrace these tools strategically are more likely to sustain relevance and achieve measurable outcomes in a rapidly evolving digital environment.