

Table 1.
Social media platforms (as of July 2024)
| Social Media | Monthly Users (Millions) | Core Function | Country of Origin |
|---|---|---|---|
| 3,065 | General social networking | United States | |
| YouTube | 2,504 | Video sharing and streaming | United States |
| 2,000 | Photo and story sharing | United States | |
| 2,780 | Messaging and calling | United States | |
| TikTok | 2,048 | Short video content | China |
| 1,343 | Messaging, payments, social feed | China | |
| 554 | Instant messaging | China | |
| Messenger | 1,010 | Text and media messaging | United States |
[ii] 1. DataReportal. (2024). Digital 2024: Global Overview Report. We Are Social & Meltwater. Retrieved from https://datareportal.com/reports/digital-2024-global-overview-report
[iii] 2. Meta Platforms, Inc. (2024). Q1 2024 Earnings Report. Retrieved from https://investor.fb.com/
[iv] 3. Tencent Holdings Ltd. (2024). First Quarter 2024 Financial Results. Retrieved from https://www.tencent.com/en-us/investors.html
[v] 4. Statista. (2024). Most popular social networks worldwide as of July 2024, ranked by number of monthly active users (in millions). Retrieved from https://www.statista.com/statistics/272014/global-social-networks-ranked-by-number-of-users/In

Figure 1.
Applied research framework
Table 2.
9-question quality assessment checklist
| Criterion | Description | Yes | No |
|---|---|---|---|
| Relevance | Does the study address the research questions? | ||
| Is the study’s focus aligned with the aims of our Review? | |||
| Rigor | Is the study design appropriate for the research question? | ||
| Is the sample size adequate? | |||
| Are the data collection and analysis methods robust? | |||
| Validity | Do the data support the findings? | ||
| Are the measurement instruments used appropriate and validated? | |||
| Bias | Is there a risk of publication bias? | ||
| Are there any conflicts of interest disclosed? |
Table 3.
Summary of the data extraction stage
| Search Query / Data Source / Step | Scopus | WOS | ProQuest | Scholar | ||||
|---|---|---|---|---|---|---|---|---|
| I | II | I | II | I | II | I | II | |
| ‘psychological | psychosocial impact’ + ‘COVID-19 | pandemic | quarantine’ + ‘impact’ + ‘society | population’ + ‘social media’ + ‘health | well-being’ | 39 | 5 | 1 | 1 | 2 | 1 | 27 | 8 |
| ‘psychological | psychosocial influence’ + ‘COVID-19 | pandemic | quarantine’ + ‘influence’ + ‘society | population’ + ‘social media’ + ‘health | well-being’ | 0 | 0 | 0 | 0 | 0 | 0 | 9 | 9 |
| ‘psychological | psychosocial effect’ + ‘COVID19 | pandemic | quarantine’ + ‘effect on society’ + ‘social media’ + ‘health | well-being’ | 0 | 0 | 0 | 0 | 0 | 0 | 1 | 1 |
| ‘psychological impact of pandemic’ + ‘society | community’ + ‘social media use’ | 0 | 0 | 1 | 1 | 0 | 0 | 4 | 2 |
| Total | 39 | 5 | 2 | 2 | 2 | 1 | 41 | 20 |
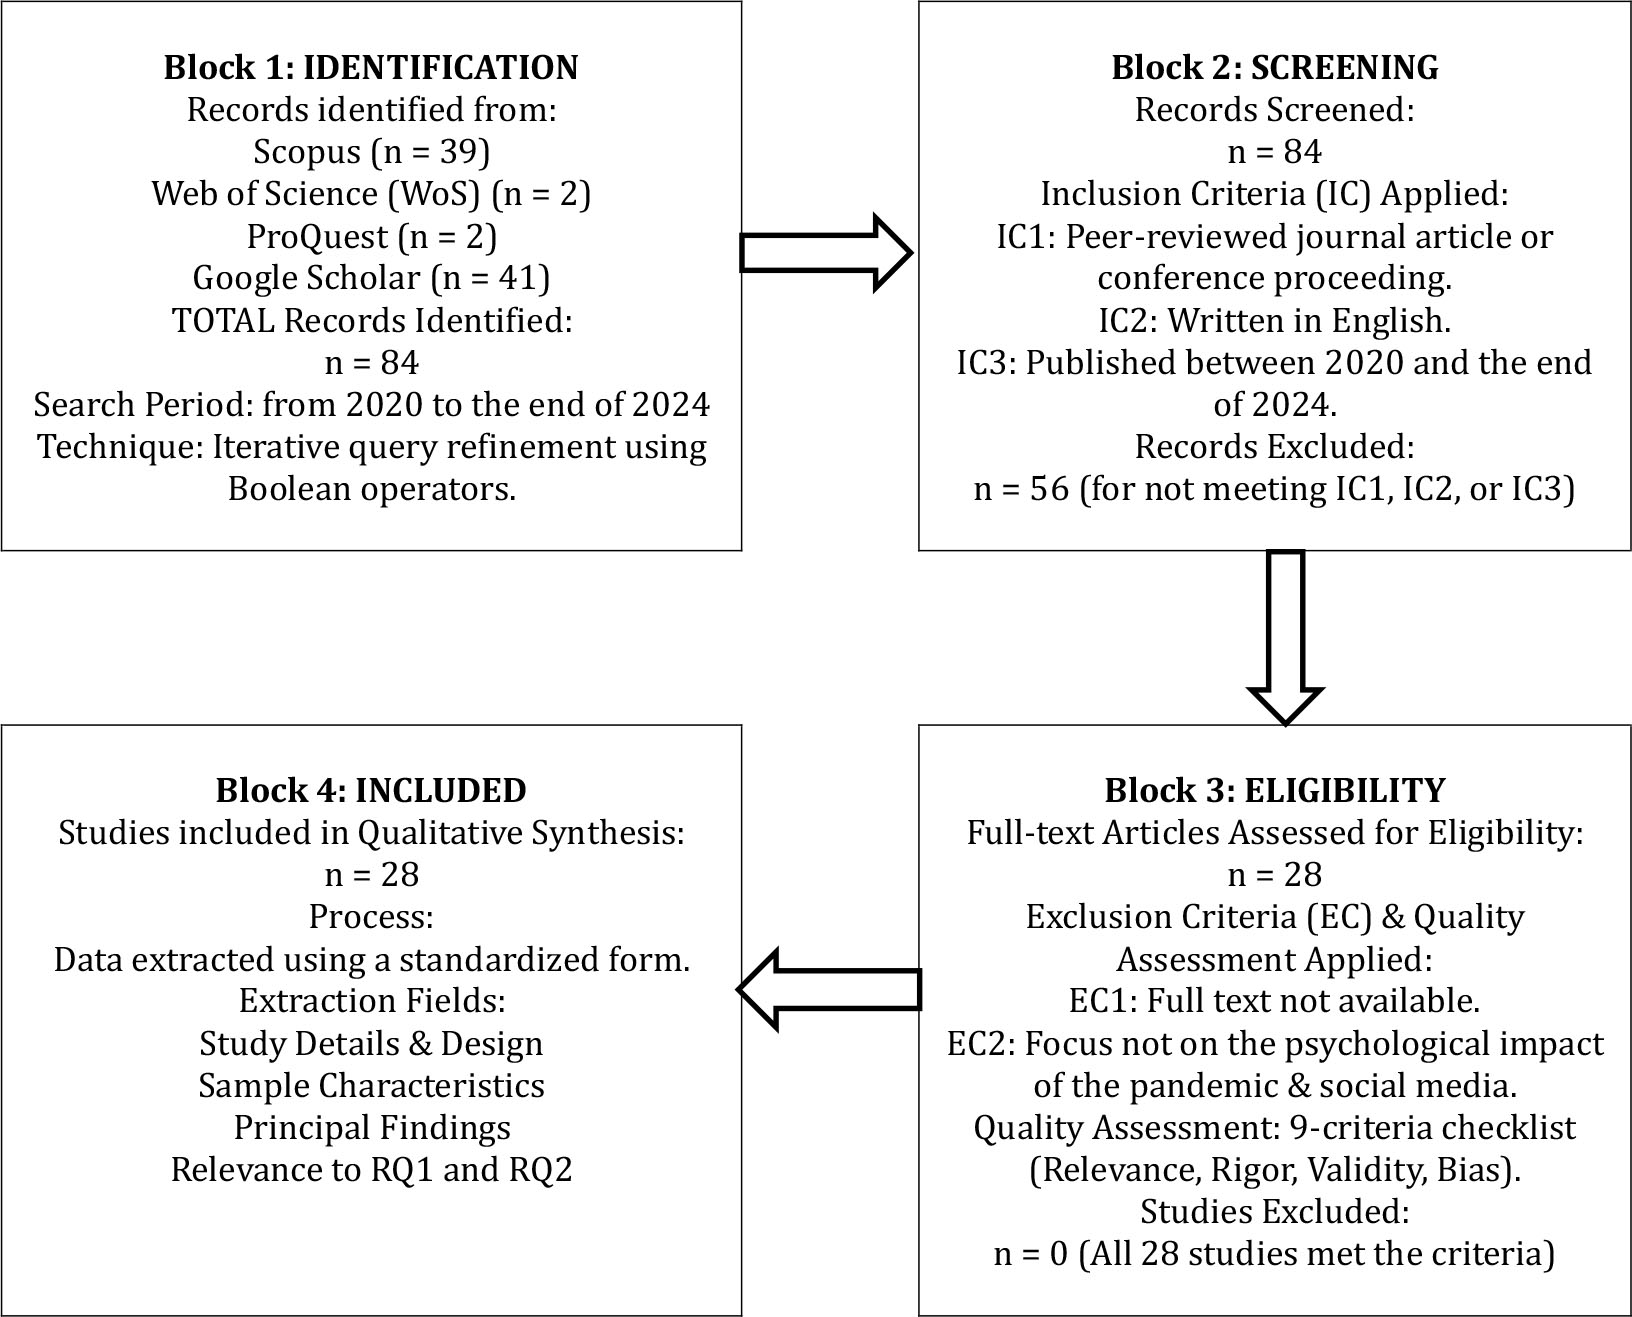
Figure 2.
(PRISMA 2020 Flow Diagram). PRISMA 2020 Procedure illustrating the reviewed papers’ choice based on Moher et al. (2010) and Alk et al. (2024)
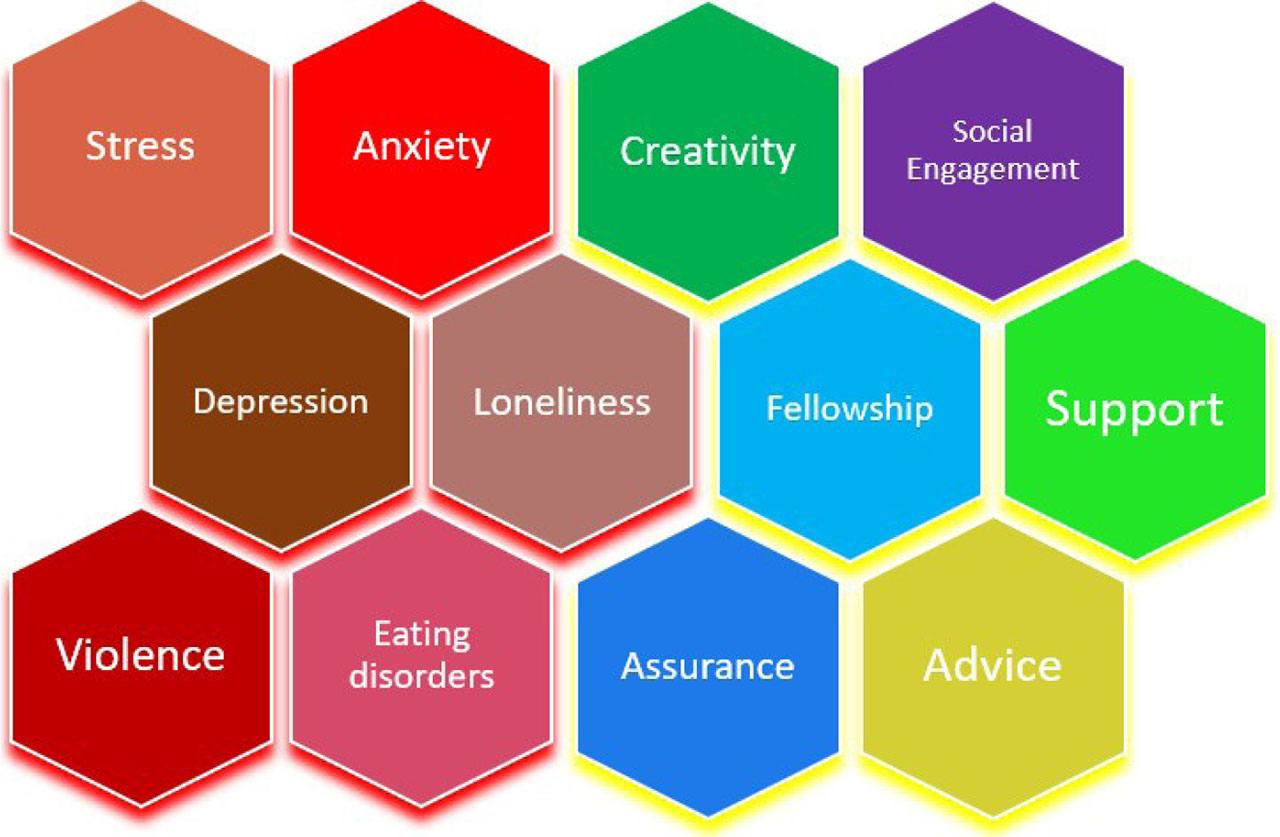
Figure 3.
Feelings and emotions related to using social media during the pandemic