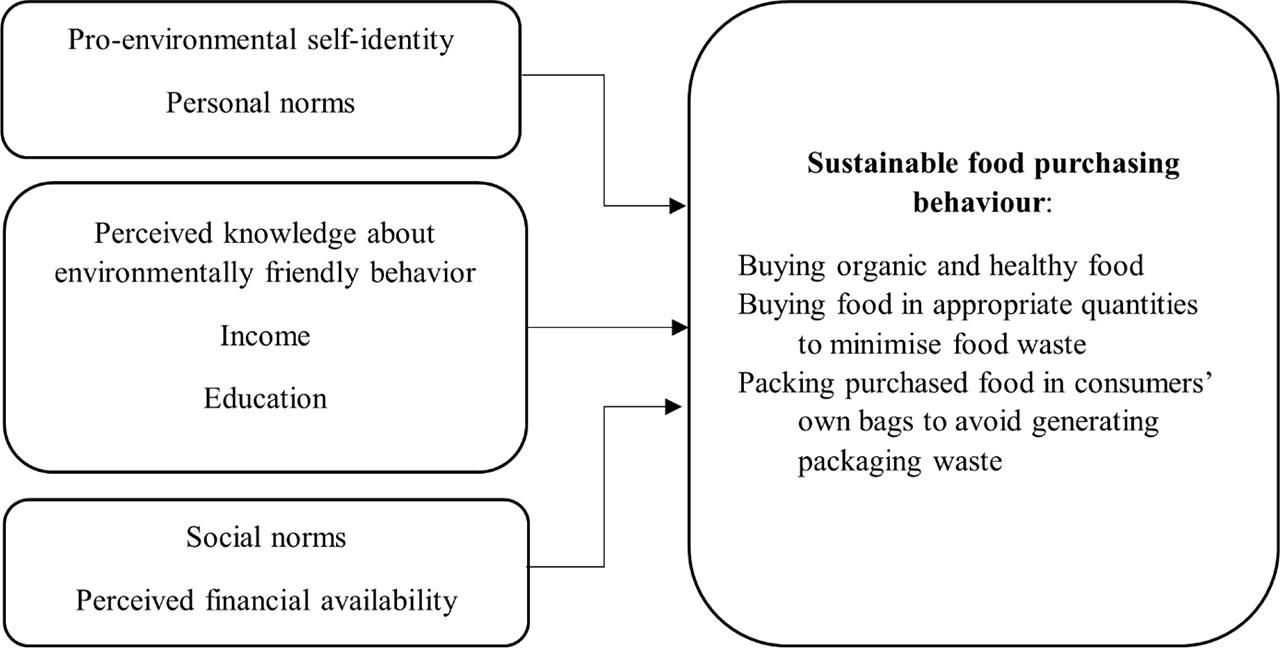
Figure 1.

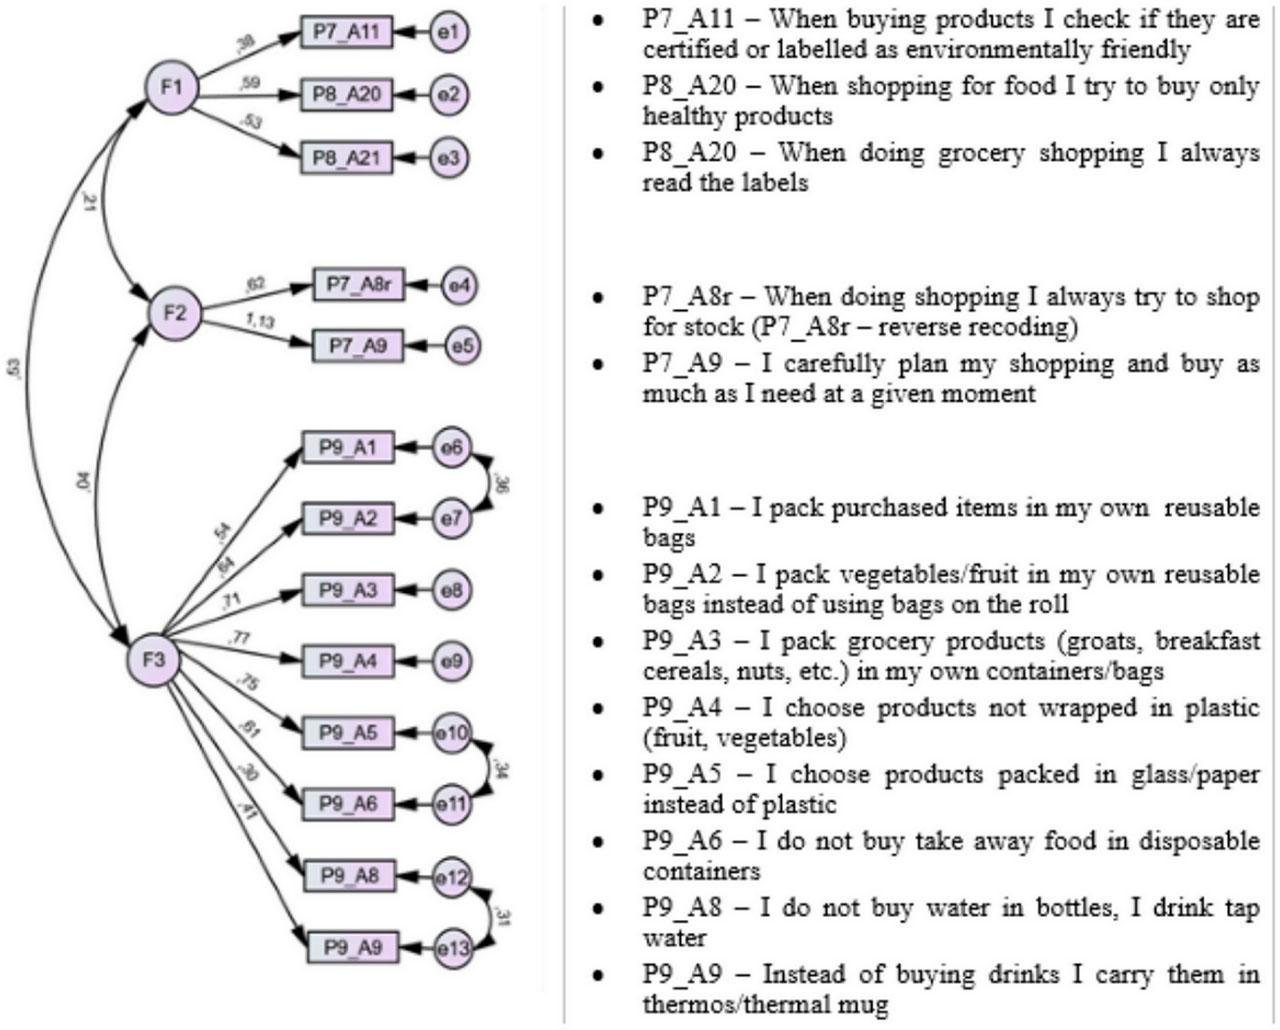
Figure 2.

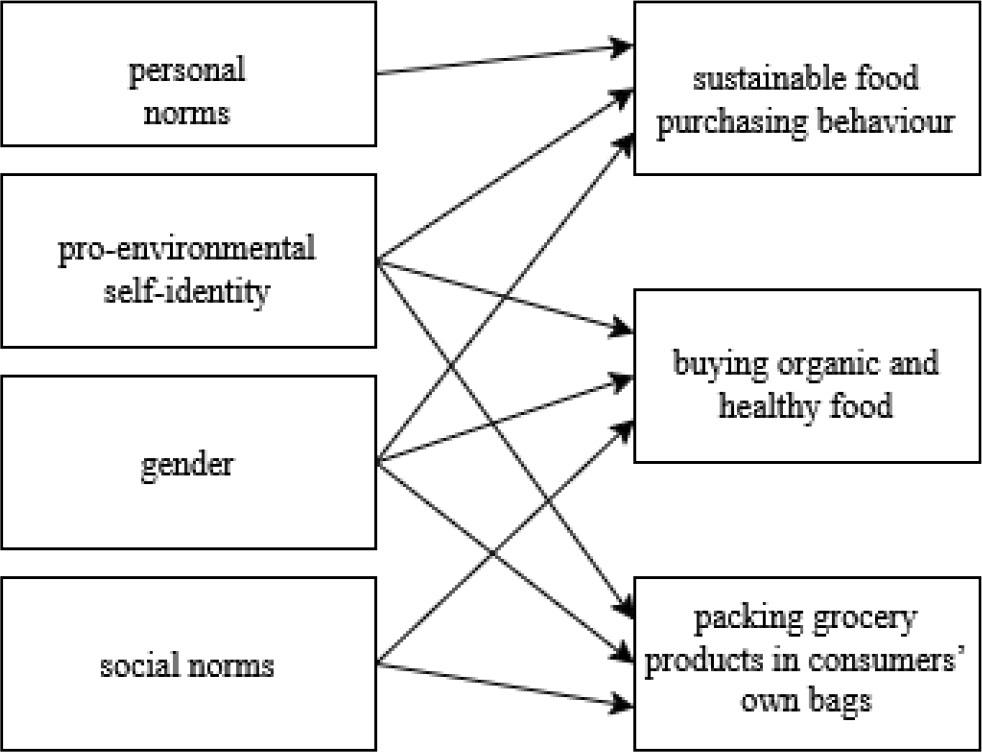
Figure 3.

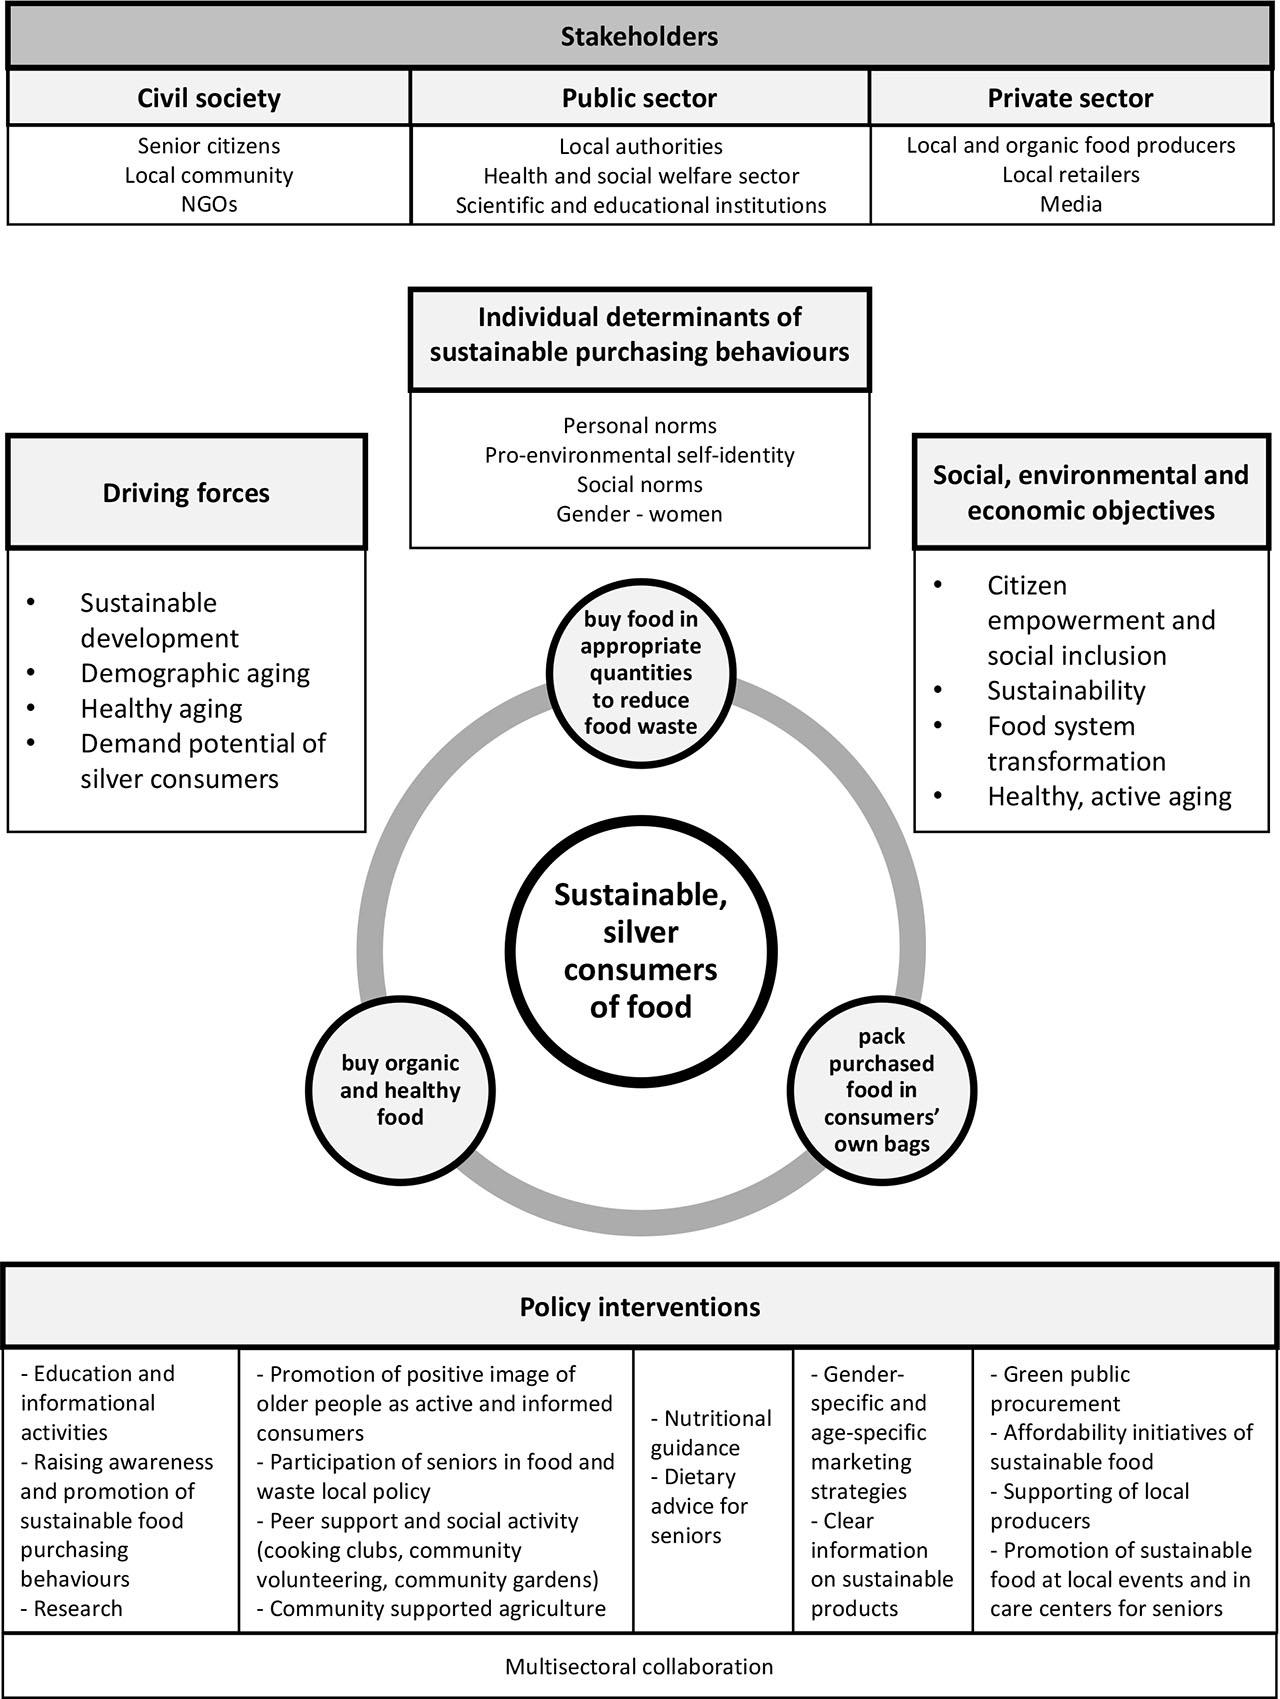
Figure 4.

Determinants of sustainable food purchasing behaviour of people aged 55+ – linear regression results
| B | Beta | t | p | VIF | ANOVA | R2 | |
|---|---|---|---|---|---|---|---|
| Dependent variable: SFPB (model 1) | |||||||
| Const | 1.411 | 12.287 | <0.001** | F(3; 397) = 26.11 | 0.165 | ||
| PN | 0.043 | 0.222 | 3.581 | <0.001** | 1.828 | ||
| PESI | 0.053 | 0.173 | 2.810 | 0.005** | 1.804 | ||
| Gender | 0.104 | 0.139 | 2.986 | 0.003** | 1.026 | ||
| Dependent variable: F1 (model 2) | |||||||
| Const | 1.014 | 5.944 | <0.001** | F(4; 397) = 22.29 | 0.144 | ||
| SN | 0.084 | 0.232 | 3.947 | <0.001** | 1.614 | ||
| PESI | 0.058 | 0.148 | 2.522 | 0.012** | 1.603 | ||
| Gender | 0.117 | 0.108 | 2.281 | 0.023** | 1.038 | ||
| Dependent variable: F3 (model 3) | |||||||
| Const | 1.407 | 9.542 | <0.001** | F(1; 397) = 18.29 | 0.121 | ||
| SN | 0.069 | 0.198 | 3.306 | 0.001** | 1.613 | ||
| PESI | 0.113 | 0.149 | 2.503 | 0.013** | 1.603 | ||
| Gender | 0.058 | 0.118 | 2.494 | 0.013** | 1.019 | ||
Sustainable food purchasing behaviour by income (PLN)
| Scale | 2000 or lower | 2001–3000 | 3001–4000 | over 4000 | F(df) | p | Commentsa | ||||
|---|---|---|---|---|---|---|---|---|---|---|---|
| M | SD | M | SD | M | SD | M | SD | ||||
| F1 | 2.10 | 0.51 | 2.21 | 0.44 | 2.14 | 0.44 | 2.29 | 0.21 | F(3; 150) = 2.621 | 0.053b | X |
| F2 | 2.38 | 0.68 | 2.61 | 0.72 | 2.55 | 0.72 | 2.06 | 0.56 | F(3; 397) = 3.957 | 0.008** | 2000 or lower < 2001–3000 (p = 0.034) |
| F3 | 2.43 | 0.49 | 2.43 | 0.45 | 2.36 | 0.48 | 2.19 | 0.38 | F(3; 397) = 0.890 | 0.446 | X |
| SFPB | 2.35 | 0.38 | 2.41 | 0.34 | 2.34 | 0.38 | 2.19 | 0.29 | F(3; 397) = 1.275 | 0.282 | X |
Constructs, items, and references
| Construct | Items | Scale | References |
|---|---|---|---|
| Pro-environmental self-identity (PESI) |
| scale of 1 to 5, where: 1 - definitely not, 2 - not, 3 - partially 4 - yes, 5 - definitely yes | (Whitmarsh & O'Neill, 2010) |
| Personal norms (PN) |
| scale of 1 to 5, where: 1 - definitely not, 2 - not, 3 - partially 4 - yes, 5 - definitely yes | (Park & Ha, 2012) |
| Social norms (SN) |
| scale of 1 to 5, where: 1 - definitely not, 2 - not, 3 - partially 4 - yes, 5 - definitely yes | (Park & Ha, 2012) (Rausch & Kopplin, 2021) |
| Perceived knowledge of environmentally friendly behaviour (PK) | I know how to reduce the negative environmental consequences of my behaviour | scale of 1 to 5, where: 1 - definitely not, 2 - not, 3 - partially 4 - yes, 5 - definitely yes | (Whitmarsh & O'Neill, 2010) (Rausch & Kopplin, 2021) |
| Perceived financial availability of organic food (PFA) | - In my opinion, organic food is more expensive than other products | scale of 1 to 4, where: 1 - definitely not, 2 - rather not, 3 - rather yes, 4 - definitely yes | (Rausch & Kopplin, 2021) |
Sample structure
| Variable | N | % | |
|---|---|---|---|
| Gender | Men | 171 | 42.6 |
| Women | 230 | 57.4 | |
| Age | 55–59 | 88 | 21.9 |
| 60–64 | 82 | 20.4 | |
| 65–74 | 144 | 35.9 | |
| 75–84 | 61 | 15.2 | |
| 85+ | 26 | 6.5 | |
| Education | Primary | 25 | 6.2 |
| Basic vocational | 82 | 20.4 | |
| Secondary | 214 | 53.4 | |
| Higher Bachelor/engineer | 27 | 6.7 | |
| Higher master's degree | 53 | 13.2 | |
| Income | 2000 PLN or lower | 246 | 61.3 |
| 2001–3000 PLN | 115 | 28.7 | |
| 3001–4000 PLN | 32 | 8.0 | |
| over 4000 PLN | 8 | 2.0 |
Pearson's correlation between sustainable food purchasing behaviour and its determinants
| PN | SN | PK | PESI | PFA | ||
|---|---|---|---|---|---|---|
| F1 | R | 0.323 | 0.340 | 0.283 | 0.303 | −0.002 |
| p | <0.001** | <0.001** | <0.001** | <0.001** | 0.964 | |
| F2 | R | 0,093 | 0,026 | 0,013 | 0,081 | 0.050 |
| p | 0,062 | 0,601 | 0,794 | 0,107 | 0.315 | |
| F3 | R | 0.300 | 0.305 | 0.265 | 0.283 | 0.056 |
| p | <0.001** | <0.001** | <0.001** | <0.001** | 0.262 | |
| SFPB | R | 0.360 | 0.349 | 0.297 | 0.336 | 0.058 |
| p | <0.001** | <0.001** | <0.001** | <0.001** | 0.247 |
Descriptive statistics – sustainable food purchasing behaviour and its determinants
| Statistics | F1 | F2 | F3 | SFPB | PN | SN | PK | PESI | PFA |
|---|---|---|---|---|---|---|---|---|---|
| Min | 1.00 | 1.00 | 1.13 | 1.38 | 10.00 | 6.00 | 3.00 | 6.00 | 1.00 |
| Max | 3.67 | 4.00 | 3.88 | 3.69 | 12.00 | 8.00 | 4.00 | 8.00 | 4.00 |
| M | 2.14 | 2.45 | 2.42 | 2.36 | 11.49 | 7.43 | 3.82 | 7.48 | 2.95 |
| Me | 2.00 | 2.50 | 2.38 | 2.38 | 12.00 | 8.00 | 4.00 | 8.00 | 3.00 |
| SD | 0.48 | 0.70 | 0.47 | 0.37 | 1.92 | 1.35 | 0.68 | 1.21 | 0.75 |
| S | −0.31 | 0.09 | 0.09 | −0.01 | −0.04 | −0.05 | −0.09 | −0.03 | −0.42 |
| K | 0.39 | −0.36 | −0.35 | 0.13 | −0.30 | −0.38 | −0.24 | −0.02 | −0.02 |
Sustainable food purchasing behaviour by gender
| Scale | Men | Women | F(df) | P | ||
|---|---|---|---|---|---|---|
| M | SD | M | SD | |||
| F1 | 2.05 | 0.43 | 2.21 | 0.51 | F(1; 393.2) = 12.094a | 0.001** |
| F2 | 2.41 | 0.69 | 2.48 | 0.70 | F(1; 399) = 1.234 | 0.267 |
| F3 | 2.33 | 0.47 | 2.49 | 0.47 | F(1; 399) = 10.602 | 0.001** |
| SFPB | 2.28 | 0.34 | 2.42 | 0.38 | F(1; 399) = 15.361 | <0.001** |
