

Over recent decades, advancements in labour-saving technologies have ignited fears about large-scale job displacements, originating from its ability to automate an increasing number of tasks (Acemoglu & Restrepo, 2019a, 2020). The primary concerns regarded industrial robots and automation and solely touched on repetitive and routine manual tasks. Hence, the impacts of robot adoption were concentrated mostly in the manufacturing sector and influenced the rest of the economy by second-order effects (D. Autor & Salomons, 2018). However, the emergence of new, IT-related technologies like machine learning (ML), artificial intelligence (AI), and Generative Pre-trained Transformers (GPTs) may lead to far more complicated relationships. AI, with its general-purpose technology characteristics and ability to automate non-routine cognitive tasks, also has the potential to affect every sector of the economy (Lane & Saint-Martin, 2021).
From a theoretical point of view, an association between AI and workers’ wages is unclear. On the one hand, AI has the potential to be a substitute for labour. According to economic theory, it should exert negative pressure on workers’ wages as the demand for human work decreases. On the other hand, AI may complement workers taking care of repetitive and noncomplicated tasks, shifting humans’ attention toward more challenging activities. In turn, it could boost productivity and result in higher wages. This paper aims to describe the relationships between AI and employment and workers’ wages across European countries and answer whether AI tends to complement or substitute human labour.
AI is a general-purpose technology not connected to a particular type of physical device, specific application, or sector (Brynjolfsson & McAfee, 2014). The multitude of potential applications makes quantifying potential exposure to AI a non-trivial task. Therefore, one of the literature strands concerns the measurement and quantification of the potential influence of new technology on human labour. The AI measures developed so far employ a task-approach, initially proposed by Acemoglu and Autor (2011). They compare the tasks performed by workers in particular occupations, assess the importance of skills required in these occupations, and compare them with AI potential. Webb (2020) focuses on worker tasks and develops exposure measures for robots, computer software, and AI. He employs natural language processing to quantify the overlap between human tasks described in the occupational O*NET database and the capabilities of the technology described in patents. Felten et al. (2018) employ an ability-based approach. They use the Electronic Frontier Foundation (EFF) AI Progress Measurement dataset to assess the progress pace at different categories of AI advancements. Then they map the AI categories to the list of skills that the O*NET database uses to describe occupations. Next, they quantify the potential effect of the AI on occupations taking into account the importance of particular skills in performing each job. Frey and Osborne (2017) create a computerisation probability measure based on expert judgements and an assignment algorithm. Brynjolfsson and Mitchell (2017) and Brynjolfsson et al. (2018) develop a measure of suitability of different work activities to ML. Then they calculate ML exposure score for tasks and occupations.
The literature concerning impacts of technology advancements on employment and wages was greatly influenced by the works of Acemoglu and Restrepo (2018, 2019). They provided a conceptual task-based framework in which automation acts as the capital and takes over tasks so far performed by a labourer. If task production with capital input is cheaper than that of labour, then automation will lead to a displacement effect, which in turn puts negative pressure on wages and employment. However, there are other effects of automation, which may counterbalance displacement effects. First, reinstatement effect may lead to extension of already performed tasks or creation of completely new, more complex tasks in which labourers have a comparative advantage (Acemoglu & Restrepo, 2019a). Autor et al. (2022) show that the majority of current employment is in the new jobs, and so far augmentation effects of technological innovations prevail. However, in recent decades demand-eroding effects of automation intensified compared to demand-increasing effects of augmentation innovations. Second, the productivity effect may increase the demand for tasks that cannot be automated. Hence, even if increasing share of tasks is automated, increasing demand may counterbalance the displacement effect (D. Autor & Salomons, 2018; Goos et al., 2014). Third, new technologies may improve existing ones instead of displacing labour. Thus, it should lead to the productivity effect instead of the displacement effect.
So far, the vast majority of evidence on automation is limited to the impact of industrial robots on labour markets. Overall, robot adoption decreased employment and wages in the US commuting zones and contributed to increased wage inequality (Acemoglu & Restrepo, 2019b, 2022). The demand for low- and mid-skilled labour decreased leading to negative wage pressure among these workers (Acemoglu et al., 2023; Acemoglu & Restrepo, 2022; D. H. Autor et al., 2006; DeCanio, 2016) and resulted in labour market polarisation (Goos et al., 2014, 2014). However, robot adoption induced a positive productivity shock and ripple effects. Automation elevated total factor productivity (TFP), real value-added, and aggregate demand (D. Autor & Salomons, 2018; Graetz & Michaels, 2018; Gregory et al., 2022). The total impacts of robot adoption on the economy remains positive. The other stream of the literature relates to information and communication technology (ICT) investments, e.g., the adoption of ICT technologies led to a decrease in employment and wage bills of older women and prime-aged men in European countries (Albinowski & Lewandowski, 2024). Jerbashian (2021) showed that a decrease in IT equipment prices increased demand for high wage occupations and reduced demand for medium wage occupations. Michaels et al. (2014) showed that ICT exposure led to shift in demand for highly educated workers from middle educated workers, resulting in market polarisation.
Nonetheless, industrial robots may be employed in a relatively small range of industries, located mainly in the manufacturing sector (e.g. automotive industry, electronics). It is unknown if its impacts on the economy may be generalised to other sectors and technologies. Yet, there is little evidence of AI’s impact on the economy per se, as this technology is relatively new. Acemoglu (2021a, 2021b) claims that AI advancements may be the next phase of automation and may further depress wages and labour share. Excessive investment in AI may lead to non-market negative externalities, as firms aiming to reduce labour costs do not consider the negative impact of automation on workers, e.g., workers being forced to take up lower-paid jobs or technological unemployment (Growiec, 2023). However, foregoing research on AI impacts on labour market is optimistic. Fossen et al. (2022) found a positive association between AI and workers’ wage changes in services in the US. The authors claim that productivity effects and task enhancement counterbalanced the displacement effect. Fossen et al. (2022) found that AI relates to improved job stability and wage growth, but the association is heterogeneous. Engberg et al. (2023) found that wage growth premia associated with AI exposure with contrasting wage growth penalties related to robot exposure in Germany. Among cross-country studies referring to AI impacts of worker-level outcomes, Parteka et al. (2024) investigate the relationship between workers’ wages and non-monetary factors and workers’ wellbeing. They found that workers exposed to AI experience better working conditions than workers exposed to robots and software across European countries.
The emerging literature on the impacts of AI on the labour markets shows no negative impact on labour demand (Green, 2023). It is estimated that AI workers constitute only 0.3% of OECD employment (Green & Lamby, 2023). Study shows that employment in occupations exposed to AI grew between 2012–2019, but no causal link was established (Georgieff & Hyee, 2021).
In this section, the data used in this study were presented and details of measurement of technology exposure were provided.
The main source of data is the 2018 release of the European Structure of Earnings Survey (EU-SES), which is the most reliable source of cross-country data on wages in the EU. This large employer-employee-matched survey data provide harmonised information on earnings across European countries. It includes information on worker earnings, as well as individual, job, and firm characteristics. The data cover enterprises employing more than ten employees. The study covers 20 European countries, divided into two groups—Western European countries: Belgium, Germany, Greece, Finland, France, Italy, Netherlands, Norway, Portugal, Spain, and Sweden; and Eastern European countries: Bulgaria, Czech Republic, Estonia, Lithuania, Latvia, Poland, Romania, Slovakia, and Croatia.
To measure the exposure to artificial intelligence, AI-scores proposed by E. Felten et al. (2021) are used. The AI exposure scores for occupations are calculated based on the abilities which are required to work in a particular job (abilities come from O*NET database). AI exposure does not differ across time, only between occupations. In this study, exposures to AI at the European occupational level (ISCO08 2-digit level) are calculated. This measure takes values from −1.6 to 1.5 and is standardised across occupations. Therefore, positive values characterize occupations that are more exposed to AI than average occupation.
This study uses measures for trade and globalisation at the country-industry level from the EORA database (Lenzen et al., 2012, 2013). In particular, log exports, as well as backward and forward global value chains (GVCs), participation are used. To calculate the measures for participation in GVC, the methodology of Borin and Mancini (2015, 2019) is applied. The data on sectoral output and employment come from Eurostat.
Exposure to artificial intelligence differs between socio-economic groups. Figure 1 presents the AI exposure according to age and education level. Workers aged 50–59 years old are the least exposed group, and the average AI exposure is 0.05 (Figure 1, top panel). The AI exposure is the highest among workers ages 30–39 years old and totals 0.19. The average AI exposure among the remaining age groups is similar and ranges between 0.07–0.10.
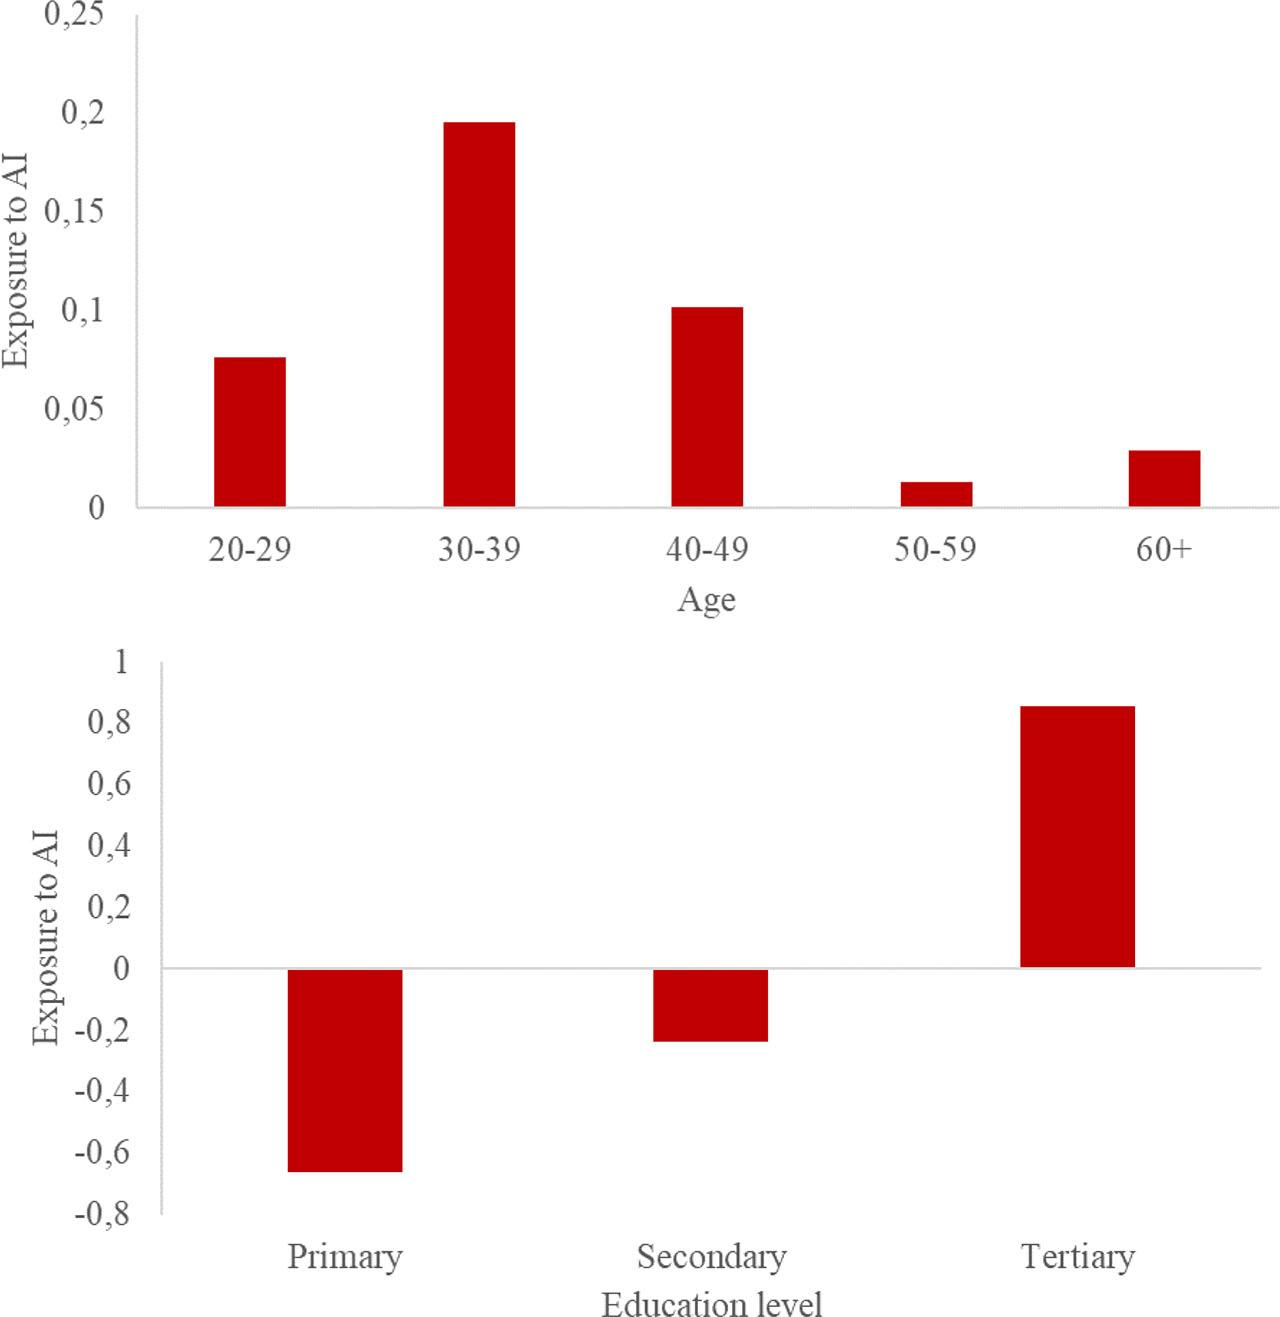
Exposure to AI by age groups and education level
Source: authors’ elaboration based on EU SES, EORA, E. Felten et al. (2021) data
The AI exposure according to education level is increasing monotonously—the higher the education, the higher the exposure (Figure 1, bottom panel). The average exposure among tertiary educated workers (0.89) is significantly higher than among primary educated (−0.60) and secondary educated workers (−0.18). In fact, tertiary educated workers perform occupations that are more exposed to AI than the average occupation. It means that better skilled workers tend to perform occupations that are more exposed to AI than less skilled workers.
The average AI exposure increases along wage distribution (Figure 2). The higher the log wage percentile, the higher the average AI exposure. Workers earning less than the median tend to perform occupations that are less exposed to AI than the average occupation. It suggests that occupations that are more exposed to artificial intelligence pay, on average, higher wages. It is also in line with the increase in AI exposure with respect to education.
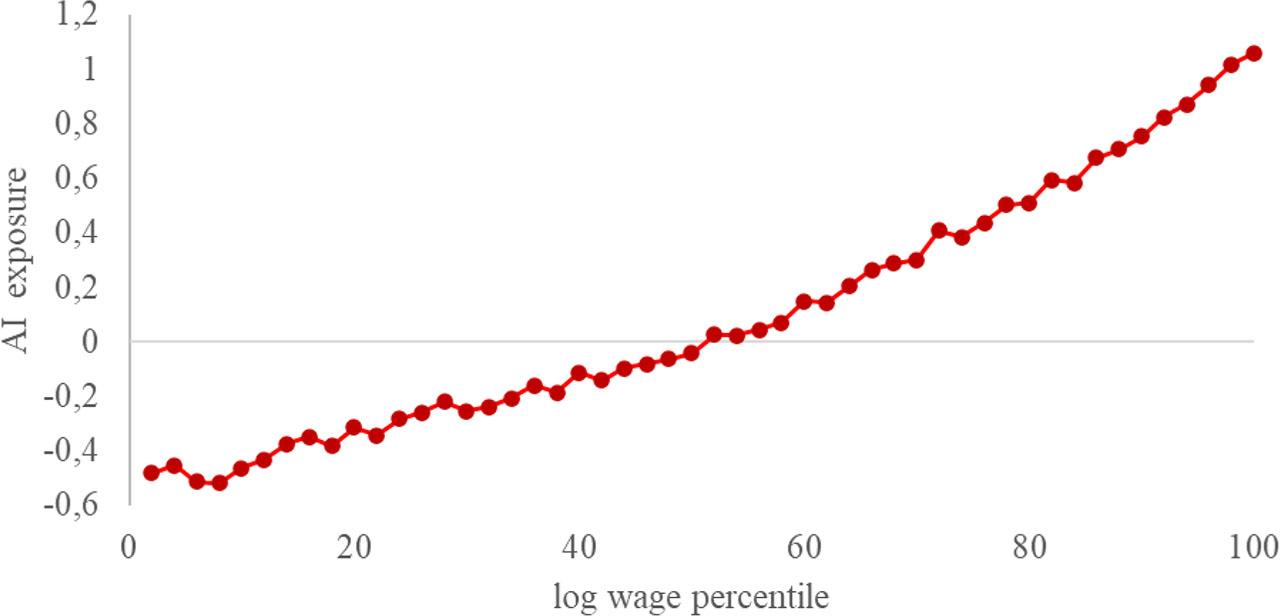
Exposure to AI by log wage percentile
Source: authors’ elaboration based on EU SES, EORA, E. Felten et al. (2021) data
There is almost no correlation between the change in log wages and AI exposure, especially in Western European countries. There is some weak negative association (−18%) in Eastern European countries (Figure 3).
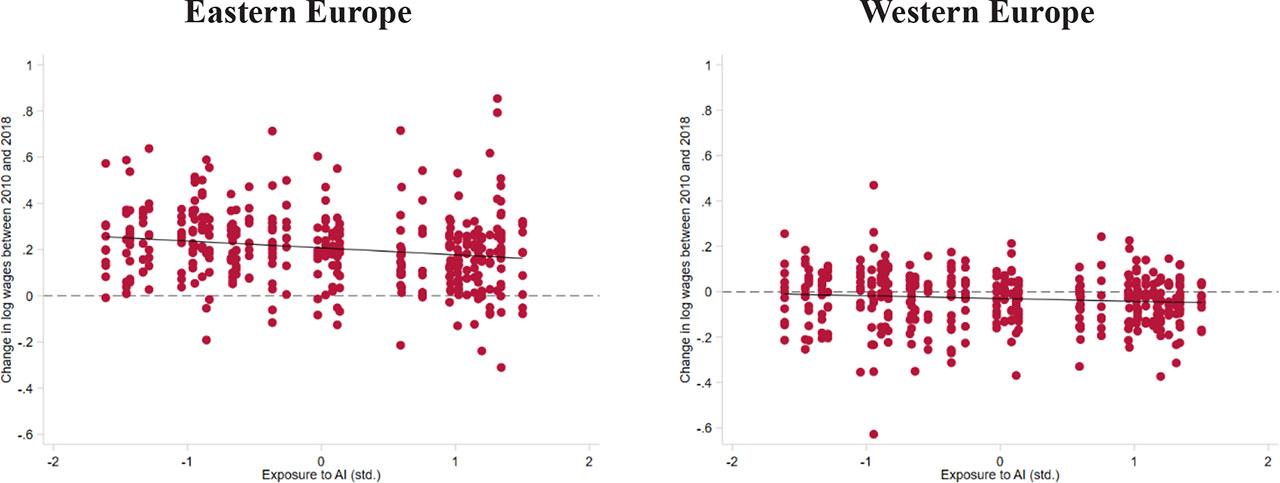
Correlation between change in log wage between 2010–2018 and AI exposure, in Eastern and Western European countries
Source: authors’ elaboration based on EU SES, EORA, E. Felten et al. (2021) data
As a first model, the following Mincerian wage regression is estimated:
To account for the heterogeneity of the relationship between workers across their skills, the interaction between AI exposure and workers’ education is included. Education level is a good proxy for worker skills. In the following sections, workers with tertiary education will be referred to as high-skilled workers, workers with secondary education as middle-skilled workers, and workers with primary education as low-skilled workers. To account for potential non-linearities in association between AI exposure and workers’ wages, squared exposure and its interactions are also included. Formally:
A proposed estimation approach has limitations. None of the presented models can provide causal evidence of AI exposure on workers’ wages. Firstly, AI exposures measure the vulnerability of occupations to AI but not the actual treatment. It therefore shows which occupation, and workers, may be affected by AI, but it does not mean they necessarily are. Secondly, to estimate the causal effects of AI on workers’ wages, one should use firm-level data with information about technology adoption and time period of the data. Hence, results presented in this study should be interpreted with caution and treated like a description of final allocation is in equilibrium, rather than causal relationships.
In this section, estimation results regarding relationship between AI exposure and workers’ wages are presented.
Positive association between AI exposure and workers’ log wages are found in all regression specifications (Table 1). According to a baseline specification of the model (Table 1, column 1), the relationship between AI exposure and log wages is 0.082. This means that the change in AI exposure by one sample standard deviation will be associated with an increase in log wages by 0.082 log points.
The relationship between AI exposure, skill level (education), and workers’ wages, standardised
| (1) | (2) | (3) | (4) | (5) | (6) | |
|---|---|---|---|---|---|---|
| AI Exposure (std.) | 0.028*** (0.003) | 0.063*** (0.003) | 0.025*** (0.002) | 0.084*** (0.004) | 0.122*** (0.003) | 0.017*** (0.003) |
| AI Exposure 2 (std.) | 0.010*** (0.002) | −0.001 (0.002) | 0.027*** (0.001) | 0.046*** (0.003) | 0.043*** (0.003) | 0.027*** (0.002) |
| AI Exposure (std.) X Secondary Education dummy | −0.039*** (0.002) | −0.050*** (0.002) | −0.009*** (0.002) | |||
| AI Exposure (std.) X Tertiary Education dummy | −0.080*** (0.003) | −0.080*** (0.003) | 0.036*** (0.002) | |||
| AI Exposure 2 (std.) X Secondary Education dummy | −0.022*** (0.002) | −0.038*** (0.002) | −0.015*** (0.001) | |||
| AI Exposure 2 (std.) X Tertiary Education dummy | −0.043*** (0.003) | −0.048*** (0.003) | −0.001 (0.002) | |||
| Secondary Education dummy | −0.065*** (0.002) | −0.041*** (0.001) | 0.072*** (0.001) | −0.069*** (0.003) | −0.034*** (0.002) | 0.085*** (0.002) |
| Tertiary Education dummy | 0.131*** (0.002) | 0.165*** (0.002) | 0.226*** (0.002) | 0.170*** (0.003) | 0.200*** (0.003) | 0.205*** (0.002) |
| Occupation FE. | Yes | Yes | Yes | Yes | Yes | Yes |
| Sector FE. | No | Yes | Yes | No | Yes | Yes |
| Country FE. | No | No | Yes | No | No | Yes |
| No. of Observations | 7.9 M | 7.9 M | 7.9 M | 7.9 M | 7.9 M | 7.9 M |
Note: Standard errors in parentheses.
p<0.01,
p<0.05,
p<0.1
Source: authors’ elaboration based on EU SES, EORA, E. Felten et al. (2021) data.
Adding controls for country fixed effects increases this association to 0.091 log points. It reveals that the relationship between AI exposure and workers’ wages may not be linear due to a negative and significant coefficient of squared exposure (Table 1, column 2). Regression results confirm the associations stated in the descriptive results section. Workers performing occupations that are more exposed to AI tend to earn higher wages.
However, the relationship between AI exposure and workers’ wages may differ between types of work. Therefore, connecting the AI exposure with workers’ education level approximates worker skills. Regression results presented in columns (3) and (4) of Table 1 suggest that the relationship between AI exposure and workers’ wages differs across the distribution of worker skills. Figure 4 presents the average association between the AI exposure and workers’ wages among all education groups. This coefficient can be interpreted as the wage premium associated with AI in different worker skills groups. While the size of the coefficient is not very different between primary and secondary educated workers, it is much higher among the higher educated. Results of the model suggest that AI exposure is complementary to high-skilled workers, which contributes to higher wage premia.
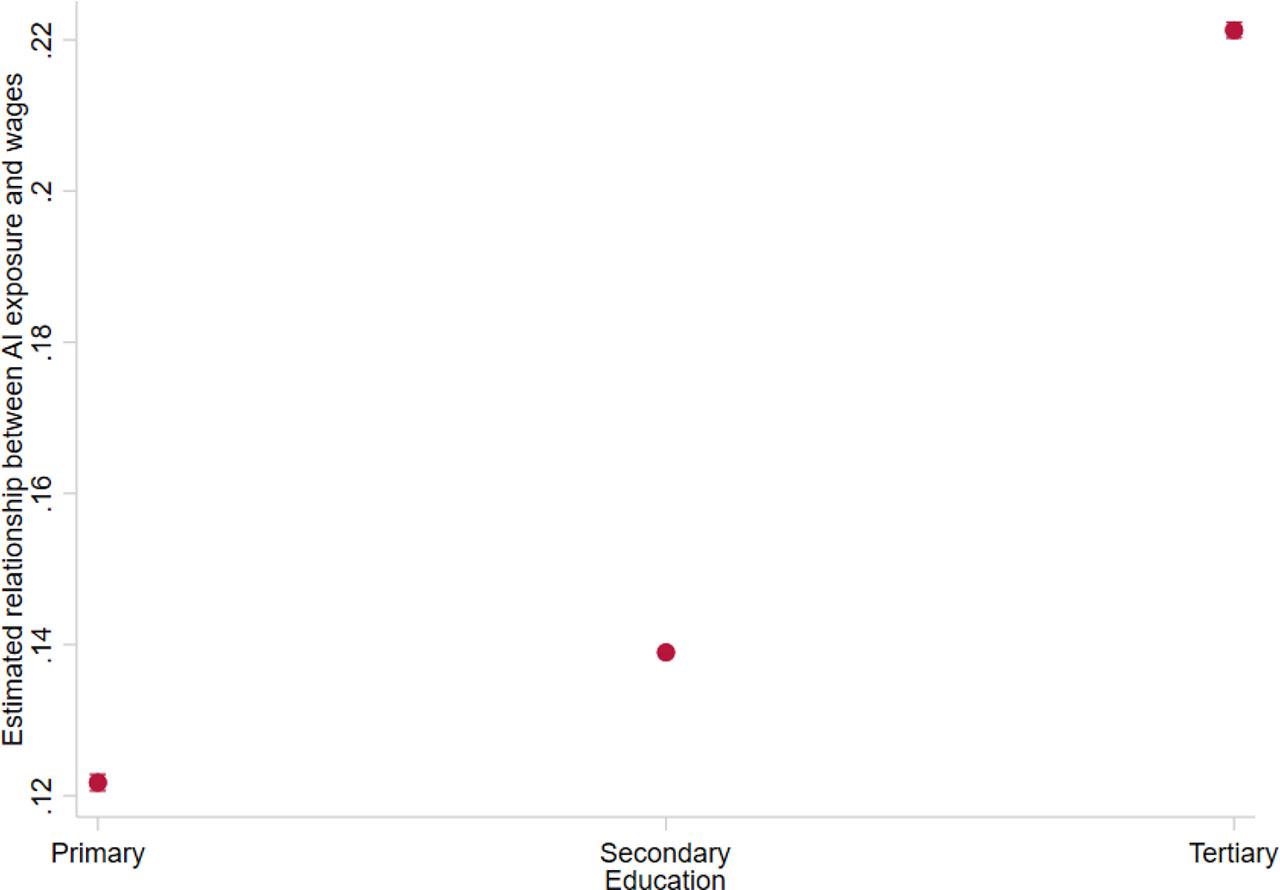
The estimated relationship between AI exposure and workers’ wages in primary, secondary, and tertiary educated groups
Source: authors’ elaboration based on EU SES, EORA, E. Felten et al. (2021) data
Figure 5 presents the estimated returns for education across the AI exposure distribution for secondary and tertiary education (primary education is a reference group). Among workers with secondary education, the returns for education vary between 0.09–0.14, with the highest values in the middle of AI exposure distribution. Returns for tertiary education are much higher than in the case of secondary education and take values between 0.15–0.43. Similarly, the highest returns are also concentrated in the middle of AI exposure distribution. It suggests nonlinearity in the association between workers’ wages and AI exposure.
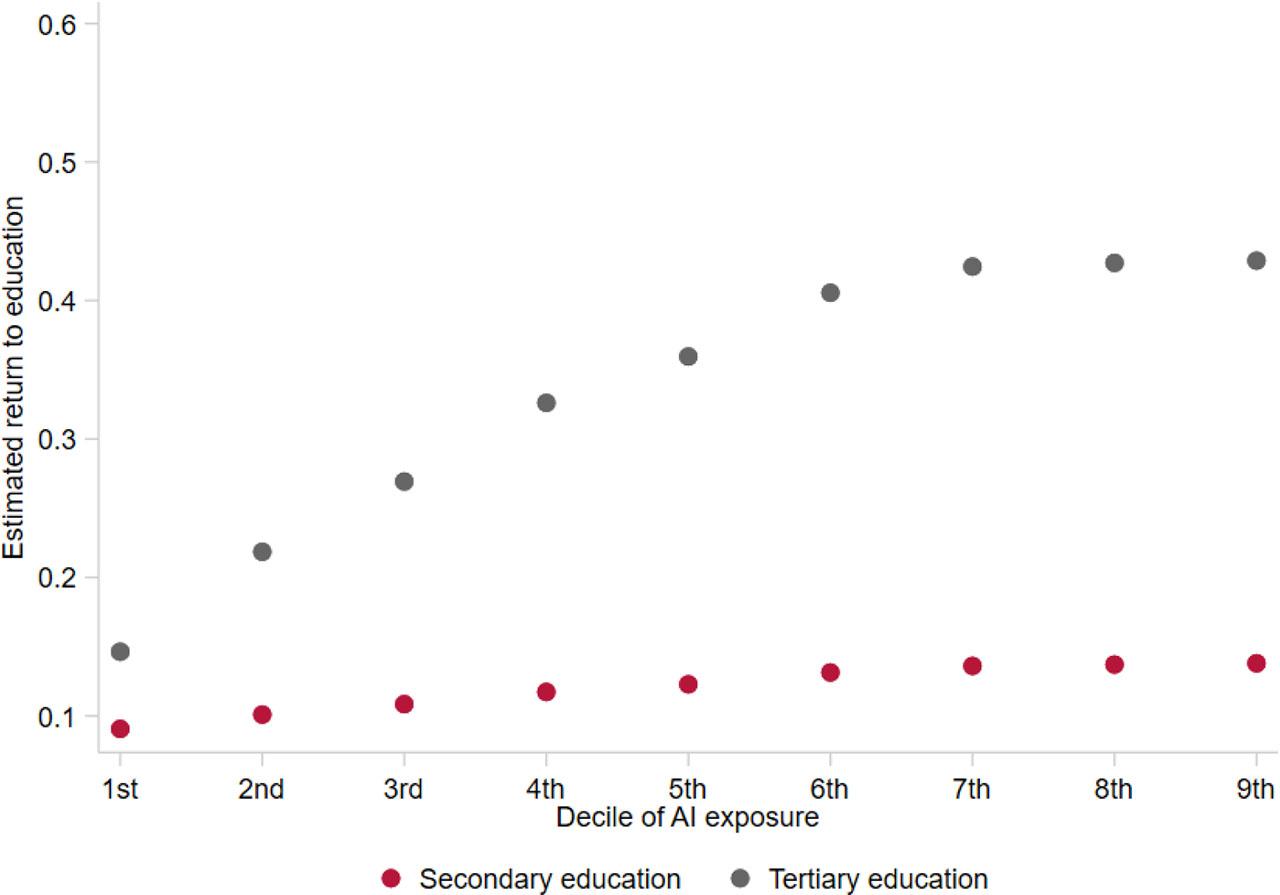
Estimated returns to education by deciles of AI exposure
Note: Primary education is the base category. For presentation purposes, the distance between AI exposure deciles is equal
Source: authors’ elaboration based on EU SES, EORA, E. Felten et al. (2021) data
Relationships estimated in this section are in line with the foregoing literature. Overall, results obtained in this study suggest that AI exposure is positively associated with workers’ wages (Engberg et al., 2023; Fossen et al., 2022; Parteka et al., 2024). Moreover, the relationship concentrates among high-skilled workers who benefit from AI the most (Fossen et al., 2022; Jerbashian, 2021).
Next, the sample is divided into Eastern and Western European countries. The overall direction of associations resembles those in the full sample (Table 2). The point estimates for AI exposure tend to be higher in Eastern European countries than in Western European countries. Significant coefficients of squared AI exposure confirm the nonlinearity of association in both groups.
The relationship between AI exposure, skill level (education), and workers’ wages in Western and Eastern European country groups, standardised
| Panel A: Western European | (1) | (2) | (3) | (4) | (5) | (6) |
|---|---|---|---|---|---|---|
| AI Exposure (std.) | 0.067*** (0.006) | 0.066*** (0.005) | 0.043*** (0.004) | 0.136*** (0.007) | 0.130*** (0.005) | 0.048*** (0.005) |
| AI Exposure 2 (std.) | 0.010*** (0.003) | 0.051*** (0.003) | 0.037*** (0.002) | 0.067*** (0.004) | 0.103*** (0.003) | 0.044*** (0.003) |
| AI Exposure (std.) X Secondary Education dummy | −0.079*** (0.003) | −0.068*** (0.002) | −0.016*** (0.002) | |||
| AI Exposure (std.) X Tertiary Education dummy | −0.034*** (0.004) | −0.050*** (0.003) | 0.017*** (0.002) | |||
| AI Exposure 2 (std.) X Secondary Education dummy | −0.060*** (0.003) | −0.052*** (0.003) | −0.016*** (0.002) | |||
| AI Exposure 2 (std.) X Tertiary Education dummy | −0.086*** (0.004) | −0.072*** (0.003) | −0.012*** (0.002) | |||
| Secondary Education dummy | 0.250*** (0.002) | 0.223*** (0.002) | 0.107*** (0.001) | 0.273*** (0.003) | 0.243*** (0.003) | 0.117*** (0.002) |
| Tertiary Education dummy | 0.385*** (0.003) | 0.359*** (0.002) | 0.244*** (0.002) | 0.419*** (0.004) | 0.395*** (0.004) | 0.236*** (0.003) |
| Occupation FE. | Yes | Yes | Yes | Yes | Yes | Yes |
| Sector FE. | No | Yes | Yes | No | Yes | Yes |
| Country FE. | No | No | Yes | No | No | Yes |
| No. of Observations | 3.3 M | 3.3 M | 3.3 M | 3.3 M | 3.3 M | 3.3 M |
| Panel B: Eastern European | (1) | (2) | (3) | (4) | (5) | (6) |
|---|---|---|---|---|---|---|
| AI Exposure (std.) | 0.038*** (0.003) | 0.036*** (0.003) | 0.009*** (0.003) | 0.034*** (0.005) | 0.028*** (0.005) | −0.010** (0.005) |
| AI Exposure 2 (std.) | 0.017*** (0.002) | 0.009*** (0.002) | 0.018*** (0.002) | −0.009*** (0.003) | −0.014*** (0.003) | 0.002 (0.003) |
| AI Exposure (std.) X Secondary Education dummy | −0.012*** (0.004) | −0.011** (0.004) | −0.005 (0.004) | |||
| AI Exposure (std.) X Tertiary Education dummy | 0.011** (0.005) | 0.027*** (0.005) | 0.056*** (0.005) | |||
| AI Exposure 2 (std.) X Secondary Education dummy | 0.017*** (0.003) | 0.012*** (0.003) | 0.000 (0.003) | |||
| AI Exposure 2 (std.) X Tertiary Education dummy | 0.037*** (0.004) | 0.028*** (0.004) | 0.013*** (0.003) | |||
| Secondary Education dummy | −0.012*** (0.002) | 0.004** (0.002) | 0.051*** (0.002) | −0.039*** (0.003) | −0.015*** (0.003) | 0.051*** (0.003) |
| Tertiary Education dummy | 0.126*** (0.003) | 0.138*** (0.003) | 0.229*** (0.002) | 0.070*** (0.004) | 0.088*** (0.004) | 0.190*** (0.003) |
| Occupation FE | Yes | Yes | Yes | Yes | Yes | Yes |
| Sector FE. | No | Yes | Yes | No | Yes | Yes |
| Country FE. | No | No | Yes | No | No | Yes |
| No. of Observations | 4.7 M | 4.7 M | 4.7 M | 4.7 M | 4.7 M | 4.7 M |
Note: Standard errors in parentheses.
p<0.01,
p<0.05,
p<0.1
Source: authors’ elaboration based on EU SES, EORA, E. Felten et al. (2021) data.
Turning to the marginal effects of AI exposure at the education level reveals substantial heterogeneity between countries and workers. In both country groups, the AI-related wage premium is considerably higher among high-skilled workers (Figure 6). The difference between low- and middle-skilled workers is less pronounced. However, AI-related wage premia are significantly higher in Eastern European countries (Figure 7). This effect may be explained by a combination of three main factors. First, AI technologies are experiencing a period of rapid growth. The demand for AI-related skills among occupations and sectors increased dramatically and is what increased wage premia for these skills (Alekseeva et al., 2021). Second, AI is a general-purpose technology and may be applied in many sectors. Hence, high-skilled, AI-related jobs offer competitive wages as firms have to compete for workers across industries. For example, a high-skilled robotics engineer is limited to working in an industry employing industrial robots. In contrast, IT specialists can be easily employed in a wide range of sectors, as their skills are more universal. Third, especially after the COVID-19 outbreak, opportunities for remote work have increased (Phillips, 2020). Some companies decided to hire AI-specialists abroad. So domestic companies in Eastern Europe compete for workers not only in their country’s market but also with companies from other markets (e.g. US and Western Europe), which elevates wages. Combining abovementioned factors with relatively lower labour costs in Eastern Europe compared to Western Europe, results show higher returns to AI-related skills in Eastern European countries. In other words, wages of workers with AI-related skills in Eastern European countries, to some extent, must be competitive with wages for similar work in Western European countries. However, the overall difference in labour costs between these country groups remains the same, as similar reasoning does not apply for other skills and occupations. Hence, AI-related wage premia are higher in Eastern European countries.
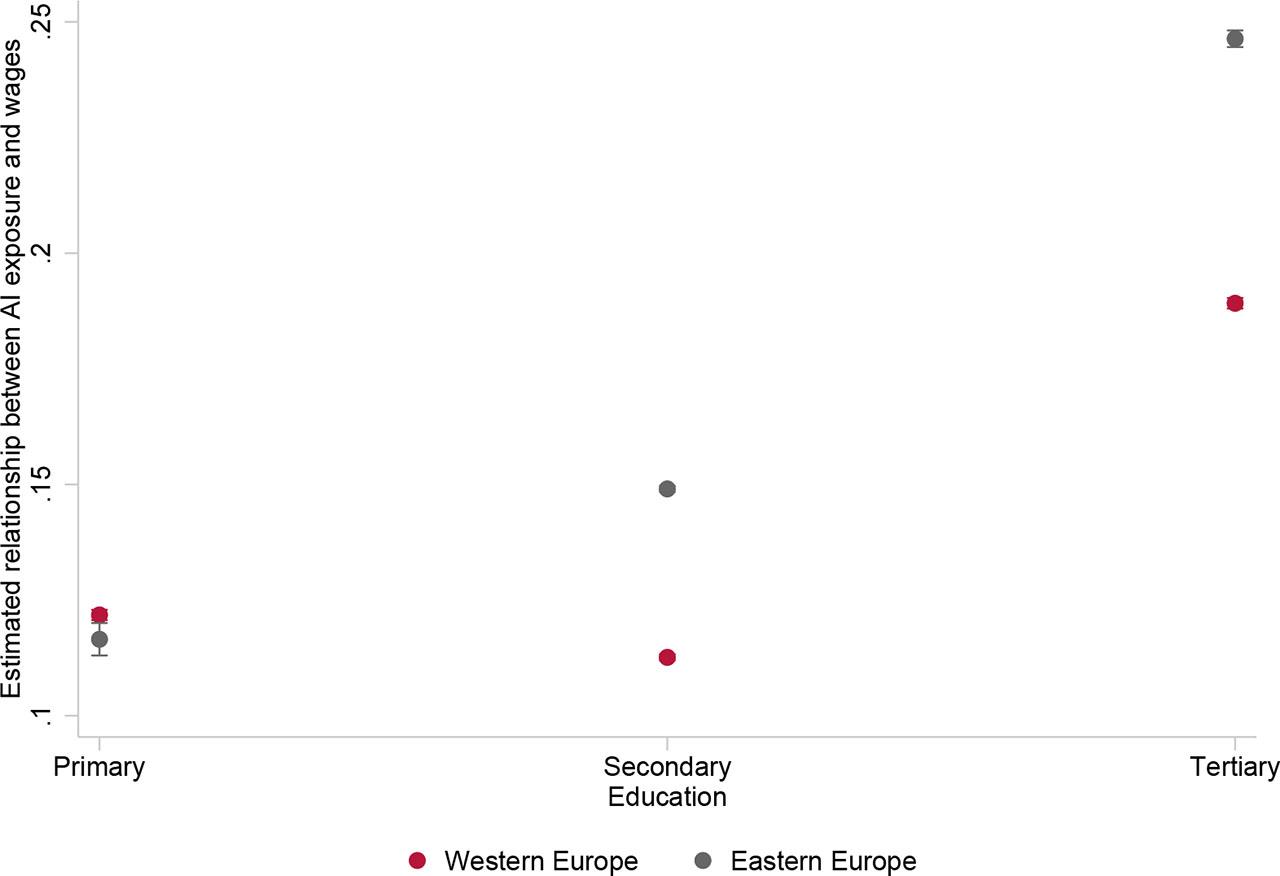
The estimated relationship between AI exposure and workers’ wages for the primary, secondary, and tertiary educated, in Eastern and Western European countries
Source: authors’ elaboration based on EU SES, EORA, E. Felten et al. (2021) data
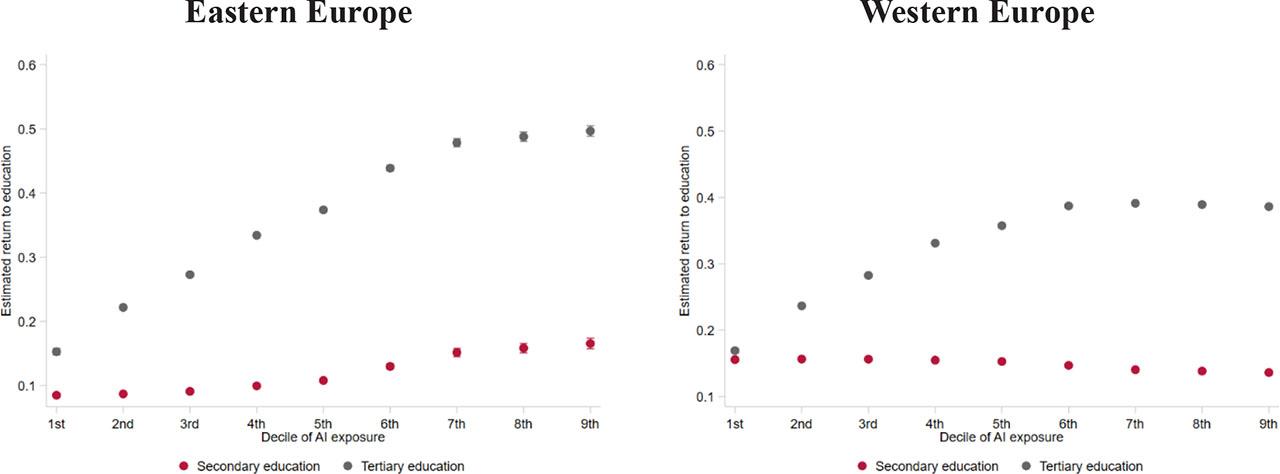
Estimated returns to education by deciles of AI exposure in Eastern and Western European countries
Source: authors’ elaboration based on EU SES, EORA, E. Felten et al. (2021) data.
Similarly, returns for education across AI-exposure distribution are higher in Eastern European countries than in Western European countries, but only among high-skilled workers. In contrast, returns for education of middle-skilled workers in Western Europe are higher than in Eastern Europe. So, the difference between middle- and high-skilled workers in Western European countries is lower. In Eastern European countries, high-skilled workers particularly benefit from the emergence of AI technologies.
This paper examines the relationship between exposure to artificial intelligence (AI) and workers’ wages, utilizing wage data from 21 European countries, comprising approximately eight million observations. AI exposure measures, as proposed by E. Felten et al. (2021), were adapted for the European context. The analysis controls for globalisation may be relevant in the context of AI technology. Participation in global value chains (GVCs), based on the measures introduced by Borin & Mancini (2015, 2019), serves as a proxy for globalisation. The findings indicate a positive relationship between AI exposure and wages, though this relationship varies across skill distribution.
The study explores the differences in AI’s impact on wages across various skill levels and country groups, using education level as a proxy for high-, medium-, and low-skilled workers. The positive relationship between AI exposure and wages is concentrated among high-skilled workers, aligning with previous research, such as Fossen et al. (2022), which emphasizes AI’s benefits for tertiary-educated individuals. Furthermore, the relationship between AI exposure and wages is non-linear. Returns for AI-related skills are highest among occupations moderately to highly exposed to AI (between the 6th and 9th deciles of exposure), while the association is weaker for occupations with low AI exposure, potentially showing that some occupations may still experience displacement effects.
Additionally, the relationship between AI exposure and wages varies across country groups. High-skilled workers in Eastern European countries experience greater returns from AI-related skills, likely due to differences in labor costs between Eastern and Western Europe and the relatively low cost of hiring workers with AI-related skills across borders.
Understanding the relationships between AI exposure and worker level outcomes across different occupations is crucial for policy implication. Thanks to its universality, AI has a potential to change the nature of work for a large number of workers. Therefore, it is important to identify potential “winners” and “losers” of ongoing technological transformation (Johnson & Acemoglu, 2023). For now, it seems that productivity effects prevail considerably over displacement effects. However, it still leads to a huge increase in gains among high-skilled workers and technological inequality. As a consequence, it may result in further market polarisation.
This study has limitations. First, it does not claim to have determined causal effect. AI exposure measures developed so far indicate only the potential exposure of occupations to AI, but not the actual treatment. It differs only between occupations, and therefore complete identification comes from the occupational structure of countries and sectors. Secondly, worker level data used in this study is cross-sectional. To causally estimate displacement effects of AI, one should use individual panel data, preferably with information of whether a company adopts AI related equipment and technology. Finally, AI is a rapidly developing technology. This paper does not take into account more recent inventions like GPTs.