

1. Introduction
Reducing summer thermal loads in buildings is an important aspect of designing energy-efficient and thermally stable indoor environments (Bakhshoodeh et al., 2022c; Harbiankova & Manso, 2025). Transparent sections of the building envelope play a particular role in this regard, as a significant proportion of heat gains can penetrate through them during periods of high solar radiation (Aguilar-Santana et al., 2020). One of the principal passive measures for limiting these gains is external shading, which has the advantage of intercepting or reducing solar radiation before it reaches the glazing (Bartko & Durica, 2023). Previous research indicates that external window shading represents an important design strategy for reducing solar loads and may provide a more pronounced effect than shading opaque façade components alone (Zheng et al., 2020).
One possible approach to creating an external shading element is the integration of vegetation into the building façade (Nasr et al., 2024). Vertical Greenery Systems (VGS) encompass a wide range of construction solutions, from traditional green façades with climbing plants to modular Living Wall Systems (Khan & Munawer, 2024). Their thermal performance results from a combination of several mechanisms, primarily interception of solar radiation by the vegetation layer, evapotranspiration, modification of surface temperatures, and changes in local airflow and the microclimate adjacent to the façade (Susorova et al., 2014). Unlike conventional fixed shading devices, however, vegetation represents a biologically dynamic element. Its shading performance depends on plant species, leaf-layer density, vegetation coverage ratio, orientation, seasonal development, and the operational conditions of the system (Bakhshoodeh et al., 2022a, 2022b; Wong et al., 2010). Façade orientation is an important boundary condition, as it determines the temporal pattern and intensity of direct solar exposure of the vegetation system (Lee & Jim, 2019). Previous experimental measurements under Central European climatic conditions have demonstrated distinctly different daily profiles of global solar radiation for east-, south-, and west-facing orientations, which are subsequently reflected in the temporal development of façade surface temperatures (Chabada et al., 2023). Leaf Area Index (LAI) and vegetation coverage ratio are among the parameters commonly used to characterize the density of the vegetation layer and its relationship with the thermal behavior of façades (Pérez et al., 2022).
Most experimental research on vertical greenery has historically focused primarily on opaque components of the building envelope (Paull et al., 2020). Experimental measurements on green façades and living wall systems have demonstrated reductions in surface temperatures and changes in the thermal response of building surfaces as a result of vegetation shading. El-Zoklah & Refaat, (2021); Hadba et al., (2017); Perini et al., (2011), for example, documented differences in surface temperatures between vegetation-shaded and unshaded façade surfaces and also highlighted the influence of the vegetation layer on local airflow. Pérez et al., (2011) reported a similar trend of reduced surface temperatures in shaded façade areas and demonstrated a pronounced seasonal variation in the shading effect of vegetation. Under Central European climatic conditions, Chabada et al., (2023) experimentally evaluated a prototype double-skin vegetated façade of the LWS type and, in comparison with conventional façade surfaces, demonstrated a substantial reduction in the surface temperatures of the vegetation system, while the resulting thermal response was also significantly influenced by the irrigation strategy. These studies with Bakhshoodeh et al., (2022b) support the general mechanisms of vegetation shading and evaporative cooling. However, their findings cannot be directly transferred to transparent building components because of the different optical and thermophysical properties of glazing and opaque façade materials.
Research on vegetation-based shading windows is considerably less extensive than research focusing on opaque façades (Oquendo-Di Cosola et al., 2022). One of the notable earlier experimental studies is that of Ip et al., (2010), in which an experimental “Bioshader” consisting of climbing vegetation positioned in front of a window was developed. During a two-year monitoring period, the authors evaluated the solar transmissivity of individual leaf layers and introduced a time-dependent Bioshading Coefficient describing changes in the shading performance of the vegetation throughout the growing cycle. The findings also demonstrated a pronounced dependence of solar transmissivity on the number of leaf layers, confirming that vegetation-based shading cannot be adequately characterized by a single constant value in the same manner as conventional static shading devices. A significant advance in the field of vegetation-based window shading was presented by Zheng et al., (2020), who developed a movable vegetation-based system referred to as the MGWSS (Movable Green Window Shading System). Their experimental assessment focused on the relationship between vegetation coverage, shading coefficient, heat flux through the glazing, and cooling energy consumption. At 80% vegetation coverage, a shading coefficient of 0.28 was reported, together with a substantial reduction in heat flux through single glazing. The study also highlighted that most previous experimental investigations of VGS had focused on opaque façades, while the number of studies directly addressing vegetation-based window shading remained limited. More recent in-situ measurements by Ren et al., (2024) further demonstrated that integrated vegetation around windows can influence not only the radiative load, but also heat flux through the glazing and local microclimatic conditions. Their findings confirmed the importance of jointly evaluating solar- and temperature-driven heat-transfer mechanisms through transparent building components.
Table 1:
Summary of selected previous studies on vegetation-based window shading and their methodological implications for the present study
| Study | Experimental approach / main contribution | Relevant limitation / challenge | Implication for the present study |
|---|---|---|---|
| Ip et al. (2010) | Long-term experimental evaluation of a climbing-plant “Bioshader”; demonstrated the dependence of solar transmissivity on leaf-layer density and seasonal development. | Vegetation properties and shading performance varied dynamically over time; thermal response through the complete window–indoor system was not the main focus. | Supports the need to treat vegetation as a dynamic shading element and highlights the importance of future quantitative canopy characterization. |
| Zheng et al. (2020) | Developed a movable green window shading system and quantified shading coefficient, glazing heat flux, and cooling-energy effects for different vegetation coverage levels. | Comparison was performed for a different glazing system, orientation, and climatic context; the window construction differed substantially from the modern triple glazing used in the present study. | Demonstrates the value of movable vegetation shading and motivates controlled assessment of the same window under shaded and unshaded conditions. |
| Ren et al. (2024) | Full-scale in-situ assessment of window-integrated vegetation, including glazing heat flux and local microclimatic effects. | Results are strongly dependent on the specific glazing, climate, geometry, and vegetation configuration. | Supports simultaneous monitoring of radiative, thermal, and local microclimatic responses rather than evaluating shading through a single indicator. |
| Chabada et al. (2023) | Experimental assessment of a vegetated façade under Central European climatic conditions, including the influence of irrigation and façade orientation. | Focused primarily on opaque/vegetated façade components rather than transparent window systems. | Provides climatic and methodological background for evaluating vegetation systems under Central European conditions. |
The comparison summarized in Table 1 indicates that previous studies have established the potential of vegetation-based window shading, while also highlighting several methodological challenges. These include the dynamic nature of vegetation, differences in glazing properties and façade orientation, spatially non-uniform solar exposure, and difficulties in separating the effect of shading from differences between window constructions. Based on these observations, the present experimental setup was designed to compare the same window under vegetation-shaded and unshaded conditions while maintaining the window construction, indoor geometry, and principal sensor positions unchanged. Simultaneous monitoring of local solar exposure, glazing surface temperature, heat flux density, and the indoor thermal response was adopted to evaluate the complete response sequence of the system.
Despite the findings mentioned above, the experimental assessment of vegetation-based shading of transparent building components remains methodologically challenging. A vegetation screen produces spatially and temporally variable shading, and its performance depends on the biological characteristics of the plant as well as on prevailing climatic conditions. Ip et al., (2010) highlighted the need for a dynamic assessment of vegetation shading throughout the annual growth cycle, whereas Zheng et al., (2020) pointed out the spatial non-uniformity of solar exposure behind the vegetation screen. At the same time, the number of full-scale in-situ experiments conducted on real window systems and simultaneously monitoring the entire response sequence-from local solar exposure in front of the glazing, through glazing surface temperature and heat flux, to changes in the thermal state of the indoor experimental space-remains relatively limited. A methodological challenge also remains directly comparing the vegetation-shaded and unshaded conditions without simultaneously altering the window structure itself, the geometry of the interior space or the basic measurement.
To address the above issues, a new full-scale experimental system for movable vegetation-based shading of a transparent building component was designed and implemented as part of this study. Its key feature is the possibility of relocating the vegetation screen between individual window positions, thereby allowing the same window to be assessed under a vegetation-shaded condition (VEGE) and an unshaded reference condition (REF) without changing the window construction itself or the basic measurement system. The experimental setup also enables simultaneous monitoring of reference climatic conditions, the local microclimate in front of the window, solar exposure, glazing surface temperature, heat flux density through the transparent component, and the temperature–humidity response of a thermally insulated indoor test space. Such an arrangement allows vegetation-based shading to be evaluated as a continuous response process, from modification of the external radiative load to the resulting thermal response of the indoor environment.
The aim of this study is to design, implement, and experimentally validate a movable vegetation-based external shading system for a transparent building component under real climatic conditions. The experimental assessment focuses on quantifying the influence of the vegetation screen on local solar exposure in front of the window, glazing surface temperature, heat flux through the glazing, and the thermal response of the thermally insulated indoor experimental space.
2. Methodology
2.1. Experimental Site and Research Design
The experimental research was conducted in the pavilion laboratory of the Department of Building Engineering and Urban Planning, Faculty of Civil Engineering, University of Žilina. The facility has been used for long-term experimental research on building components exposed to real outdoor climatic conditions (Bartko & Durica, 2023). The laboratory consists of three separate pavilion spaces, while the monitored façade containing the experimental window constructions is oriented south with an approximately 15° deviation towards the west (Figure 1).
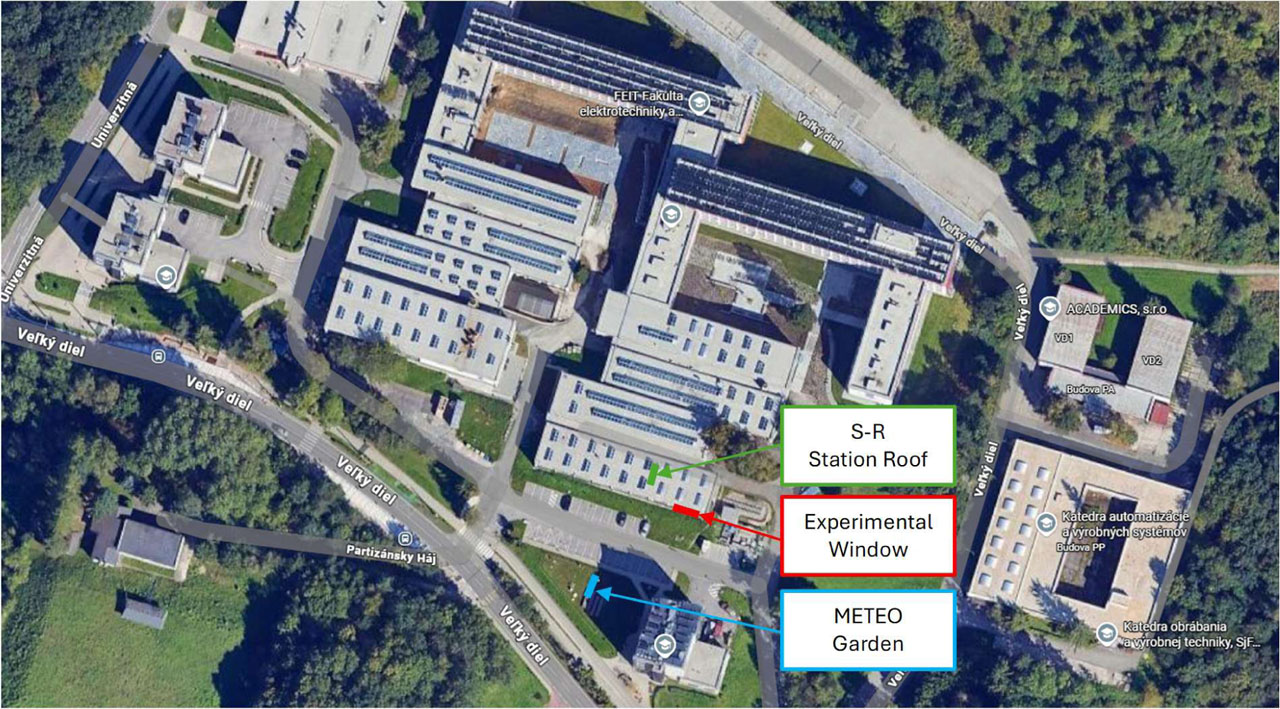
Figure 1:
Location of the experimental facility on the campus of the University of Žilina
The external wall in the experimental windows consists of 300 mm thick aerated concrete masonry, externally insulated with 160 mm of mineral wool and internally insulated with 100 mm of expanded polystyrene. The monitored façade section contains three adjacent window positions with different frame materials: an aluminium-framed window, which was not assessed within this study; a PVC window designated as W1; and a timber window designated as W2.
The experimental system was designed primarily to evaluate the influence of vegetation-based external shading on the solar and thermal loads of transparent building-envelope components. The key element of the proposed solution is a movable vegetation-based shading system that allows the position of the vegetation screen to be changed relative to the monitored window constructions. The main variant analysed in this study was the PVC window W1. A thermally insulated experimental space – a thermal insulation box, designated as TI Box 1, was constructed on its interior side. An analogous TI Box 2 was installed behind the timber window W2, whose configuration remained unchanged throughout the analysed experiment, and which served as a supplementary reference variant. The aluminium-framed window was monitored without a thermally insulated box and provided an additional window position to which the vegetation-based shading element could be relocated. However, the aluminium-framed window itself was not assessed or evaluated in this study.
The proposed experimental setup enables simultaneous monitoring of outdoor climatic conditions, the local microclimate in the vicinity of the window constructions, solar radiation, glazing surface temperatures, heat flux density through the glazing, and the temperature–humidity response of the thermally insulated indoor test environment. The resulting thermal response can therefore be evaluated as a sequential process, from the external climatic load and the modification of solar exposure by vegetation-based shading, through heat transfer across the transparent building component, to the subsequent response of the indoor environment within the experimental box.
2.2. Monitored Window Constructions
The experimental facility includes three adjacent window constructions (Figure 2) with different frame materials: an aluminium-framed window (not considered in this study), a PVC-framed window (W1), and a timber-framed window (W2) (Bartko & Durica, 2023).
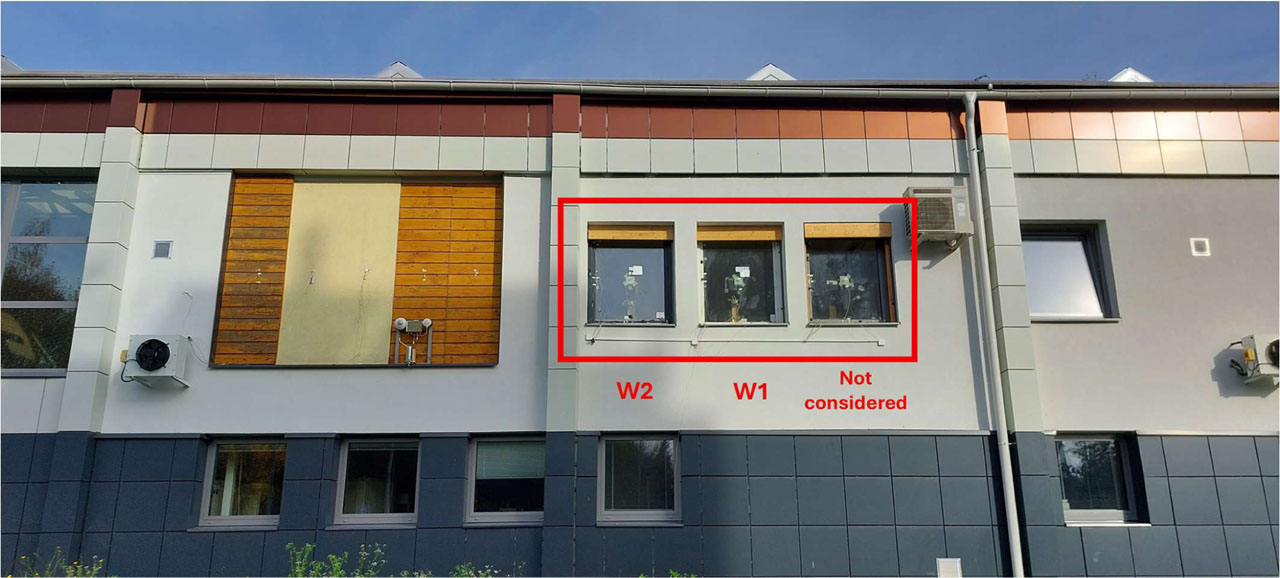
Figure 2:
Exterior view of the experimental window constructions of the pavilion laboratory. Window labels: from right to left – aluminium-framed window (not considered); PVC window (W1) in the centre; timber window (W2) on the left
The original PVC and timber windows used in previous experimental measurements were removed in April 2026 and replaced with new window constructions. The installation of the new windows was carried out by specialist contractors for the respective window systems. The aluminium-framed window remained in its original experimental position. Following the replacement of the PVC and timber windows, their thermal-technical characteristics were based on the current technical data declared by the manufacturers. The results and declared parameters of the original windows were not used in this study. The basic technical parameters of the monitored window constructions are summarized in Table 2. For the new PVC and timber windows, the technical parameters declared by the respective manufacturers were used.
Table 2:
Basic technical parameters of the evaluated window constructions
| Parameter | Timber-framed window W2 | PVC-framed window W1 |
| Frame material | Timber | PVC |
| Frame system / profile | 96 × 85, 500+ | Salamander bluEvolution 82 |
| Window dimensions [mm] | 1230 × 1480 | 1230 × 1480 |
| Glazing type | Insulating triple glazing | Insulating triple glazing |
| Glazing build-up [mm] | 4/18/4/18/4 | 4/18/4/18/4 |
| Cavity gas fill | Argon | Argon |
| Thermal transmittance of the window, UW [W/(m2·K)] | 0.64 | 0.74 |
| Solar factor of the glazing, g [-] | 0.53 | 0.54 |
| Construction status | New, installed 04/2026 | New, installed 04/2026 |
| Role in the experiment | Reference/control variant | Main VEGE/REF variant |
2.3. Design and Construction of the Movable Vegetation-Based Shading System
A movable vegetation-based shading system was designed and constructed on the exterior side of the experimental façade, allowing the position of the vegetation screen to be changed relative to the individual monitored window constructions. The aim of the solution was to create a vegetation element that would be sufficiently stable for long-term exposure to outdoor climatic conditions while also allowing flexible repositioning during experimental measurements.
The supporting structure of the system was attached to the exterior part of the experimental façade by means of steel brackets. The structure incorporated a designated position for a vegetation container and a vertical supporting frame to guide the climbing vegetation in front of the monitored window surface. The vegetation layer consisted of climbing ivy (Hedera hibernica), grow in a separate vegetation container filled with substrate. The plants were guided along a supporting mesh formed by an aluminium frame with an inserted aluminium wire mesh to create a continuous vegetation screen in front of the transparent part of the façade. The distance between the vegetation screen and the exterior glazing surface was approximately 720 mm. The resulting air gap allowed natural airflow between the vegetation and the window construction and at the same time provided sufficient space for the installation of local measuring devices.
A key feature of the experimental system is its mobility. The vegetation element can be repositioned in front of a selected window construction, allowing the shaded and unshaded states to be alternated without modifying the window itself, the position of the indoor sensors, or the geometry of the experimental space. Under suitable climatic conditions, this principle enables the same window to be monitored under two different states and substantially reduces the uncertainty associated with comparisons between windows with different frame or glazing configurations.
During the plant establishment period, the experimental sample was regularly irrigated and fertilized. The substrate temperature was monitored using a separate sensor, providing the possibility of analysing the operating conditions of the vegetation element in future studies. However, the quantification of evapotranspiration was not a primary objective of the present study. The structural development of the vegetation system consisted of several implementation steps: the assembly of external supporting elements, the installation of the vegetation container and the supporting structure, the planting and training of the vegetation, and the subsequent completion of the experimental setup, including the measuring equipment. The individual phases of implementation are documented in Figure 3 and Figure 4.
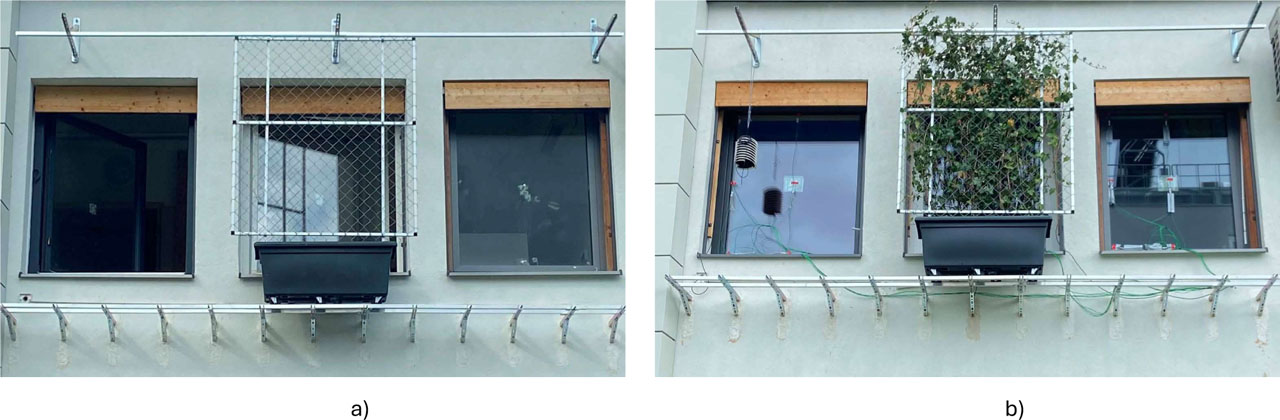
Figure 3:
Exterior view of experimental vegetation-based shading sample during the implementation process. Labels: a) construction of the exterior supporting structure enabling mobility of the vegetation sample; b) installation of the vegetation sample after planting and sensor placement
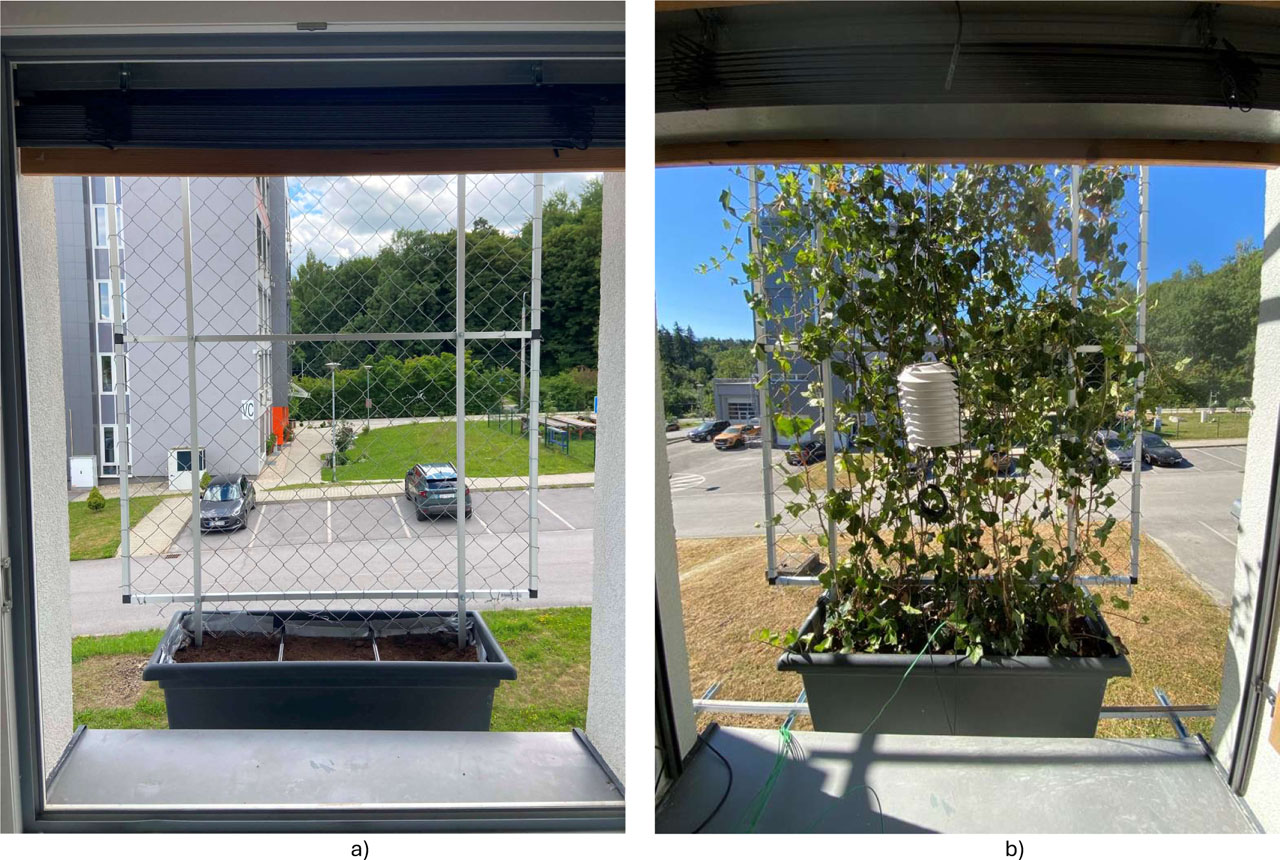
Figure 4:
Interior view of experimental vegetation-based shading sample during the implementation process. Labels: a) interior view of the installed sample; b) interior view of the final position and completed configuration of the vegetation-based shading sample
2.4. Thermally Insulated Experimental Boxes
Two separates thermally insulated experimental boxes were constructed on the interior side of the PVC and timber windows. Their primary purpose was to limit the direct influence of temperature variations in the surrounding laboratory environment on the monitored indoor area and to enable a clearer identification of the thermal response induced by the solar and thermal loads acting on the respective window construction. In this way, the individual window constructions were thermally separated to allow the effect of the vegetation-based shading sample to be assessed more reliably. TI Box 1 was installed behind the PVC window W1 and represented the main indoor experimental environment. TI Box 2 was analogously positioned behind the timber window W2 and served as the reference test environment (Figure 5).
The boxes were constructed from extruded polystyrene (XPS) boards with a thickness of 100 mm, with selected sections increased to 120 mm. The individual components were joined to minimize uncontrolled air exchange between the interior of the boxes and the surrounding laboratory environment. The internal dimensions of both TI Box 1 and TI Box 2 were 1300 × 1100 × 2400 mm, corresponding to an internal volume of 3.432 m3. During the main observation phase, both the windows and the experimental boxes remained closed.
Each box was equipped with a combined air temperature and relative humidity sensor. Sensor I1 was installed in TI Box 1 behind the PVC window, while sensor I2 was installed in TI Box 2 behind the timber window. This arrangement made it possible to monitor not only the instantaneous indoor air temperature, but also the daily temperature amplitude, the rate of overheating, and the time lag of the temperature maximum in relation to the external climatic load.
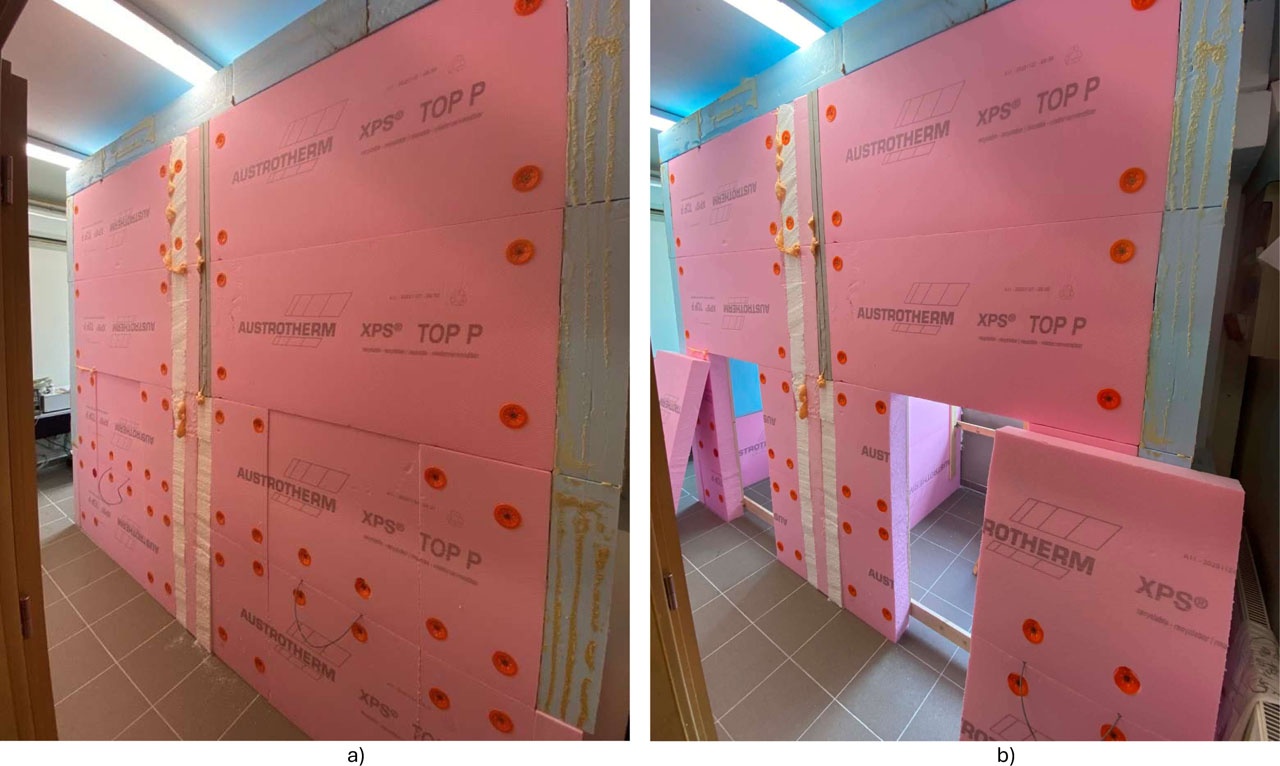
Figure 5:
Construction of the thermally insulated boxes used to separate the individual window configurations. Labels: a) with the openings to the TI boxes closed; b) with the openings to the TI boxes open
2.5. Measuring Equipment and Data Collection System
The experimental system combined several types of sensors to monitor outdoor climatic conditions, the local microclimate, glazing surface temperature, heat flux density, and conditions within the thermally insulated boxes.
Reference outdoor climatic conditions were recorded by a meteorological system located within the experimental site (meteorological garden) and by an independent reference station, S-R (Station Roof), installed on the roof of the pavilion laboratory. The monitored parameters primarily included air temperature, relative humidity, and global solar radiation.
Local conditions in the immediate vicinity of the window constructions were monitored using mobile measuring devices. Station S-W1 (Station Window 1) was positioned in front of the PVC window W1. Under the shaded condition, it was located in the space between the vegetation screen and the window construction; after the vegetation screen was relocated, the station remained in the same measurement position and recorded the conditions in front of the unshaded window. Station S-W2 (Station Window 2) was positioned in the vicinity of the timber window W2 and served as a supplementary local reference.
Glazing surface temperatures were recorded using thermocouples (NiCr-Ni LT0190-10) attached to the exterior surface of the monitored windows. The thermocouples were arranged in two vertical measurement lines on the glazing (side position – S; middle position – M) and at three height levels (top – T; middle – M; bottom – B). The exact sensor locations and their designations are shown in Figure 6. The multi-point measurement arrangement enabled the spatial non-uniformity of the glazing temperature field to be monitored.
Heat flux density through the glazing was measured using heat flow sensors (Heat Flow Plates FQAx) installed on the interior side of the individual windows. Sensor W1_Plate was used for the PVC window and W2_Plate for the timber window. For subsequent data evaluation, the positive heat flux direction was defined as heat flow towards the indoor experimental space.
Local outdoor air temperature and relative humidity were recorded by sensors E1 near the PVC window and E2 near the timber window. Air temperature and relative humidity inside TI Box 1 and TI Box 2 were recorded by sensors I1 and I2, respectively. The combined temperature and relative humidity sensors used were Miniature Multi-Sensor Modules (FHAD46C0L10). In addition, air temperature and relative humidity in the main laboratory space were monitored at the position designated as INT.
The primary sensors monitoring the window constructions, heat flux, and temperature–humidity conditions recorded data at 1-minute intervals and were connected to an internal AHLBORN data logger. The S-R, S-W1, and S-W2 stations used for monitoring meteorological and radiative conditions recorded data at 10-minute intervals using their own internal memory systems. Therefore, when joint time-based evaluation was required, the data were processed with consideration of the different temporal resolutions of the individual measurement systems. All time data are given in UTC.
The technical specifications of the measuring devices, including their measurement ranges, accuracies, and designations, are presented separately in Table 3. The instrumental uncertainty of the measurements was considered based on the manufacturer-declared accuracies summarized in Table 3. The primary comparison between the VEGE and REF conditions was performed using the same sensors at unchanged measurement positions on both analysed days. Consequently, systematic sensor offsets and calibration-related deviations were expected to affect both experimental conditions, similarly, thereby reducing their influence on the differential comparison. Particular caution was applied when interpreting differences comparable to the declared sensor accuracy. The principal VEGE–REF comparisons were therefore evaluated primarily as within-sensor changes rather than as comparisons between independent measuring devices. A formal propagation of measurement uncertainty was not performed for the derived indicators.
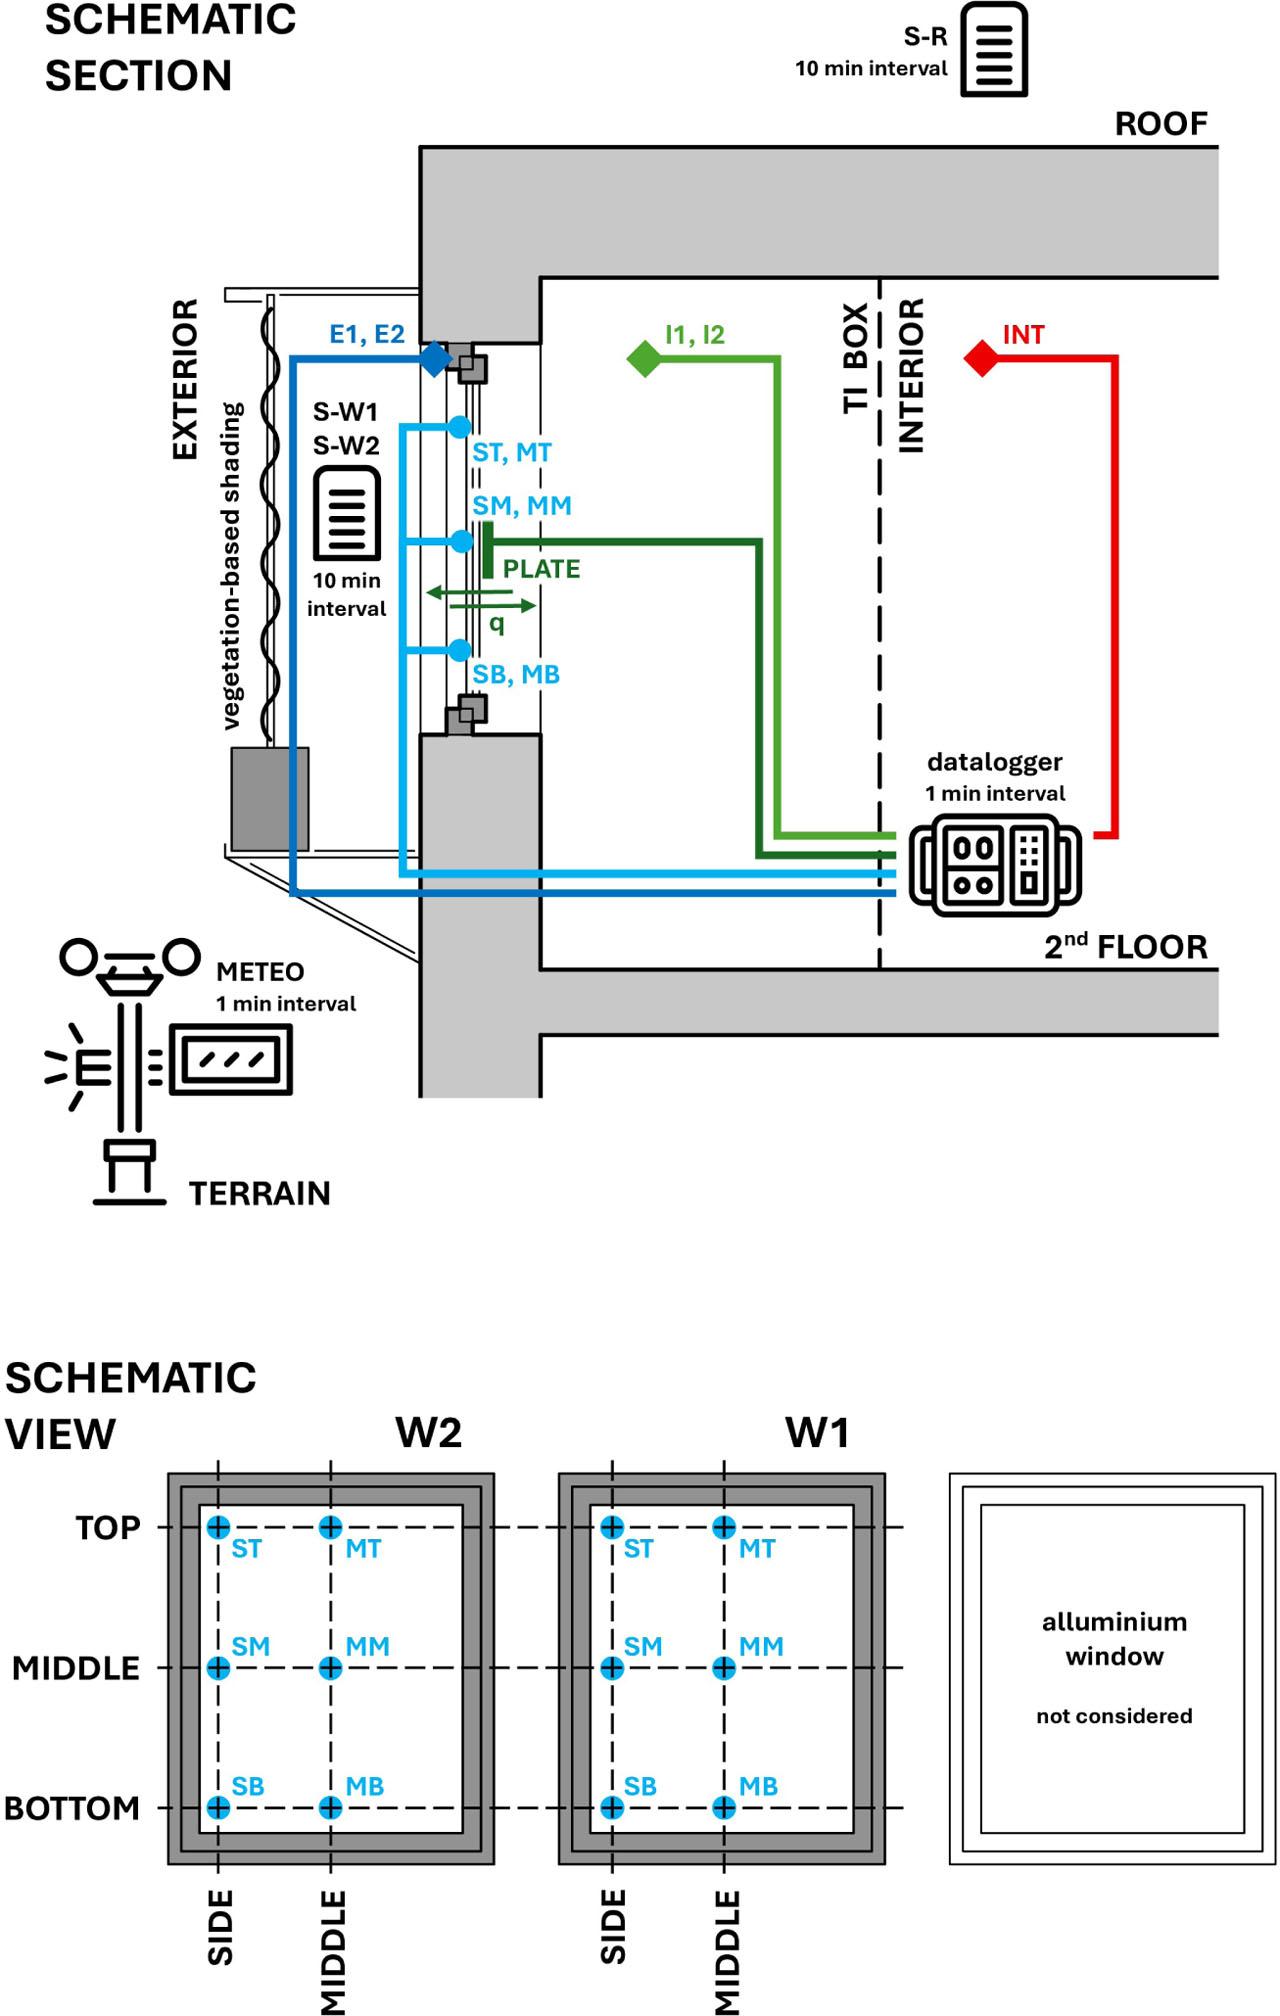
Figure 6:
Schematic arrangement of the experimental measurement system and sensor locations: schematic section through the experimental façade showing reference, local, indoor, and heat-flux measurements, and schematic front view of windows W1 and W2 showing the positions of the glazing surface temperature sensors. W1 represents the PVC-framed window and W2 the timber-framed window. TI Box had identical internal dimensions of 1300 × 1100 × 2400 mm
The dimensions of the window structures are also the same; Dimension: h = 1.48 m; w = 1.23 m. The distance between the vegetation shading and the exterior glazing surface was approximately 720 mm.
Table 3:
Technical specifications of the measuring equipment
| Device/Sensor | Parameters | Values |
|---|---|---|
| Datalogger | Overload | Max ± 12 V |
| Input current | 500 pA | |
| Measuring rate | 2.5/10/50/100 mops | |
| System accuracy | 0.02% ± 1 digit (at 2.5 and 10 mops) 0.05% ± 3 digits (at 50 mops) | |
| Heat Flow Plates FQAx | Temperature stability | −40 to +80 °C |
| Calibration accuracy | 5% | |
| Miniature multi-sensor module FHAD 46C0L10 | Temperature range | −20 to +80 °C |
| Relative humidity range | 5% to 98% | |
| Accuracy | −20 to 85 °C–max 0.7 °C ±3% Rh in range 10% ÷ 90% Rh ±5% Rh in range 5% ÷ 98% Rh | |
| Reproducibility | ±0.1 °C | |
| Thermocouples NiCR-Ni | Temperature range | −20 to 205 °C |
| Accuracy | Class 2 | |
| Station: Roof (S-R) Window 1 (S-W1) Window 2 (S-W2) | Temperature range | −40 to +105 °C |
| Solar irradiance | 0 to 2000 W/m2 | |
| Accuracy | ±0.2 °C 5% (W/m2) of daily total |
2.6. Experimental Method
For the detailed evaluation of the effect of vegetation-based shading, two consecutive summer days, 4 and 5 August 2026, were selected. The selection was based on a comparison of a broader monitoring period and on the high similarity of the reference climatic conditions recorded during both days.
On 4 August 2026, the vegetation screen was positioned in front of the PVC window W1 during the main experimental phase. This condition was designated as the vegetation-shaded variant (VEGE).
On 5 August 2026, the vegetation screen was relocated from the position in front of the PVC window to the neighbouring aluminium-framed window. Following the relocation of the vegetation element, the PVC window W1 represented the unshaded reference condition (REF). The PVC window itself, the positions of the surface temperature sensors, the heat flux sensor, and the thermally insulated TI Box 1 remained unchanged.
During the morning preparation phase of the experiment, the experimental boxes and windows were briefly opened in order to adjust the initial thermal conditions of the indoor test volumes and to allow the vegetation-based shading element to be repositioned. After completion of these procedures, the windows and boxes were closed, and the subsequent natural overheating phase proceeded without any further intervention in the experimental setup. The key time points were as follows:
Opening of the TI boxes to stabilize the indoor conditions: 05:30 UTC (Coordinated Universal Time).
Relocation of the vegetation sample in front of the aluminium-framed window: 07:35 UTC (Coordinated Universal Time).
The timber window W2 and TI Box 2 remained unchanged in terms of experimental configuration during both analysed days. This variant was therefore used as a supplementary control for assessing the natural inter-day variability of the system.
2.7. Processing and Evaluation of the Measured Data
The measured data were processed to quantify the difference between the vegetation-shaded condition of the PVC window (VEGE) and the unshaded reference condition (REF). The different recording intervals of the individual measurement systems were considered during data evaluation. For the comparison of data from the METEO and S-R stations, the original 1-minute data from the METEO station were aggregated into 10-minute average values corresponding to the recording interval of the S-R station. The subsequent comparison was performed only for temporally matching measurement intervals. Similarly, direct comparisons of individual variables were based on time-synchronized measurement intervals. Prior to processing, the datasets were checked for temporal continuity and potential missing records.
The intensity of global solar radiation (GSR) was recorded in units of W/m2. For the energy assessment, the cumulative solar energy (H) was determined by discrete integration of the measured time series according to:
Where:
H - cumulative solar energy [MJ/m2],
GSRi - the global solar radiation at the (i)-th time step [W/m2],
Δti - the corresponding measurement interval [s].
For datasets recorded at 1-minute and 10-minute intervals, Δti was equal to 60 s and 600 s, respectively.
To characterize the overall outdoor climatic conditions, data from the permanent METEO meteorological station and the reference S-R station located on the roof of the pavilion laboratory were used. The local influence of vegetation-based shading on the solar exposure of the PVC window was evaluated using data from station S-W1, which remained in the same measurement position in front of the PVC window W1 during both analysed days.
The relative reduction in local cumulative solar energy due to vegetation-based shading was determined according to the following equation:
Where:
RH - relative reduction in local cumulative solar energy [%],
HREF - cumulative solar energy under the unshaded reference condition [MJ/m2],
HVEGE - cumulative solar energy under the vegetation-shaded condition [MJ/m2].
To account for the overall radiative load during the individual analysed days, the normalized local solar exposure index KGSR was used:
Where:
KGSR - normalized local solar exposure index [%],
HLOCAL - cumulative solar energy recorded at the local measurement position in front of the analyzed window [MJ/m2],
HMETEO - cumulative solar energy recorded by the reference METEO weather station over the same time interval [MJ/m2].
The parameter KGSR was used as a comparative indicator of local solar exposure relative to the overall outdoor radiative load. It does not represent the solar transmittance of the glazing itself.
The thermal response of the glazing was evaluated using surface temperatures recorded by thermocouples. From the measured data, the average, minimum, and maximum glazing surface temperatures, as well as the temperature amplitude, were determined. For the time-based comparison of the two experimental conditions, the temperature difference was calculated according to the following equation:
Where:
ΔT - temperature difference [K],
TVEGE - temperature under the vegetation-shaded condition [°C],
TREF - temperature under the unshaded reference condition [°C].
A negative value of ΔT indicates that the temperature under the vegetation-shaded condition was lower than under the unshaded reference condition. Conversely, a positive value indicates a higher temperature under the vegetation-shaded condition. Temperature differences were expressed in kelvins (K).
Heat flux density q through the glazing was recorded in units of W/m2. The positive heat flux direction was defined as heat flow towards the indoor experimental space. In addition to the instantaneous heat flux density values, the maximum value qMAX and the cumulative positive heat gain Q+ were also evaluated.
For a 1-minute measurement interval, the cumulative positive heat gain was calculated using only values of qi > 0, according to the following equation:
Where:
Q+ - cumulative positive heat gain [MJ/m2],
qi+ - positive heat flux density at the respective time step [W/m2].
The relative reduction in cumulative positive heat gain due to vegetation-based shading was determined according to the following equation:
Where:
RQ - relative reduction in cumulative positive heat gain [%],
QREF+ - cumulative positive heat gain under the unshaded reference condition [MJ/m2],
QVEGE+ - cumulative positive heat gain under the vegetation-shaded condition [MJ/m2].
To additionally account for minor differences in the overall solar load between the individual analyzed days, the normalized heat-gain index KQ was used:
Where:
KQ - nnormalized heat-gain index [%],
Q+ - cumulative positive heat gain through the glazing [MJ/m2],
HMETEO - cumulative solar energy recorded by the reference METEO weather station [MJ/m2].
The values of Q+ and HMETEO were always determined for the same time interval. The parameter KQ was used exclusively as a comparative normalized indicator between the individual experimental conditions and does not represent the solar factor or any other declared physical property of the window construction.
The temperature–humidity response of the indoor experimental environment was evaluated based on data from sensors located inside the TI boxes and in the surrounding laboratory environment. The evaluated parameters primarily included the average, minimum, and maximum air temperature, the temperature amplitude, and the temporal development of natural overheating within the closed experimental space. For the differential comparison, temporally corresponding values from the vegetation-shaded and reference days were evaluated using the previously defined relationship ΔT = TVEGE - TREF.
3. Results
3.1. Climatic Boundary Conditions and Selection of Representative Days
The implemented experimental setup represents a newly established research facility, the individual components of which were gradually completed during July 2026. Following completion of the experimental setup and commissioning of all measurement systems at the end of July 2026, the first week of August was selected as an initial period for identifying suitable climatic conditions for the comparative analysis.
From 1 to 6 August 2026, outdoor climatic conditions were monitored simultaneously using two independent reference systems. The first was the permanent meteorological station located in the meteorological garden within the pavilion laboratory site (METEO), while the second was the reference station S-R installed on the roof of the pavilion laboratory. The comparison between the two systems focused primarily on the temporal development of outdoor air temperature and global solar radiation (GSR). The aim was to verify the consistency of the climatic conditions recorded by both reference systems and, at the same time, to identify a pair of consecutive days characterized by the highest possible similarity in thermal and radiative loads. A comparison of the data recorded by both reference systems during the selection period is presented in Figure 7.
The air-temperature profiles recorded by the two reference systems showed very good agreement throughout the entire analysed period. The difference in average daily air temperature between METEO and S-R from 1 to 6 August ranged approximately from 0.0 to 1.8%. Greater variability was observed for global solar radiation, for which the differences between the two measurement locations ranged approximately from 1.0 to 9.4%. These differences can be associated with the different spatial positions of the measurement stations, their local surroundings, and differences in exposure conditions. Nevertheless, both systems captured the same overall pattern of meteorological development and enabled periods with similar daily thermal and solar loads to be clearly identified. Based on the multi-day comparison, two consecutive days, 4 and 5 August 2026, were selected for detailed experimental analysis. The temporal development of outdoor air temperature and global solar radiation during these two days is shown in Figure 8. Both days were characterized by very similar profiles of outdoor air temperature and global solar radiation, including a comparable onset of solar loading, similar timing of the daily maxima, and a subsequent decrease during the afternoon.
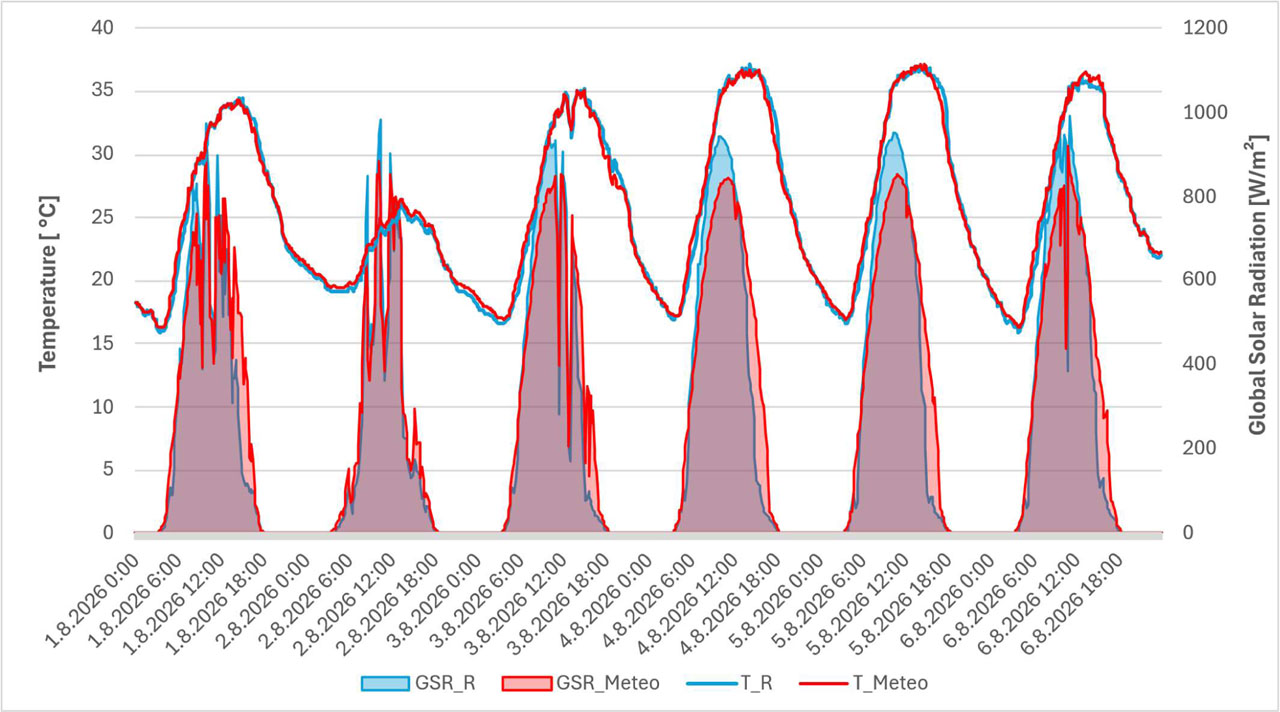
Figure 7:
The course of outdoor air temperature and global solar radiation recorded by the METEO and S-R reference systems between 1 and 6 August 2026
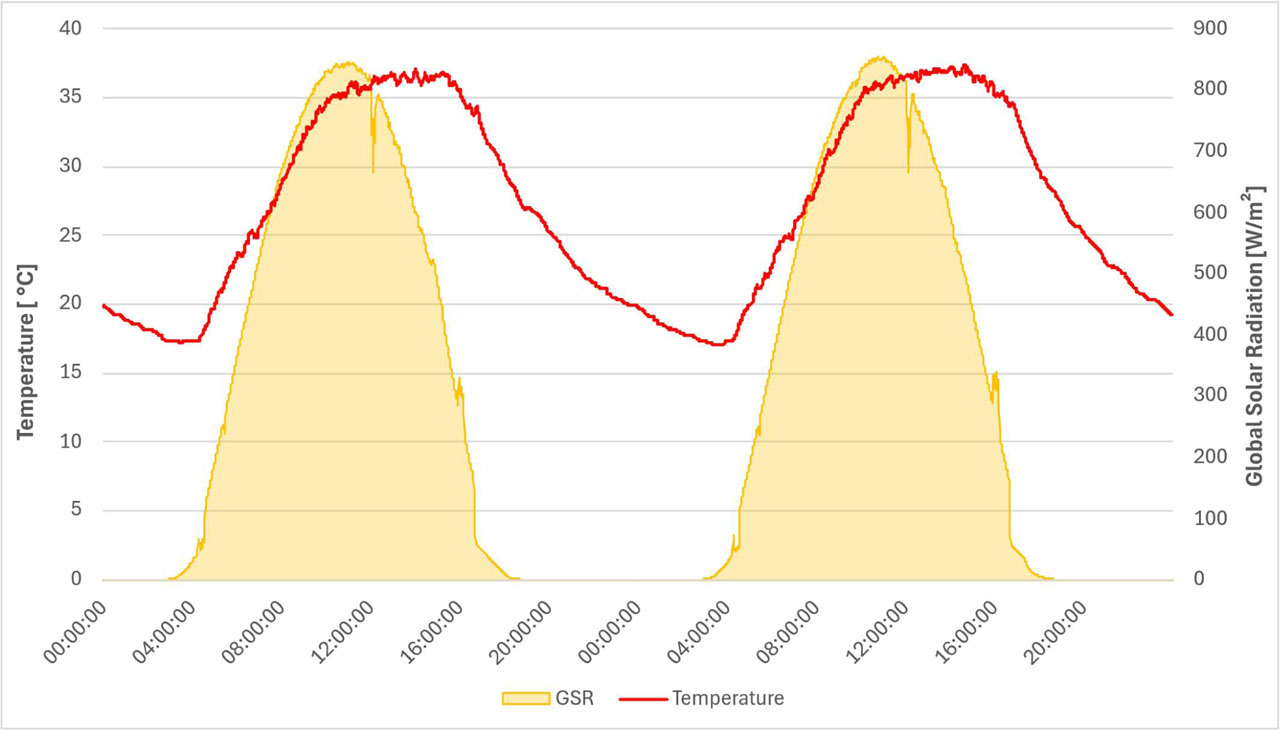
Figure 8:
The course of outdoor air temperature and global solar radiation recorded by the METEO weather station during the selected representative days, 4 and 5 August 2026
The METEO weather station recorded an average daily air temperature of 27.18 °C on 4 August and 27.27 °C on 5 August, corresponding to an inter-day difference of only 0.33%. The daily cumulative global solar energy reached 25.81 MJ/m2 and 25.58 MJ/m2, respectively, representing a difference of approximately 0.89% between the two days. The very high degree of similarity was also confirmed by the S-R reference measurements. The average daily air temperature was approximately 27.2 °C on both days, while the cumulative solar energy reached approximately 24.75 and 24.77 MJ/m2, respectively, representing virtually identical values.
3.2. Effect of Vegetation-Based Shading on the Solar and Thermal Response of Window W1
After confirming the high comparability of the overall meteorological conditions on 4 and 5 August 2026, the subsequent analysis focused on the local conditions in the immediate vicinity of the PVC window – W1. For this purpose, data from measuring station S-W1 were used. The station remained in the same measurement position in front of the window construction during both analyzed days. On 4 August, it was located in the space between the vegetation screen and the PVC window (VEGE), whereas on 5 August, after relocation of the vegetation element, it recorded the conditions in front of the unshaded window (REF).
3.2.1. Local Radiative and Microclimatic Conditions in Front of the Window
The average daily air temperature recorded by station S-W1 reached 27.73 °C under vegetation-shaded conditions and 27.90 °C under the reference condition. The difference between the average values was only approximately 0.6%, confirming very similar local thermal conditions during the two analysed days. The maximum air temperature reached 38.70 °C under the VEGE condition and 39.50 °C under the REF condition, while the minimum values were 17.00 and 16.90 °C, respectively.
More pronounced differences were observed in local solar exposure. The maximum global solar radiation recorded in front of the PVC window reached 442 W/m2 under the vegetation-shaded condition, whereas after removal of the vegetation screen it increased to 722 W/m2. The difference became even more pronounced when cumulative solar energy was evaluated. Under the vegetation-shaded condition, the value was H = 4.00 MJ/m2, whereas under the unshaded reference condition it reached H = 15.24 MJ/m2. According to the procedure described in Section 2.7, vegetation-based shading therefore reduced the local cumulative solar exposure in front of the PVC window by 73.80%. The difference between the two conditions remained substantial even after normalization of the local cumulative solar energy with respect to the reference radiative load recorded by the METEO weather station. The normalized local solar exposure index KGSR reached 15.49% under the vegetation-shaded condition, compared with 59.59% under the unshaded reference condition. These results indicate a pronounced change in the radiative conditions in the immediate vicinity of the glazing following removal of the vegetation screen. The temporal development of local air temperature and global solar radiation at the individual measurement positions, together with the reference meteorological conditions, is presented in Figure 9. Summary characteristics of the measurements at the PVC window are presented in Table 4.
Table 4:
Summary characteristics of the local microclimatic and radiative conditions in front of the window W1 under the VEGE and REF conditions
| Outdoor conditions | ||
|---|---|---|
| S-W1 | Plastic Window – W1 | |
| 4 August | 5 August | |
| Te,avr [°C] | 27.73 | 27.90 |
| GSRsum [W/m2] | 6662.00 | 25406.00 |
| H [MJ/m2] | 4.00 | 15.24 |
| Difference Te,avr [K] | −0.17 | |
| Relative reduction in local cumulative solar energy RH [%] | 73.80 | |
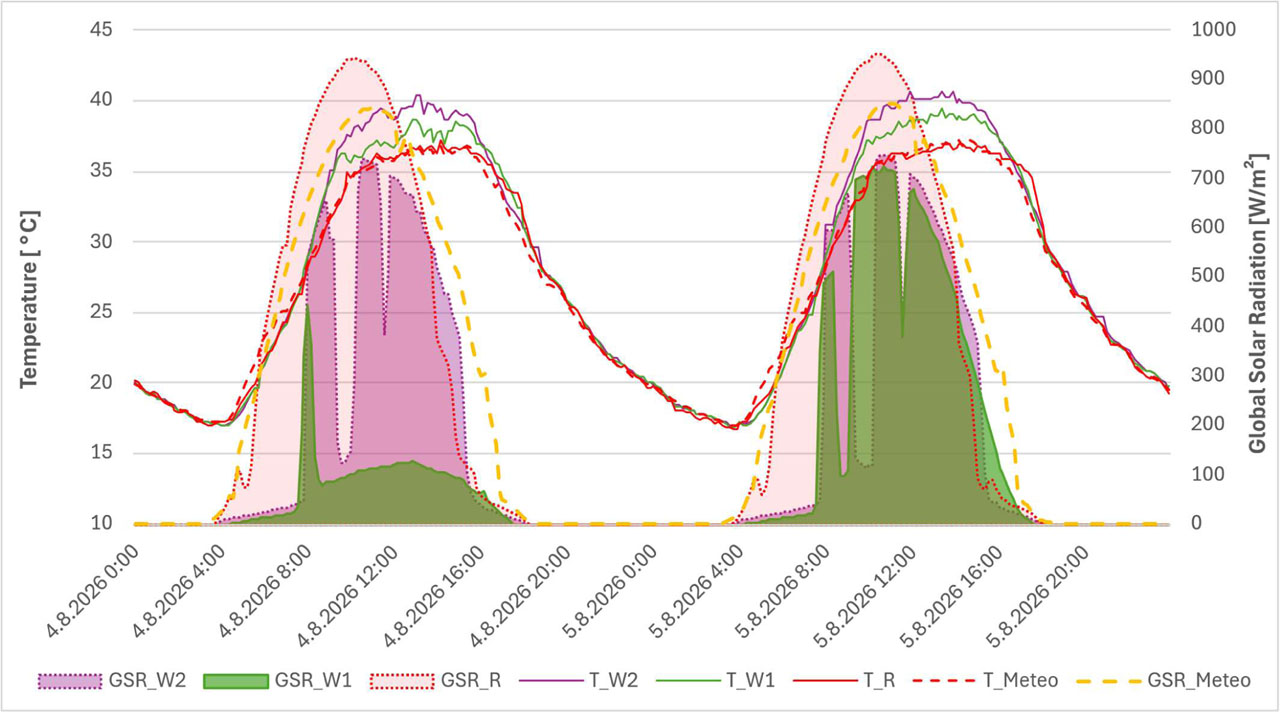
Figure 9:
Comparison of local thermal and radiative conditions at the monitored window constructions under the VEGE and REF conditions on 4 and 5 August 2026
3.2.2. Surface temperature of the glazing
Following the evaluation of the local radiative conditions in front of the window W1, the thermal response of the exterior glazing surface was analysed. Surface temperatures were recorded using multiple thermocouples positioned at different locations on the glazing, enabling both the temporal development and spatial variability of the temperature field to be monitored. The positions of the individual sensors are described in greater detail in Section 2.5.
Under the vegetation-shaded condition (VEGE) on 4 August, the average glazing surface temperature reached 29.31 °C, whereas under the unshaded reference condition (REF) on 5 August, a value of 30.07 °C was recorded. The vegetation-shaded condition therefore exhibited an average surface temperature approximately 0.76 K lower than the reference condition. A more pronounced difference was observed in the maximum surface temperatures. The maximum glazing surface temperature reached 46.68 °C under the VEGE condition, whereas under the REF condition it increased to 50.63 °C. The difference between the two experimental conditions was therefore 3.95 K in favour of the vegetation-shaded condition. Differences were also observed in the temperature amplitude. Under the vegetation-shaded condition, the glazing surface temperature amplitude was 28.57 K, whereas under the unshaded condition it reached 32.65 K. Vegetation-based shading thus reduced the daily range of glazing surface temperature by approximately 4.08 K.
The glazing surface-temperature results are consistent with the differences in local solar exposure recorded by station S-W1 and document the different thermal response of the same glazing under shaded and unshaded conditions. The basic temperature characteristics are summarized in Table 5.
Table 5:
Basic characteristics of the glazing surface temperature of W1 under the VEGE and REF conditions
| Temperature at the Glazing – Exterior | ||
|---|---|---|
| Thermocouples | Plastic Window – W1 | |
| 4 August | 5 August | |
| Ts,avr [°C] | 29.31 | 30.07 |
| Ts,max [°C] | 46.68 | 50.63 |
| Ts,ampl [K] | 28.57 | 32.65 |
| Difference Ts,avr [K] | −0.76 | |
| Difference Ts,max [K] | −3.95 | |
| Difference Ts,ampl [K] | −4.08 | |
3.2.3. Heat flux through the glazing
To assess the influence of vegetation-based shading on the thermal load of the transparent building component, the heat flux density through the glazing of the PVC window W1 was subsequently evaluated. The positive heat flux direction was defined as heat flow towards the indoor experimental space. For comparison of the two experimental conditions, the cumulative positive heat gain Q+ was determined according to the procedure described in Section 2.7.
Under the vegetation-shaded condition (VEGE) on 4 August, the cumulative positive heat gain reached 1.07 MJ/m2, whereas under the unshaded reference condition (REF) on 5 August, it reached 1.22 MJ/m2. The vegetation-shaded condition therefore resulted in a 12.30% reduction in cumulative positive heat gain through the glazing compared with the reference condition.
To account for the minor differences in the overall radiative load between the two analysed days, the normalized heat-gain index KQ was also evaluated. Its value reached 4.13% under the VEGE condition and 4.75% under the REF condition. The lower value of KQ under the vegetation-shaded condition confirms that the difference in cumulative positive heat gain remained evident even after normalization with respect to the reference solar energy.
The summary values of the energy-based heat-flow indicators through the W1 glazing under both experimental conditions are presented in Table 6.
3.2.4. Thermal response of TI Box 1
The thermal response of the indoor experimental space behind the window W1 was evaluated using air temperature and relative humidity recorded in TI Box 1. The temporal development was compared between the vegetation-shaded condition (VEGE) on 4 August and the unshaded reference condition (REF) on 5 August. At the same time, conditions in the immediate exterior vicinity of W1 and in the main space of the pavilion laboratory were also monitored.
During the morning of 5 August, the preparatory phase of the TI boxes described in Section 2.6 was carried out. After completion of this phase, TI Box 1 was closed, and the subsequent part of the measurement represented the natural overheating of the indoor experimental space caused by the solar and thermal load acting on window W1. The transient temperature drops and the corresponding change in relative humidity around 07:35 UTC resulted from the manual opening of window W1 during relocation of the vegetation-based shading element and should therefore be interpreted as a short-term experimental disturbance rather than as part of the natural thermal response of the closed TI Box 1. A comparison of the temporal development of the monitored parameters during both analysed days, together with the individual phases of the experimental procedure, is shown in Figure 10.
Under the vegetation-shaded condition, the maximum air temperature in TI Box 1 reached approximately 30.05 °C, whereas under the unshaded reference condition, a maximum value of approximately 31.18 °C was recorded. The maximum temperature of the indoor experimental space was therefore approximately 1.13 K lower under vegetation-based shading. The difference was also reflected in the overall range of the temperature response. The temperature amplitude in TI Box 1 reached approximately 7.87 K under the vegetation-shaded condition, compared with approximately 10.27 K under the unshaded condition. Under the VEGE condition, the temperature amplitude was therefore approximately 2.40 K lower, indicating a more moderate thermal response of the indoor experimental space (Table 7).
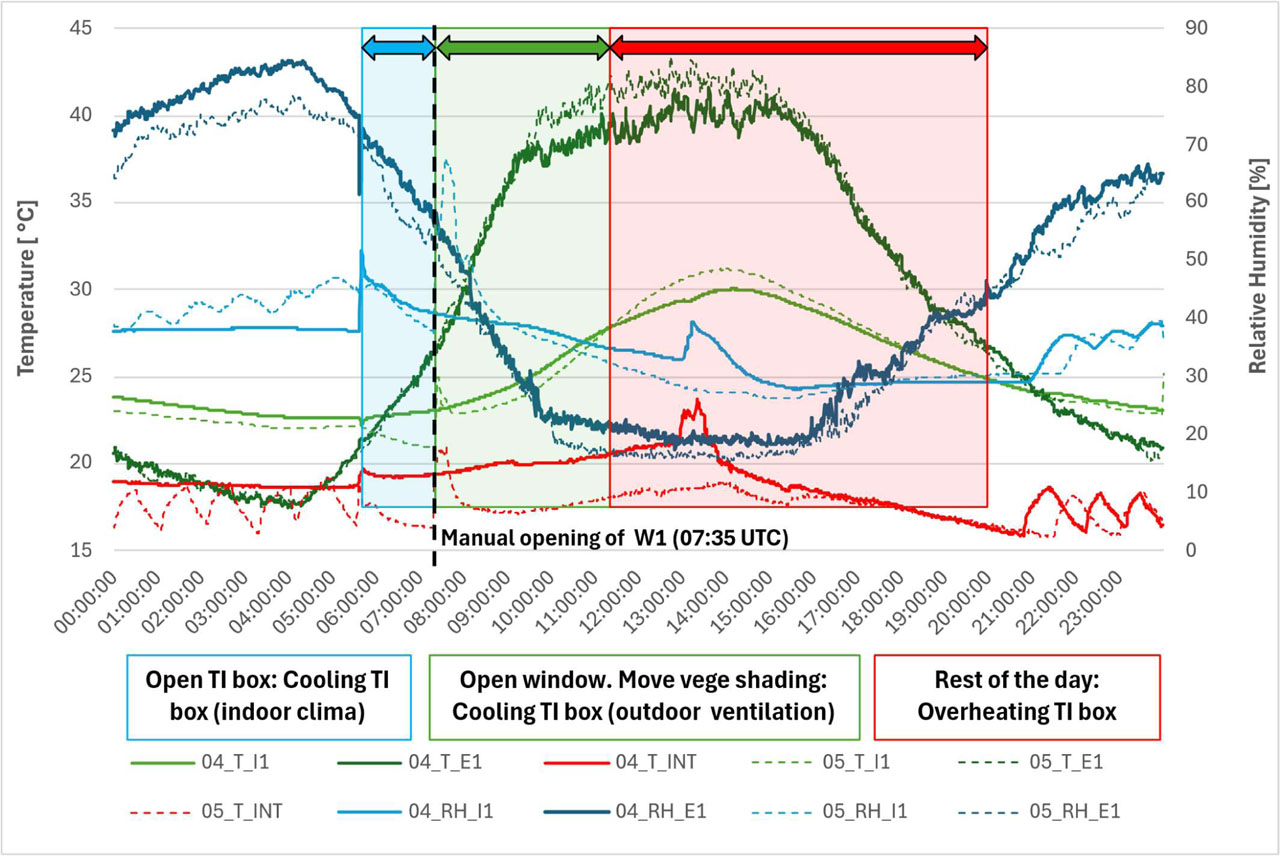
Figure 10:
Comparison of the temporal development of air temperature and relative humidity in TI Box 1, the local outdoor environment near W1, and the laboratory interior under the VEGE and REF conditions, with the individual phases of the experimental procedure indicated
Table 7:
Selected characteristics of the temperature response of TI Box 1 under the VEGE and REF conditions
| Parameter | VEGE: 4.8.2026 | REF: 5.8.2026 | Difference (VEGE-REF) |
|---|---|---|---|
| Maximum Temperature, Tmax [°C] | 30.05 | 31.18 | −1.13 K |
| Temperature Amplitude, ΔTamp [K] | 7.87 | 10.27 | −2.40 K |
The differential evaluation of air temperature and relative humidity between the VEGE and REF conditions, determined according to the relationship ΔT = TVEGE−TREF defined in Section 2.7, is shown in Figure 11. During the main phase of daytime overheating, ΔT was predominantly negative, indicating that the air temperature in TI Box 1 was lower under the vegetation-shaded condition than under the unshaded reference condition. The most pronounced differences occurred during periods of increased solar loading and the subsequent overheating of the closed experimental space.
The relative humidity in TI Box 1 exhibited a different temporal development on the two analyzed days, also in relation to changes in indoor air temperature. As relative humidity is strongly influenced by air temperature, it was used in this study primarily as a supplementary indicator of the state of the indoor experimental environment.
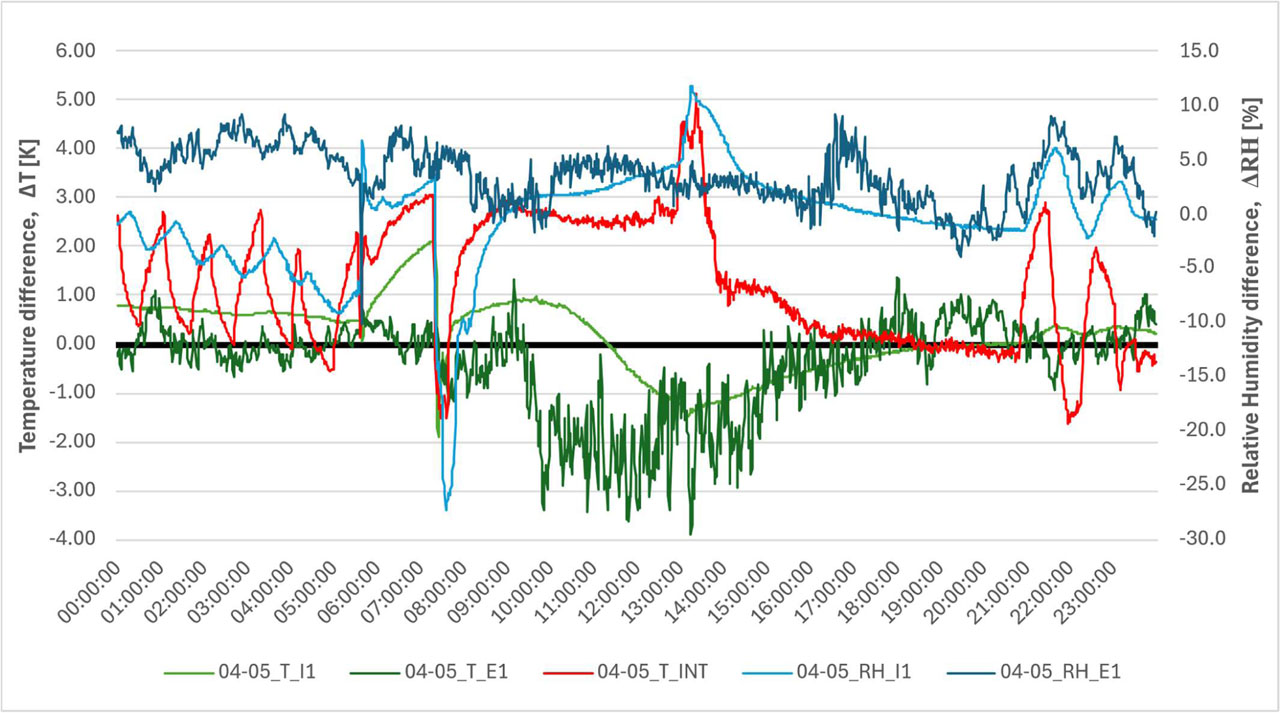
Figure 11:
Differential profiles of air temperature and relative humidity between the VEGE and REF conditions in TI Box 1, the local outdoor environment near W1, and the laboratory interior
3.3. Comparison of the Thermal Response of Windows W1 and W2
To provide a supplementary assessment of the thermal response of the experimental system, a direct comparison between the PVC window W1 and the timber window W2 was performed. While the experimental configuration of W1 changed between 4 and 5 August from the vegetation-shaded condition (VEGE) to the unshaded reference condition (REF), the configuration of the timber window W2 remained unchanged during both analysed days. Because W1 and W2 represent window constructions with different material and thermal-technical characteristics, their mutual comparison was not used to independently quantify the effect of vegetation-based shading. The main objective was to assess whether the change in the experimental condition of W1 between the two days resulted in a corresponding change in its thermal response relative to the unchanged W2 configuration.
3.3.1. Comparison of the thermal response of TI Boxes 1 and 2
On 4 August, when window W1 was shaded by the vegetation screen, the air temperature in TI Box 1 remained lower than that in TI Box 2 during the main phase of daytime overheating. The difference between the two indoor experimental spaces became particularly pronounced during the period of maximum daily solar loading. On 5 August, after removal of the vegetation-based shading from W1, the character of the thermal response of the two boxes changed. The temperature in TI Box 1 increased during the main overheating period, and the difference between TI Box 1 and TI Box 2 decreased compared with the previous day. During part of the afternoon period, the temperature in TI Box 1 reached values comparable to, or even higher than, those recorded in TI Box 2.
The comparability of the local boundary conditions at the control window W2 was also confirmed quantitatively. The average outdoor air temperature recorded by station S-W2 reached 28.13 °C on 4 August and 28.32 °C on 5 August, corresponding to a difference of approximately 0.70%. The cumulative solar energy reached 14.71 and 14.70 MJ/m2, respectively, representing virtually identical values with a difference of approximately 0.10%. The normalized local solar exposure index KGSR reached 57.00% and 57.45%, respectively. Thus, W2 was exposed to very similar local thermal and radiative conditions during both analysed days.
Despite the unchanged configuration of W2, a certain degree of natural inter-day variability in the thermal response of TI Box 2 was observed. The average air temperature reached 25.85 °C on 4 August and 24.85 °C on 5 August, while the corresponding maximum values were 31.62 and 30.26 °C. The temperature amplitude reached 8.65 K and 9.28 K, respectively. W2 was therefore not used as an identical reference condition, but rather as a supplementary control variant for assessing the natural inter-day variability of the system under practically unchanged local climatic conditions. A comparison of the temporal development of temperature–humidity conditions in TI Boxes 1 and 2, together with the local outdoor conditions at windows W1 and W2, is shown in Figure 12.
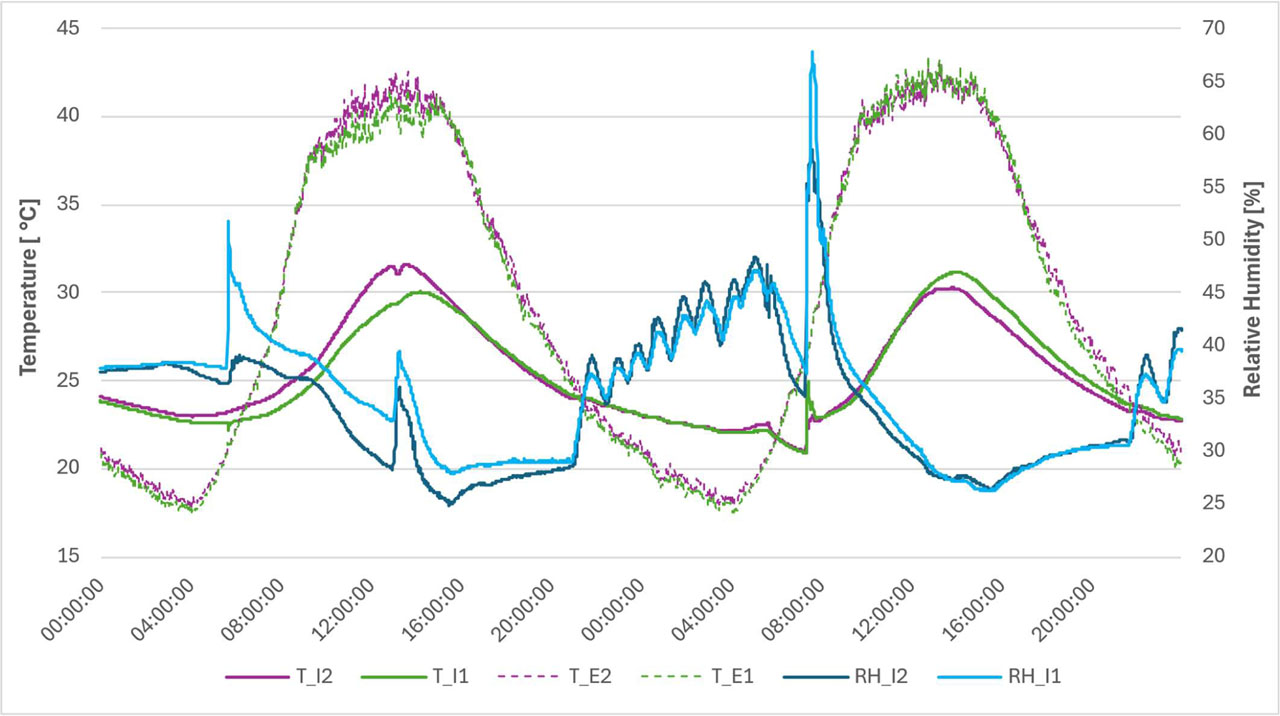
Figure 12:
Comparison of the temporal development of air temperature and relative humidity in TI Boxes 1 and 2, together with the local outdoor conditions at windows W1 and W2, on 4 and 5 August 2026
3.3.2. Comparison of Glazing Surface Temperatures and Heat Flux Density of W1 and W2
The comparison between W1 and W2 was subsequently extended to include glazing surface temperatures and heat flux density. Surface temperatures were recorded at multiple positions on the exterior glazing surface, while heat flux density was measured on the interior side of both window constructions.
On 4 August, vegetation-based shading of W1 resulted in a lower thermal response of its glazing compared with the unshaded W2. The difference was particularly evident during the main period of solar exposure, when higher glazing surface temperatures and a more pronounced positive heat flux towards the indoor experimental space were recorded at W2. After removal of the vegetation screen on 5 August, the response of W1 changed. During the period of maximum daily solar loading, both the glazing surface temperature and the heat flux density through W1 increased, with the change being particularly evident in the comparison of the heat-flux profiles between the two experimental conditions.
The energy response of the control window W2 showed a substantially smaller change between the two days. The cumulative positive heat gain, Q+ reached 1.25 MJ/m2 on 4 August and 1.30 MJ/m2 on 5 August, corresponding to an inter-day difference of approximately 4.00%. The normalized heat-gain index KQ changed only from 4.85% to 5.10%. These results are consistent with the nearly identical local solar exposure recorded at W2 and confirm the relatively stable energy response of the unchanged control variant during the two analysed days.
The relatively small inter-day change in the energy response of W2 supports the findings of the independent analysis of W1. The observed change in the thermal response of W1 between 4 and 5 August is consistent with the change in its experimental condition from vegetation-shaded (VEGE) to the unshaded reference condition (REF), while both the overall and local meteorological conditions remained very similar on the two days. A comparison of the temporal development of glazing surface temperatures and heat flux density through both monitored window constructions is shown in Figure 13.
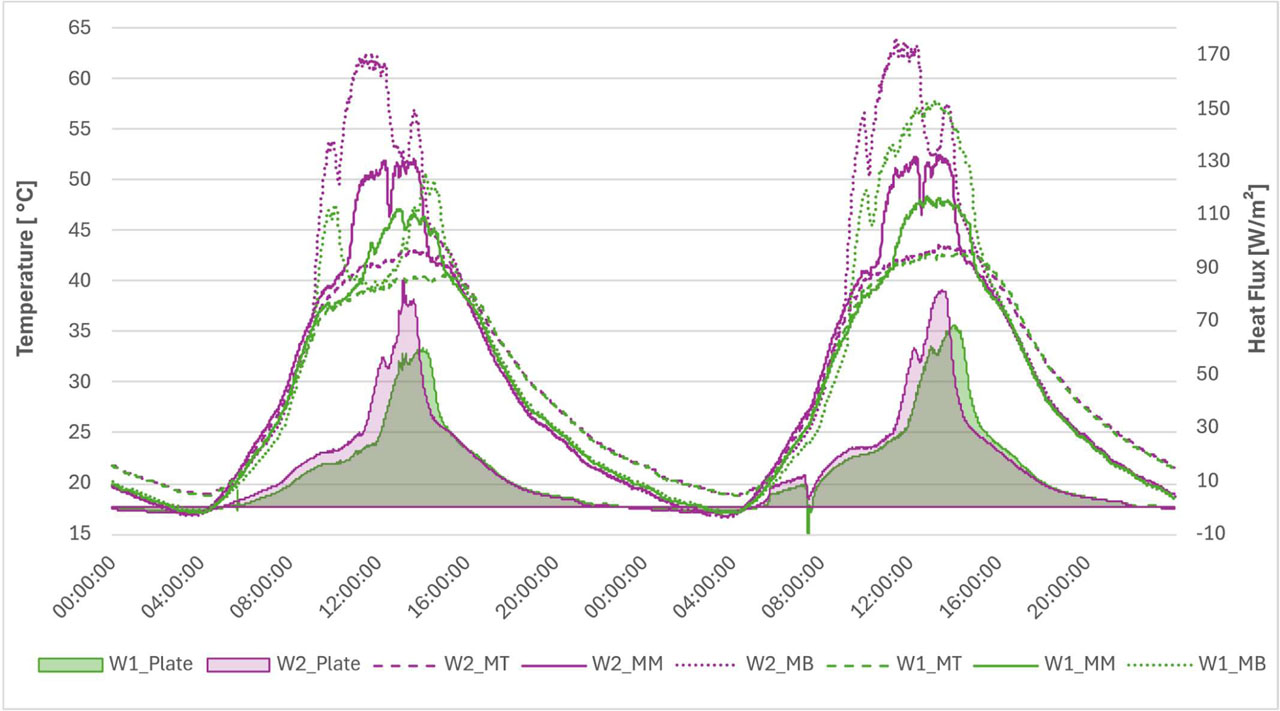
Figure 13:
A comparison of the time-dependent surface temperatures of the glazing and the heat flux density through windows W1 and W2 on 4 and 5 August 2026
4. Discussion
4.1. Effect of Vegetation-Based Shading on Solar and Thermal Response
The results of the experimental comparison indicate a consistent effect of vegetation-based external shading across the individual levels of the thermal response of the monitored system. Given the high similarity of the meteorological conditions on 4 and 5 August 2026, the differences recorded at window W1 can be assessed under very similar external thermal and radiative loads. The average daily outdoor air temperature differed by only 0.33% between the two analysed days, while the difference in daily global solar energy was approximately 0.89%. The most pronounced change was observed in the local solar exposure in front of W1, where the cumulative solar energy decreased from 15.24 MJ/m2 under the REF condition to 4.00 MJ/m2 under the VEGE condition, corresponding to a reduction of approximately 73.80%. This result demonstrates the pronounced shading function of the vegetation element, which substantially reduced the total shortwave radiative load in the immediate vicinity of the glazing.
An interesting difference was also observed between the thermal and radiative conditions at the reference roof position and those in the immediate vicinity of the window constructions. As can be noticed from Figure 9, during periods of high solar loading, the air temperature in front of the transparent part of the façade reached higher values than those recorded by the reference station S-R, despite the locally measured solar radiation being approximately 200–250 W/m2 lower at S-W2. This difference indicates the formation of a specific microclimate in the immediate vicinity of the transparent façade component and may be associated with the thermal response of the solar-heated glazing and surrounding surfaces. Its development may be influenced by convective heat transfer from heated surfaces, together with local shortwave and longwave radiative exchange. As a result, the air temperature directly adjacent to the window construction may become noticeably higher than that in the free outdoor environment. From a practical perspective, this also suggests that during hot and sunny periods, the temperature of air entering through an open window may not correspond to the air temperature in the unobstructed outdoor environment but may instead be influenced by the locally overheated zone adjacent to the façade.
The reduced solar exposure was subsequently reflected in the thermal response of the glazing itself. The maximum surface temperature of W1 reached 46.68 °C under the VEGE condition, whereas under the REF condition it increased to 50.63 °C, corresponding to a difference of 3.95 K. The glazing temperature amplitude was also 4.08 K lower under vegetation-based shading. The change in radiative and surface-temperature response was further reflected in the heat flux through the glazing. The cumulative positive heat gain, Q+ reached 1.07 MJ/m2 under the vegetation-shaded condition and 1.22 MJ/m2 under the reference condition, corresponding to a reduction of approximately 12.30%. The substantially smaller percentage reduction in Q+ compared with the reduction in solar exposure is physically expected, since the heat flux measured on the interior side of the glazing represents the resulting thermal response influenced not only by incident solar radiation, but also by its absorption within the glazing, conductive heat transfer, convective and longwave radiative exchange, and the thermal inertia of the construction.
The effect of vegetation-based shading was ultimately also reflected in the temperature response of the indoor experimental space. The maximum air temperature in TI Box 1 reached 30.05 °C under the VEGE condition and 31.18 °C under the REF condition, meaning that vegetation-based shading reduced the maximum temperature by 1.13 K. At the same time, the temperature amplitude decreased from 10.27 K to 7.87 K, corresponding to a difference of 2.40 K.
The results therefore form a consistent sequence of the thermal response of the system: reduced solar exposure in front of the window → lower glazing surface temperature → lower positive heat gain → more moderate overheating of the indoor experimental space.
4.2. Experimental Design and Reliability of the Observed Shading Effect
An important aspect in the interpretation of the results is the design of the experimental setup itself. The movable vegetation-based system enabled the condition of W1 to be changed between the vegetation-shaded variant (VEGE) and the unshaded reference variant (REF) without altering the window itself, the position of the indoor sensors, or the geometry of TI Box 1. Thus, the fundamental properties of the transparent building component and the measurement system remained unchanged during the comparison, while the principal experimental modification consisted of relocating the vegetation screen. The reliability of the comparison was further supported by the high degree of agreement between the meteorological conditions independently recorded by the METEO and S-R systems.
Additional control was provided by the timber window W2, whose configuration remained unchanged during both analysed days. The cumulative solar energy recorded at this position reached 14.71 and 14.70 MJ/m2, while the average outdoor air temperature changed only from 28.13 to 28.32 °C. The energy response of the window itself was similarly stable. The cumulative positive heat gain Q+ reached 1.25 and 1.30 MJ/m2, corresponding to an inter-day difference of approximately 4%, while the normalized heat-gain index, KQ changed from 4.85% to 5.10%. Despite the practically unchanged local radiative conditions, a certain degree of natural inter-day variability was observed in TI Box 2. The average air temperature changed from 25.85 to 24.85 °C, the maximum temperature from 31.62 to 30.26 °C, and the temperature amplitude from 8.65 to 9.28 K. This response indicates that even under very similar outdoor conditions, completely identical temperature profiles cannot be expected in full-scale experimental measurements conducted under real climatic conditions. Such a relatively small inter-day variation for the unchanged W2 configuration provides additional support for the interpretation of the more pronounced change in the response of W1 following removal of the vegetation-based shading.
When interpreting the results, the morning preparatory phase of the experiment should also be taken into account, as its influence is clearly visible in the temporal profiles presented in Figure 10. On 5 August at 05:30 UTC, the openings of the TI boxes were opened in order to equalize the initial conditions within the indoor experimental spaces with those of the pavilion laboratory. The subsequent air exchange and mixing resulted in a pronounced decrease in the temperature of TI Box 1. The local increase in temperature recorded at 07:35 UTC corresponds to the opening of the window construction during the manual relocation of the vegetation-based shading sample to the neighbouring aluminium-framed window. During this interval, the air temperature in TI Box 1 temporarily approached the outdoor conditions. After completion of the manipulation, both the window and TI Box 1 were closed again, and the subsequent phase of the experiment represented the natural overheating of the enclosed experimental space without any further intervention in the measurement setup.
Overall, the interpretation of the observed effect of vegetation-based shading is supported by a combination of three elements of the experimental design: comparison of the same W1 under two different conditions, the high similarity of the meteorological conditions, and the unchanged W2 configuration as a supplementary control variant. The recorded changes in W1 therefore show a consistent relationship with the change between the VEGE and REF conditions, although, given the nature of the short-term in-situ experiment, it is not possible to completely isolate all factors influencing the resulting thermal balance.
4.3. Comparison with Previous Studies and Practical Implications
The results of the presented experiment are consistent with the generally observed ability of vertical vegetation to reduce the solar load acting on building components. The recorded 73.80% reduction in local solar exposure is in line with findings from previous experiments on vegetation-based window shading. Ip et al., (2010) demonstrated a pronounced nonlinear decrease in solar transmissivity with an increasing number of leaf layers, with the average transmissivity decreasing from 0.45 for a single leaf layer to 0.12 for five layers. These findings indicate a distinctly nonlinear relationship between vegetation-layer density and the amount of solar radiation transmitted through the vegetation screen. Zheng et al., (2020), using a movable vegetation-based shading system with 80% vegetation coverage, reported a shading coefficient of 0.28. Although these parameters are not methodologically identical to the reduction in cumulative solar energy used in the present study, the findings collectively confirm the high potential of vegetation screens to reduce the radiative load on transparent building components. This mechanism is also supported by the synthesis presented by Su et al., (2024), according to which shading represents one of the principal mechanisms governing the thermal effect of vertical greenery, with its contribution potentially being approximately twice that of evapotranspiration.
In the present experiment, the reduced solar exposure was accompanied by a 3.95 K decrease in the maximum glazing surface temperature. A similar general trend of reduced surface temperatures has also been well documented for vegetation systems applied to opaque façades. However, the absolute values cannot be directly compared with glazing because of the different optical and thermophysical properties of transparent and opaque building components. The relevance of these studies to the present experiment therefore lies primarily in confirming the same overall trend: the effect of vegetation-based shading becomes more pronounced under high solar loads and is influenced by the density and condition of the vegetation.
The differences between individual studies become even more pronounced when heat flux is evaluated. In the present experiment, the cumulative positive heat gain Q+ through W1 decreased from 1.22 to 1.07 MJ/m2, corresponding to a reduction of approximately 12.30%. Zheng et al., (2020) reported a reduction in the average heat flux through the glazing of as much as 64.84% at 80.00% vegetation coverage, from 98.7 to 34.7 W/m2. This substantially greater effect, however, was achieved for west-facing single 6 mm glazing with an SHGC of 0.82 and a solar transmittance of 0.93. By contrast, W1 in the present experiment consists of modern insulating triple glazing with a solar factor of g = 0.54 and a declared Uw value of 0.74 W/(m2·K). A direct numerical comparison of the two reductions is also limited by differences in the method of heat-flux evaluation, the analysed time interval, and the experimental conditions. The smaller relative reduction in Q+ therefore does not necessarily indicate a lower effectiveness of the vegetation screen itself but may instead be related to the substantially lower initial solar heat gain through the thermally more efficient glazing.
Findings more closely comparable to the present study were reported by Ren et al., (2024), who observed a 25.80% reduction in heat flux through the affected part of the glazing in buildings with integrated window greenery and an approximately 11% reduction in total heat gain through the monitored part of the building envelope. Their analysis also indicated an approximately 88% reduction in the radiative component of heat transfer. These findings support the observation that a substantial reduction in incident solar energy does not necessarily lead to an equally large reduction in the resulting heat flux. Heat transfer through glazing results from a combination of radiative and temperature-driven components, whose relative contributions vary depending on the glazing system and the boundary conditions.
The thermal effect was also evident within the indoor experimental space, where vegetation-based shading reduced the maximum air temperature in TI Box 1 by 1.13 K. Ren et al., (2024) likewise reported an approximately 1 K reduction in local outdoor air temperature in the presence of window-integrated vegetation, together with an increase in relative humidity of approximately 10%. These findings further support the importance of the local microclimate surrounding vegetation, the specific characteristics of which depend on the geometry of the system, radiative load, airflow conditions, and the water regime of the plants.
From a practical perspective, the results support the use of vegetation as an external shading element for transparent building components, with particular potential for systems that allow a certain degree of adaptability. The concept of movable vegetation-based shading has already been experimentally investigated by Zheng et al., (2020), indicating broader interest in systems that enable the position or degree of window shading to be adjusted. The mobility of the system used in the present study should therefore be understood primarily as an advantage of the experimental design, enabling a controlled comparison of the same window under shaded and unshaded conditions. At the same time, it also indicates the potential for further development of adaptive vegetation-based shading elements, whose practical application will require consideration of thermal performance, operational reliability, and the dynamic nature of vegetation.
4.4. Limitations and Future Research
The main limitation of the present study is the short-term nature of the direct comparison between the VEGE and REF conditions. The evaluation was based on two consecutive days characterized by very similar meteorological conditions. This arrangement made it possible to limit the influence of differing boundary conditions and to identify the immediate response of the system to the change in shading. However, the results cannot be generalized to the entire summer period or to an annual cycle without further verification. Previous studies have also highlighted the dynamic nature of vegetation-based shading in relation to plant growth, vegetation density, and seasonal development. Future measurements should therefore include a larger number of repeated VEGE/REF experiments under different levels of solar loading, followed by a longer-term seasonal assessment.
A further limitation is the absence of a quantitative characterization of vegetation coverage, as the experimental vegetation sample was still young and at an early stage of development. During the initial operating period, the sample was regularly irrigated and fertilized, and its thermal performance therefore reflects the specific condition of the vegetation during the analysed period. Previous studies have demonstrated a pronounced dependence of solar transmissivity on the number of leaf layers and vegetation coverage, with this relationship being nonlinear. In the next phase of the research, the vegetation screen should therefore be regularly characterized using parameters such as the coverage ratio, number of leaf layers, or Leaf Area Index (LAI). This would make it possible to relate changes in thermal performance to the development of the vegetation itself.
In the present study, evapotranspiration processes and the influence of the vegetation water regime were not quantified separately. The results therefore represent the overall effect of the vegetation element, with the change in solar exposure being the primary mechanism directly captured by the measurements. Future experiments should therefore include monitoring of substrate moisture, irrigation water supply, and, where possible, additional parameters enabling evapotranspiration to be estimated. Such measurements would allow the direct shading effect to be distinguished more clearly from additional evaporative cooling, the magnitude of which depends on the water status of the vegetation.
Finally, the presented results represent a specific south-facing experimental façade, one principal window construction (W1), and a particular geometry of the vegetation-based shading system. Future research should therefore progressively verify the performance of the system for different glazing types, vegetation densities, geometrical configurations, and distances between the vegetation screen and the transparent building component. A further limitation concerns the spatial representativeness of the heat-flux measurement, since the local sensor captures the response only at a selected area of the glazing, whereas the vegetation screen may produce spatially non-uniform shading. In future experiments, it would therefore be beneficial to extend the measurement system to include multi-point heat-flux monitoring across the glazing surface.
The movable character of the experimental system provides a suitable basis for such comparative measurements and, it enables further investigation of adaptive vegetation-based shading concepts as well. Current developments in Vertical Greenery Systems (VGS) likewise point towards the growing importance of modular systems that allow flexible installation, maintenance, and adaptation to changing conditions.
5. Conclusion
The aim of this study was to design, implement, and experimentally validate a movable vegetation-based external shading system for a transparent building component under real climatic conditions. The proposed solution enabled the same window W1 to be compared under a vegetation-shaded condition (VEGE) and an unshaded reference condition (REF) without changing the window construction itself, the position of the indoor sensors, or the geometry of the experimental space. Based on the experimental comparison, the following main conclusions can be formulated:
The vegetation screen substantially reduced the local solar exposure in front of the transparent building component. The cumulative solar energy decreased from 15.24 MJ/m2 under the REF condition to 4.00 MJ/m2 under the VEGE condition, corresponding to a reduction of 73.80%.
The reduced radiative load was reflected in the glazing surface temperature. The maximum surface temperature of W1 was 3.95 K lower under vegetation-based shading, while the daily glazing temperature amplitude decreased by 4.08 K.
Vegetation-based shading reduced the heat gain through the glazing. The cumulative positive heat gain decreased from 1.22 to 1.07 MJ/m2, corresponding to a reduction of approximately 12.3%. The smaller relative reduction compared with solar exposure indicates a progressive attenuation of the influence of the incident radiative load as heat is transferred through the window construction.
The effect of vegetation-based shading was also identifiable within the indoor experimental space. The maximum air temperature in TI Box 1 was 1.13 K lower under the VEGE condition, while the temperature amplitude decreased by 2.40 K.
The results demonstrate a consistent sequence of effects associated with vegetation-based shading, beginning with the reduction of solar exposure in front of the window, followed by lower glazing surface temperatures and reduced heat gain, and ultimately resulting in a more moderate thermal response of the indoor experimental space. At the same time, the findings show that a substantial reduction in incident solar energy does not necessarily translate into an equally large percentage reduction in heat flux through modern insulating glazing, since the resulting thermal response is governed by multiple heat-transfer and heat-storage mechanisms.
The implemented experimental setup provides a basis for further long-term assessment of vegetation-based shading of transparent building components. Future research will focus primarily on repeated experiments under different climatic conditions, quantification of vegetation coverage and its seasonal development, evaluation of the influence of the vegetation water regime and evapotranspiration, and verification of the system performance for additional configurations of transparent building components. The mobility of the proposed system also enables its use as an experimental platform for the development and evaluation of adaptive vegetation-based shading solutions.
Acknowledgements
This research was funded by Slovak Scientific Grant Agency (VEGA) with grant number 1/0404/24.
Notes
[1] Contributed by Author Contributions
M.CH., M.B. designed the study and supervised the project. M.CH., M.P., M.B., P.K. conducted the experiments. M.CH. performed the data analysis. M.CH., M.P. contributed to manuscript writing. All authors critically reviewed and approved the final version of the manuscript and agreed to be accountable for all aspects of the work.