

Table 1:
Respondent characteristics
| Variable | Category | Frequency [n] | Percentage [%] |
|---|---|---|---|
| Gender | Male | 145 | 68.4 |
| Female | 67 | 31.6 | |
| Age | <25 years | 20 | 9.4 |
| 25–34 years | 70 | 33.0 | |
| 35–44 years | 60 | 28.3 | |
| 45–54 years | 49 | 23.1 | |
| >55 years | 13 | 6.1 | |
| Education level | High school / Vocational school | 25 | 11.8 |
| Associate degree | 37 | 17.5 | |
| Bachelor's degree | 95 | 44.8 | |
| Master's degree | 50 | 23.6 | |
| Doctorate | 5 | 2.4 | |
| Position | Board of directors / Senior management | 43 | 20.3 |
| Manager | 32 | 15.1 | |
| Supervisor / Engineer / Architect | 36 | 17.0 | |
| Technical / Operational staff | 33 | 15.6 | |
| Non-technical staff | 31 | 14.6 | |
| Consultant/Project-based | 37 | 17.5 | |
| Years of service | 1–3 years | 82 | 38.7 |
| 4–7 years | 44 | 20.8 | |
| 8–12 years | 39 | 18.4 | |
| >12 years | 47 | 22.2 |
Table 1:
Descriptive overview of sustainability constructs
| Construct | Number of initial indicators | Observed mean range | General response | Interpretation |
|---|---|---|---|---|
| Corporate Social Responsibility (CSR) | 8 | 4.18–4.40 | Somewhat agree | Positive perception of CSR practices |
| Green Investment (GI) | 5 | 3.85–4.22 | Somewhat agree | Positive perception of environmental investment practices |
| Green Marketing (GM) | 4 | 3.98–4.12 | Somewhat agree | Positive perception of sustainability-oriented marketing practices |
| Business Performance (BP) | 5 | 4.18–4.39 | Somewhat agree | Positive perception of organizational performance |
Table 3:
Factor loadings, reliability, and convergent validity
| Construct | Indicator | Standardized loading | Cronbach’s α | Composite Reliability (CR) | Average Variance Extracted (AVE) |
|---|---|---|---|---|---|
| Green Investment (GI) | GI1 | 0.845 | 0.871 | 0.884 | 0.718 |
| GI2 | 0.880 | ||||
| GI3 | 0.823 | ||||
| Green Marketing (GM) | GM1 | 0.774 | 0.832 | 0.866 | 0.618 |
| GM2 | 0.801 | ||||
| GM3 | 0.766 | ||||
| GM4 | 0.795 | ||||
| Corporate Social Responsibility (CSR) | CSR1 | 0.847 | 0.935 | 0.932 | 0.663 |
| CSR2 | 0.815 | ||||
| CSR3 | 0.781 | ||||
| CSR4 | 0.775 | ||||
| CSR6 | 0.817 | ||||
| CSR7 | 0.857 | ||||
| CSR8 | 0.824 | ||||
| Business Performance (BP) | BP1 | 0.873 | 0.908 | 0.912 | 0.721 |
| BP2 | 0.891 | ||||
| BP4 | 0.801 | ||||
| BP5 | 0.830 |
Table 2:
Goodness-of-fit indices of the structural model
| Goodness-of-fit index | Recommended value | Model result | Evaluation |
|---|---|---|---|
| Chi-square (χ2) | As low as possible | 120.071 | Good fit |
| Probability (p-value) | ≥ 0.05 | 0.723 | Good fit |
| CMIN/DF | ≤ 2.00 | 0.924 | Good fit |
| GFI | ≥ 0.90 | 0.943 | Good fit |
| AGFI | ≥ 0.90 | 0.925 | Good fit |
| TLI | ≥ 0.95 | 1.004 | Good fit |
| CFI | ≥ 0.95 | 1.000 | Good fit |
| IFI | ≥ 0.95 | 1.000 | Good fit |
| RMSEA | ≤ 0.08 | 0.002 | Good fit |
| RMR | ≤ 0.08 | 0.025 | Good fit |
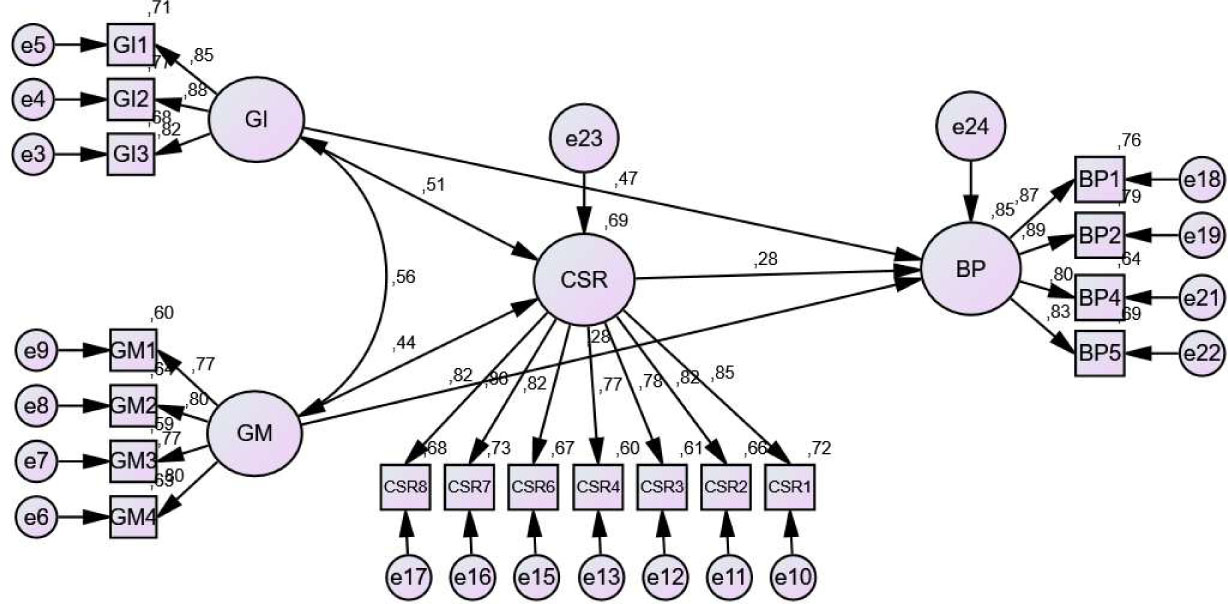
Figure 1:
Final structural model
Table 3:
Structural relationships and hypothesis testing
| Hypothesis | Structural relationship | Standardized β | C.R. | p-value | Decision |
|---|---|---|---|---|---|
| H1 | Green investment → Corporate social responsibility | 0.505 | 10.587 | <0.001 | Supported |
| H2 | Green investment → Business performance | 0.473 | 10.587 | <0.001 | Supported |
| H3 | Green marketing → Corporate social responsibility | 0.437 | 6.423 | <0.001 | Supported |
| H4 | Green marketing → Business performance | 0.281 | 4.330 | <0.001 | Supported |
| H5 | Corporate social responsibility → Business performance | 0.283 | 3.702 | <0.001 | Supported |