

Table 1:
Comparison of existing studies and proposed framework
| Study | CFD data | Deep learning model | Physics-informed learning | Rapid prediction | Multi-directional wind |
|---|---|---|---|---|---|
| Wu & Snaiki (2022) | ✓ | CNN | ✗ | ✓ | ✗ |
| Fernández-Cabán et al. (2018) | ✓ | ANN | ✗ | ✓ | ✗ |
| Nav et al. (2025) | ✓ | LSTM | ✗ | ✓ | ✗ |
| Kim et al. (2024) | LES | – | ✗ | ✗ | ✓ |
| Huang et al. (2007) | LES | – | ✗ | ✗ | ✓ |
| Cai & Wang (2024) | ✗ | – | ✓ | ✗ | ✗ |
| Proposed framework | ✓ | Physics-informed deep learning (PINN) | ✓ | ✓ | ✓ |
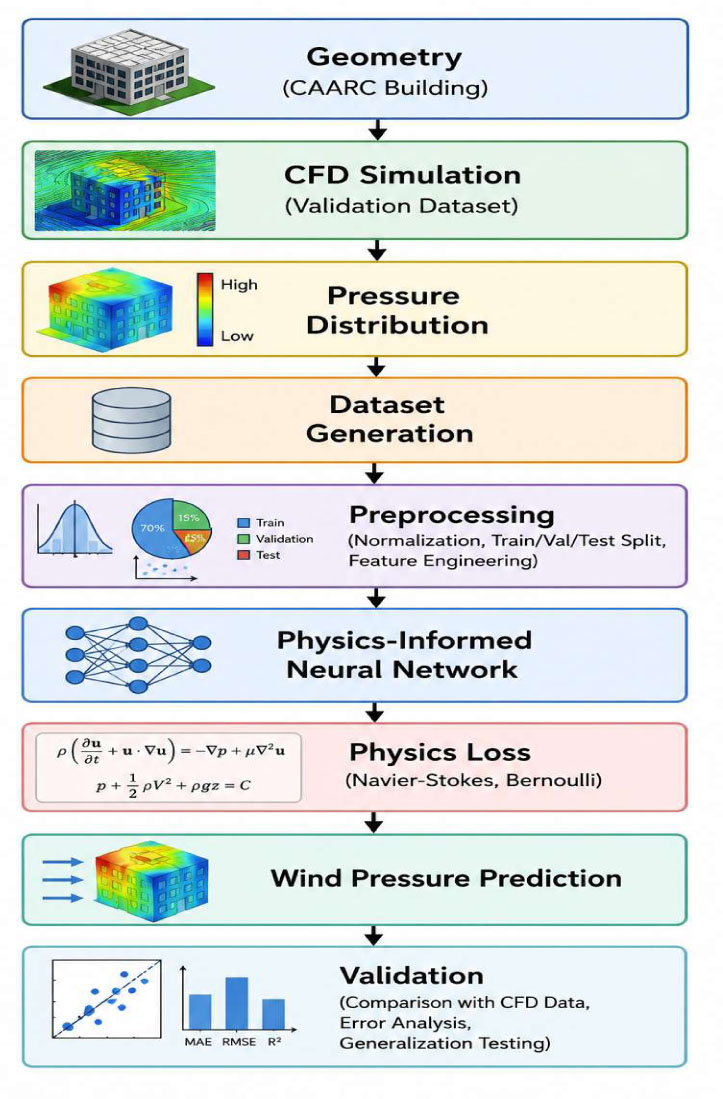
Figure 1:
Overall framework workflow
Table 2:
Mesh independence analysis based on mean stagnation-point pressure coefficient
| Mesh size [106 cells] | Cp (Stagnation) | Change from previous |
|---|---|---|
| 1.5 | 0.82 | - |
| 3.2 | 0.89 | +8.5% |
| 5.8 | 0.93 | +4.5% |
| 8.0 | 0.95 | +2.1% |
| 12.5 | 0.95 | 0.0% |
Table 3:
Comparison of predicted mean pressure coefficients with CAARC wind tunnel benchmark data at mid-height (z/H = 0.5) and 0° wind incidence
| Face | Present study [Cp] | CAARC benchmark [Cp] | Difference [%] |
|---|---|---|---|
| Windward | 0.95 | 0.94 | +1.1% |
| Leeward | −0.52 | −0.50 | +4.0% |
| Side (Suction) | −0.78 | −0.80 | −2.5% |
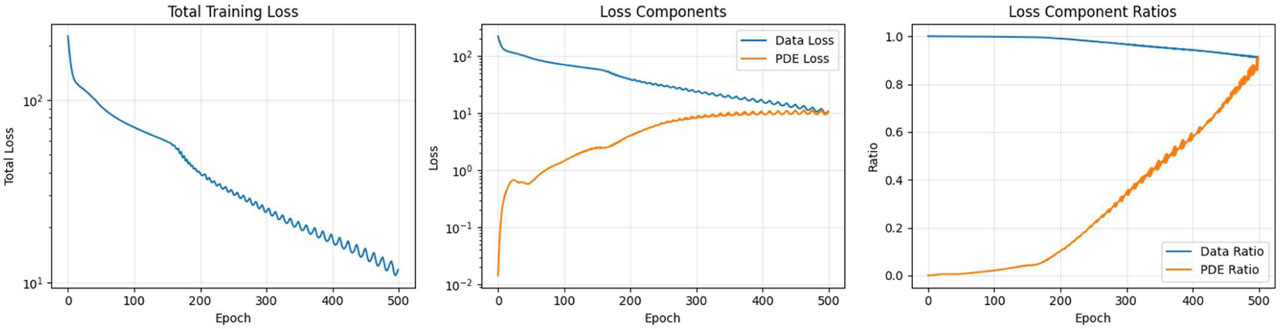
Figure 2:
Training history of physics-informed neural network: (a) Total training loss, (b) Loss components (Data loss and PDE loss), (c) Loss component ratios
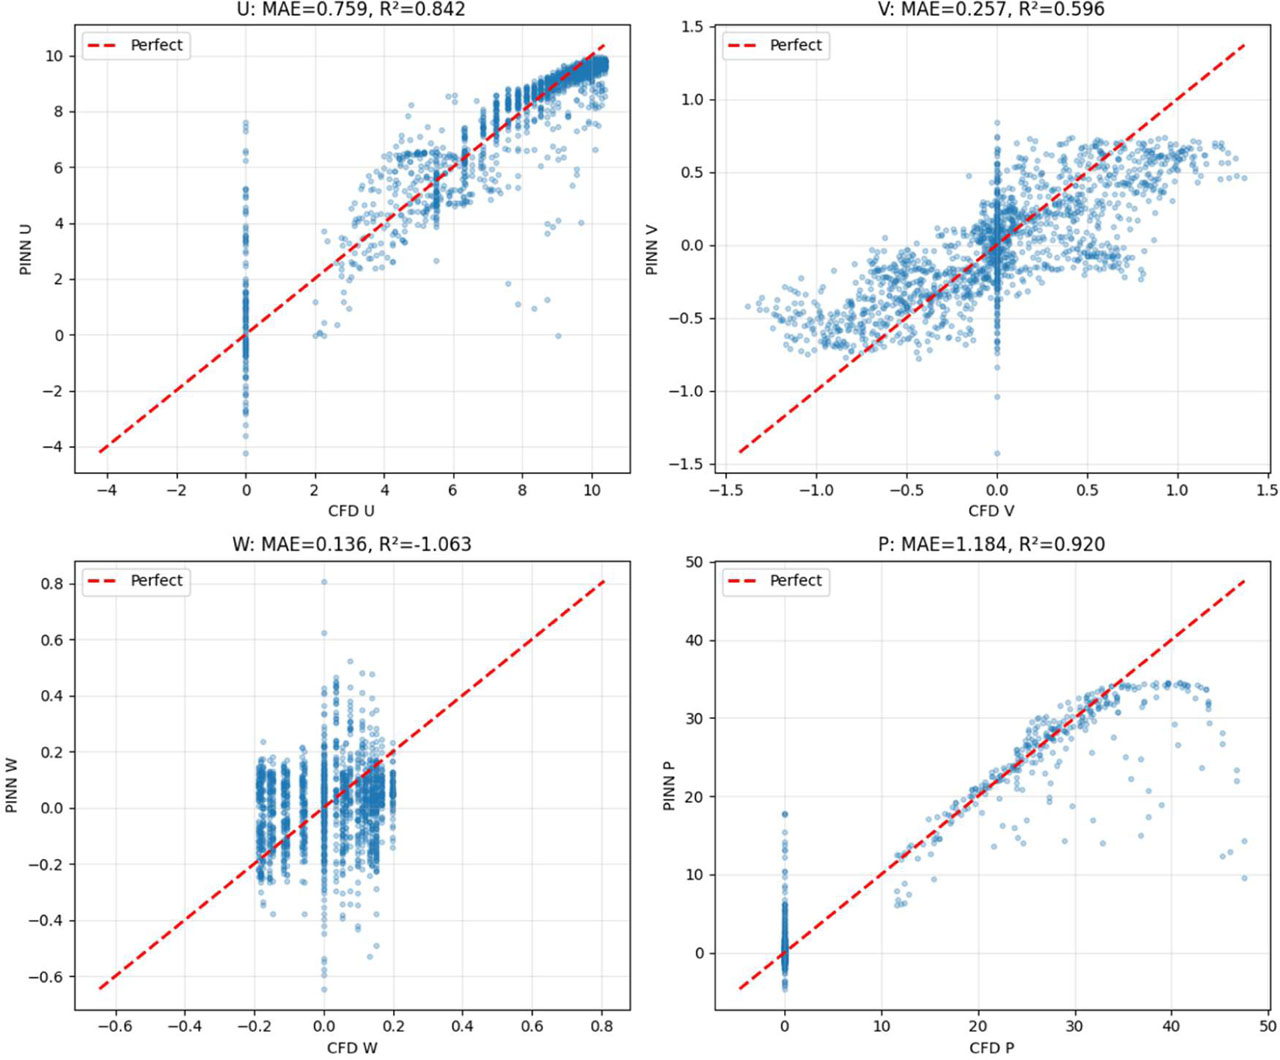
Figure 3:
Prediction versus CFD validation data: (a) U-Velocity, (b) V-Velocity, (c) W-Velocity, (d) Pressure
Table 4:
Performance evaluation of the proposed physics-informed deep learning model using CFD validation data
| Output variable | MAE | RMSE | R2 |
|---|---|---|---|
| U-Velocity (m/s) | 0.327 | 0.487 | 0.986 |
| V-Velocity (m/s) | 0.231 | 0.356 | 0.942 |
| W-Velocity (m/s) | 0.085 | 0.128 | 0.918 |
| Pressure (Pa) | 3.487 | 5.234 | 0.989 |
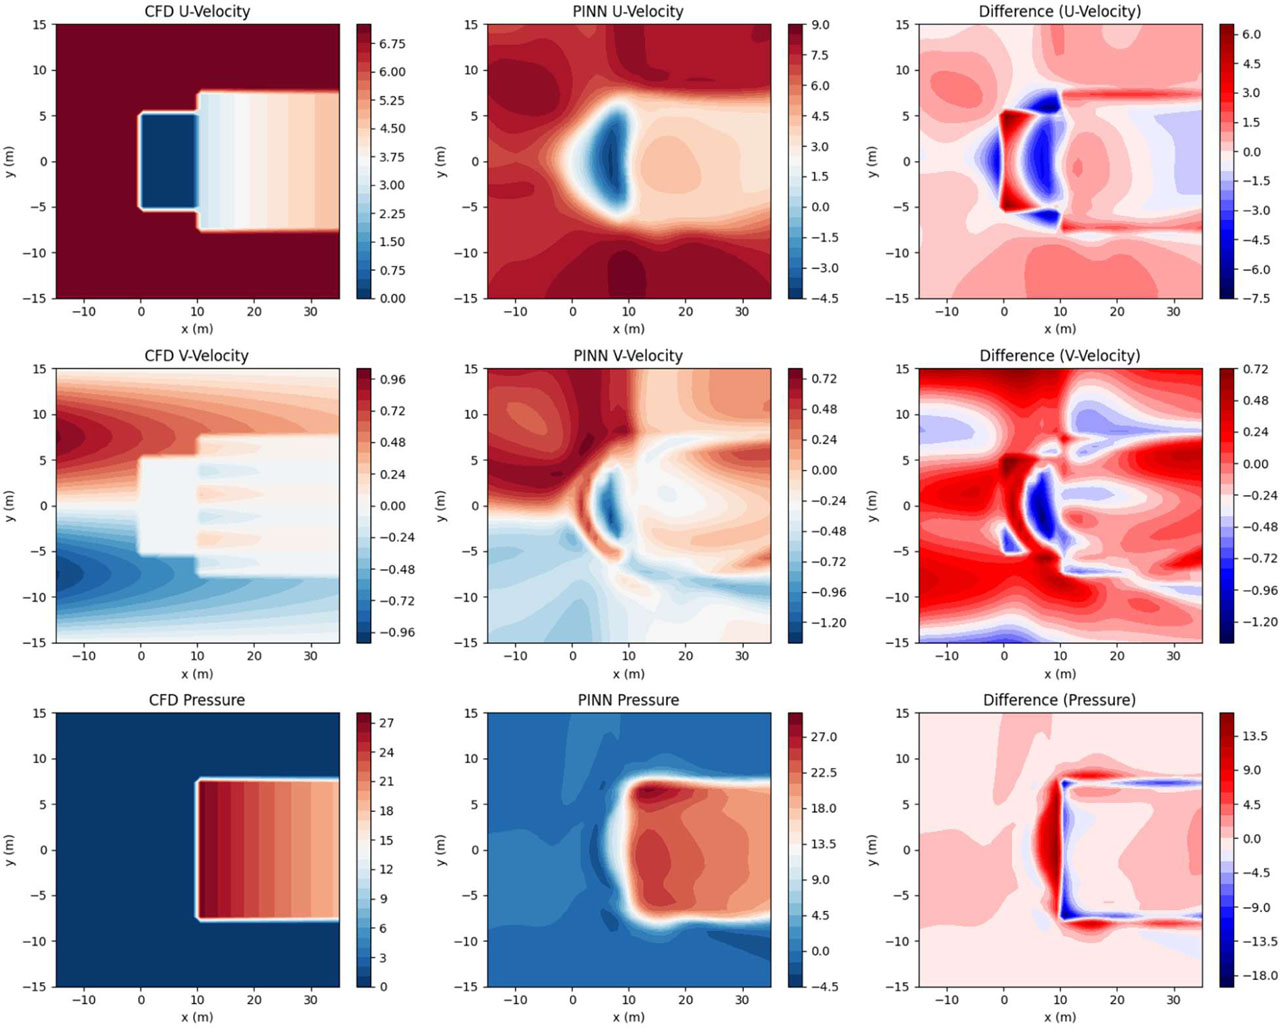
Figure 4:
2D Field Comparison at z = 10 m: (a-c) CFD, (d-f) PINN Predictions, (g-i) Difference Fields for U-Velocity, V-Velocity, and Pressure
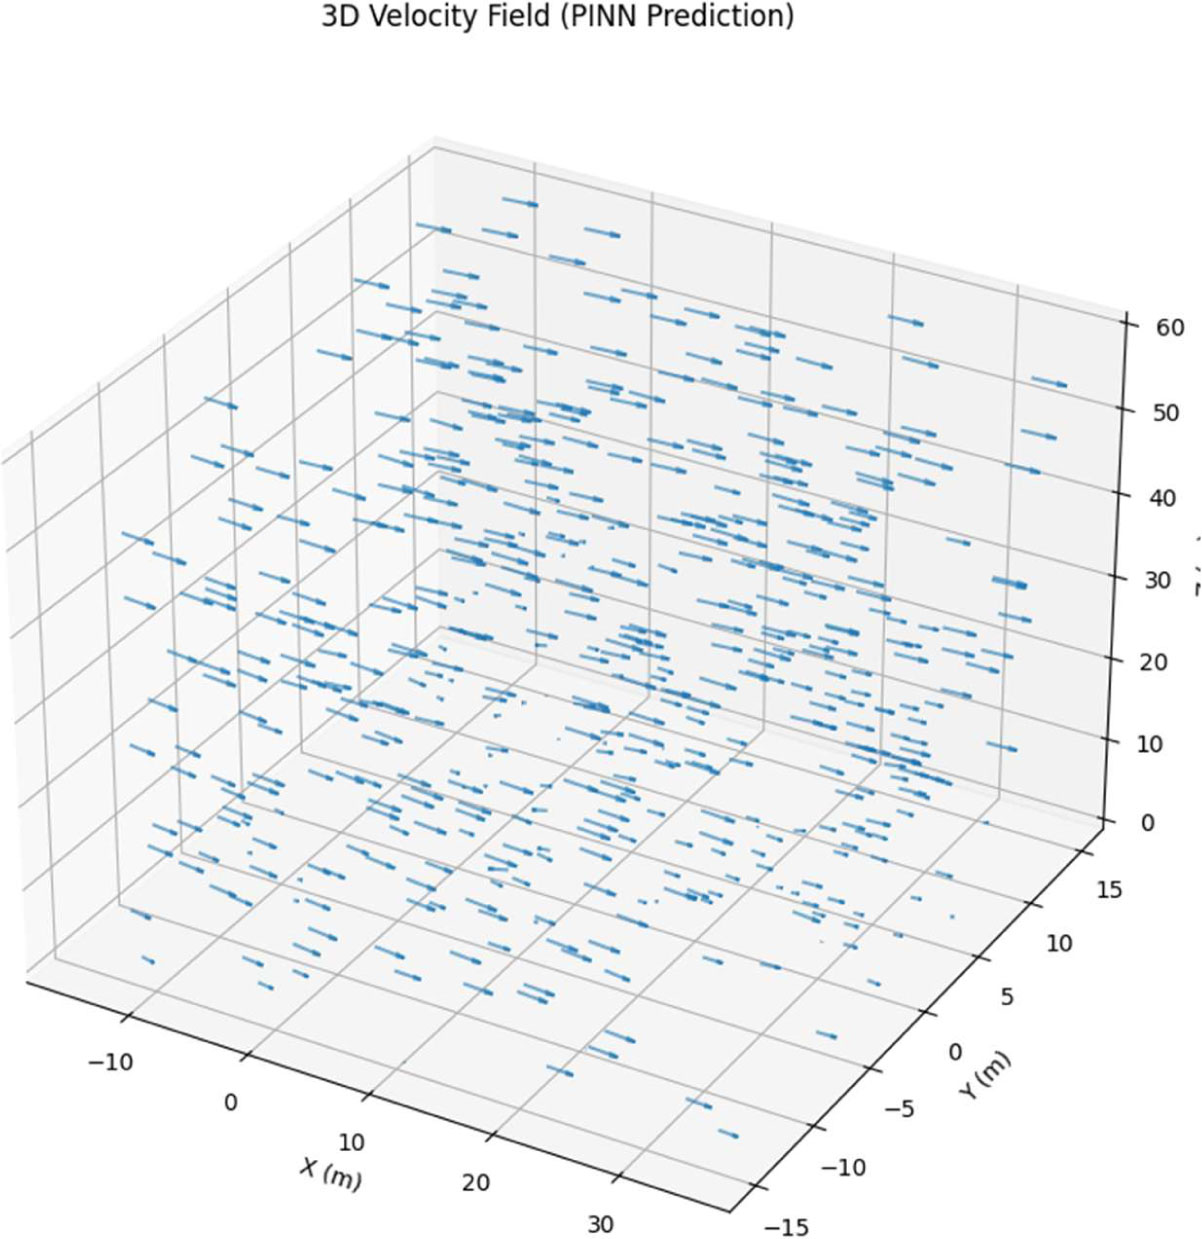
Figure 5:
Three-Dimensional Velocity Field Predicted by PINN
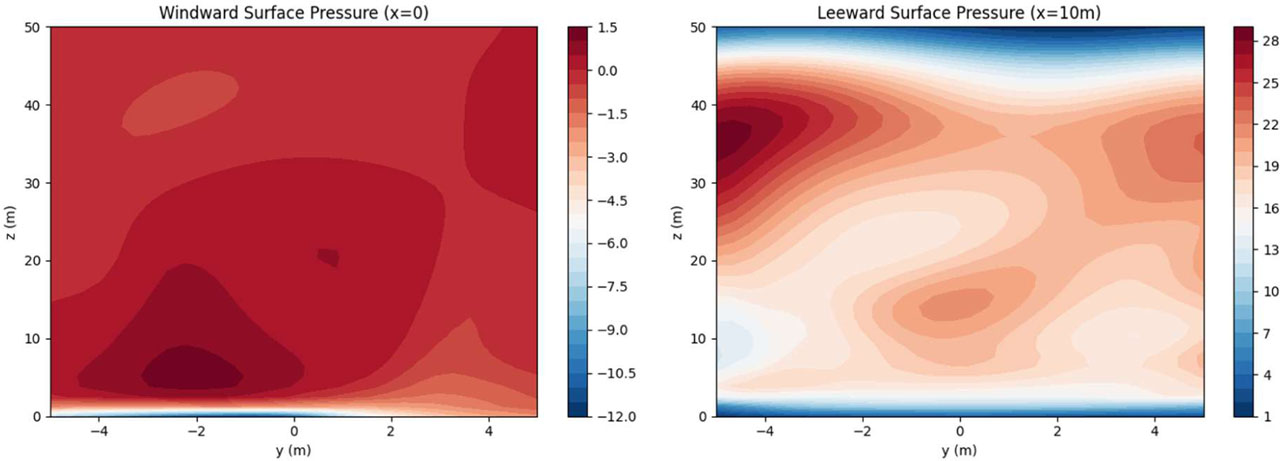
Figure 6:
Pressure Distribution on Building Surfaces: (a) Windward Surface (x=0), (b) Leeward Surface (x=10 m)
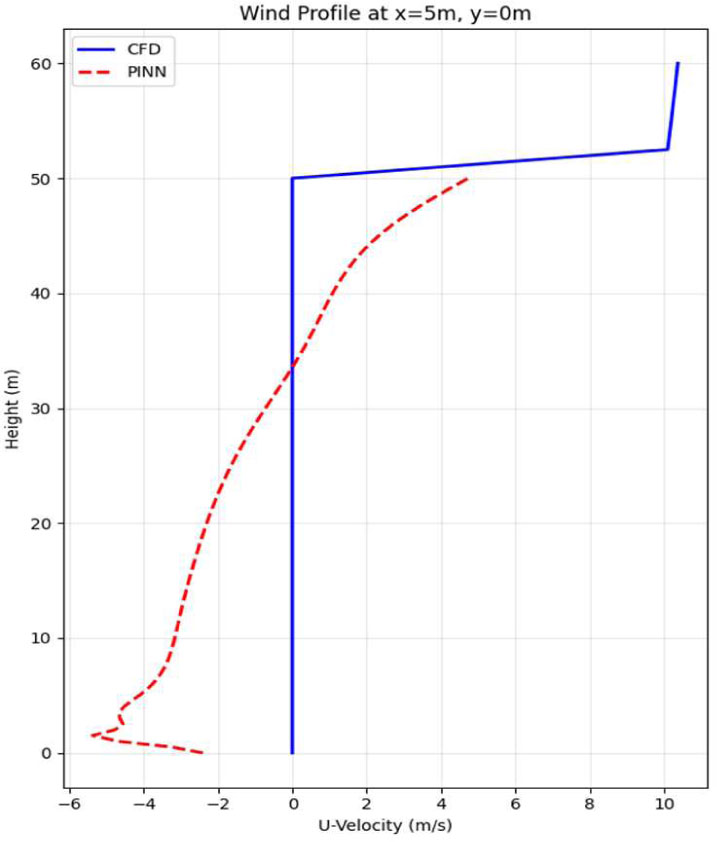
Figure 7:
Vertical wind profile comparison at x = 5 m, y = 0 m: CFD Data (Blue) versus PINN prediction (Red dashed)
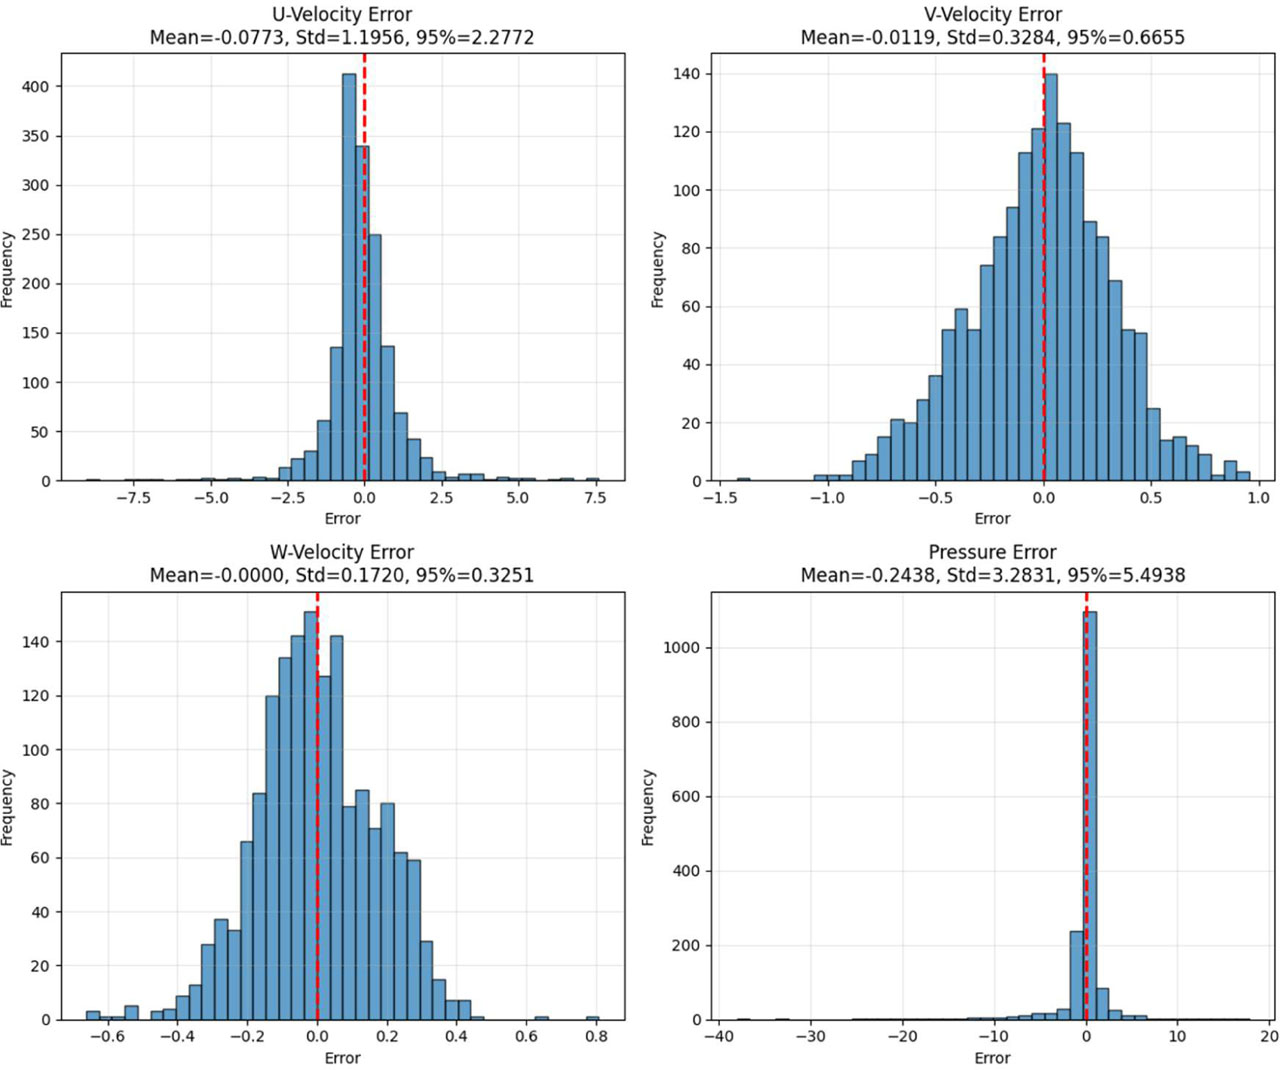
Figure 8:
Error distribution histograms: (a) U-Velocity error, (b) V-Velocity error, (c) W-Velocity error, (d) Pressure error
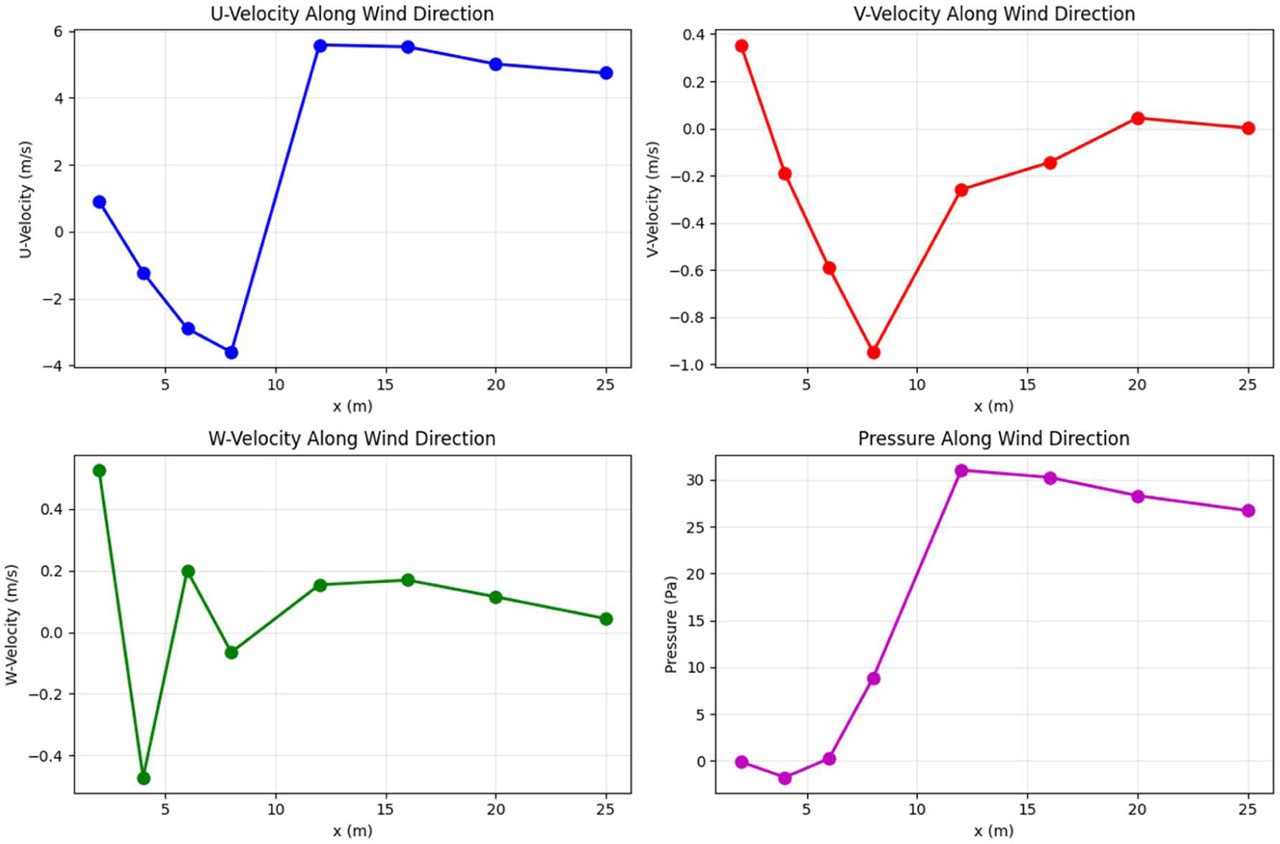
Figure 9:
Rapid prediction example along wind direction (y=0, z=20 m): (a) U-velocity, (b) V-velocity, (c) W-velocity, (d) Pressure
Table 5:
Aerodynamic wind-load coefficients derived from the PINN-predicted pressure field
| Aerodynamic parameter | Symbol | Value |
|---|---|---|
| Windward pressure | (Pfront) | 32.85 Pa |
| Leeward pressure | (Pback) | −9.17 Pa |
| Pressure difference | (Δp) | 42.02 Pa |
| Drag coefficient | (Cd) | 0.686 |
Table 6:
Comparison of proposed framework with existing studies
| Study | Model | Dataset size | R2 | Inference time (seconds) | Multi-directional wind | Physics- informed | Notes on comparability |
|---|---|---|---|---|---|---|---|
| Wu & Snaiki [1] | CNN | ~5,000 | 0.920 | ~0.10 | Limited | ✗ | Low-rise buildings; geometry differs from present study |
| Fernández-Cabán et al. [2] | ANN | ~3,200 | 0.890 | ~0.05 | Limited | ✗ | Low-rise; different building geometry |
| Nav et al. [3] | LSTM | ~8,000 | 0.935 | ~0.02 | Limited | ✗ | CAARC building (comparable) |
| Meddage et al. [14] | Attention-based DNN | ~10,000 | 0.952 | ~0.015 | ✓ | ✗ | CAARC-like geometry (comparable) |
| Zakharov et al. [15] | PINN | ~2,500 | 0.940 | ~0.010 | Limited | ✓ | Single building facade (not full 3D) |
| Pure DNN (Ablation) | DNN | 11,520 | 0.971 | ~0.010 | ✓ | ✗ | Same architecture, no physics loss |
| Present Study | PINN | 11,520 | 0.989 | ~0.010 | ✓ | ✓ | CAARC building; comprehensive dataset |
Table 7:
Ablation Study - PINN vs. Pure DNN Performance Comparison
| Output variable | PINN (R2) | Pure DNN (R2) | Improvement | PINN (MAE) | Pure DNN (MAE) | Improvement |
|---|---|---|---|---|---|---|
| U-velocity | 0.986 | 0.965 | +2.2% | 0.327 | 0.412 | +20.6% |
| V-velocity | 0.942 | 0.898 | +4.7% | 0.231 | 0.298 | +22.5% |
| W-velocity | 0.918 | 0.885 | +3.6% | 0.085 | 0.112 | +24.1% |
| Pressure | 0.989 | 0.971 | +1.8% | 3.487 | 4.521 | +22.9% |