

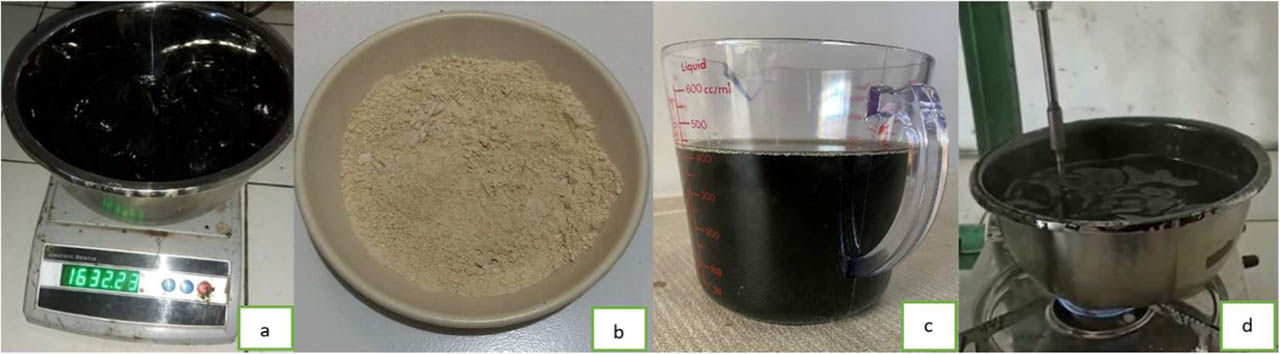
Figure 1:
a. conventional asphalt, b. natural zeolite, c. bio-oil, d. mixing process of modified asphalt
Table 1:
Properties of asphalt binder
| Properties of asphalt binder | Unit | Value |
|---|---|---|
| Penetration | [0.1 mm] | 64.5 |
| Softening point | [°C] | 48 |
| Ductility | [cm] | 160 |
| Specific gravity | [-] | 1.04 |
Table 2:
Compounds of natural zeolite
| Compounds of natural zeolite | Unit | Value |
|---|---|---|
| Silicon Dioxide (SiO2) | [%] | 70.2 |
| Aluminium Oxide (Al2O3) | [%] | 10.0 |
| Ferric Oxide (Fe2O3) | [%] | 9.52 |
| Others | [%] | 10.28 |
Table 3:
Properties of bio-oil
| Properties of bio-oil | Unit | Value |
|---|---|---|
| Specific gravity | [-] | 0.947 |
| Viscosity at 60°C | [cSt] | 35.2 |
| Flash point | [°C] | 210 |
| Solubility in CCl4 | [%] | 95.4 |
Table 4:
Properties of aggregates
| Aggregates | Properties | Unit | Value |
|---|---|---|---|
| Coarse aggregate | Aggregate impact value | [%] | 8.95 |
| Bulk specific gravity | [-] | 2.645 | |
| Apparent specific gravity | [-] | 2.771 | |
| Water absorption | [%] | 1.718 | |
| Affinity to asphalt binder | [%] | 100 | |
| Fine aggregate | Bulk specific gravity | [-] | 2.751 |
| Apparent specific gravity | [-] | 2.792 | |
| Water absorption | [%] | 0.543 | |
| Filler | Bulk specific gravity | [-] | 2.688 |
| Apparent specific gravity | [-] | 2.725 | |
| Water absorption | [%] | 0.503 |
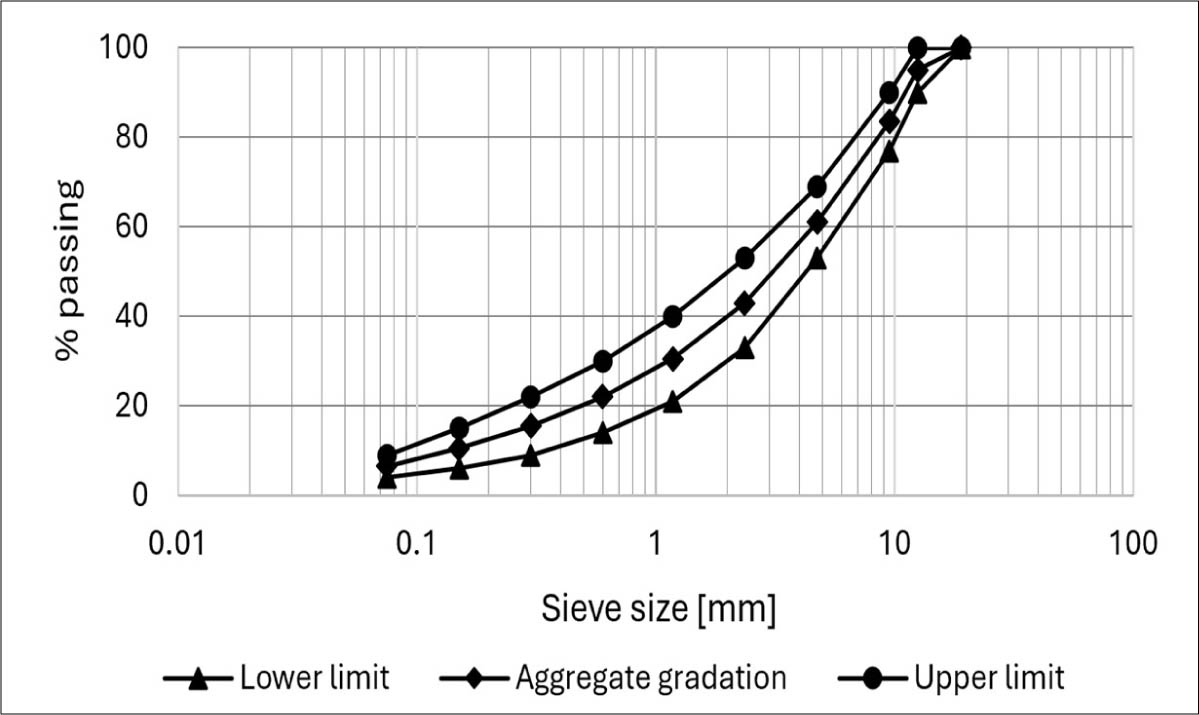
Figure 2:
Aggregate gradation
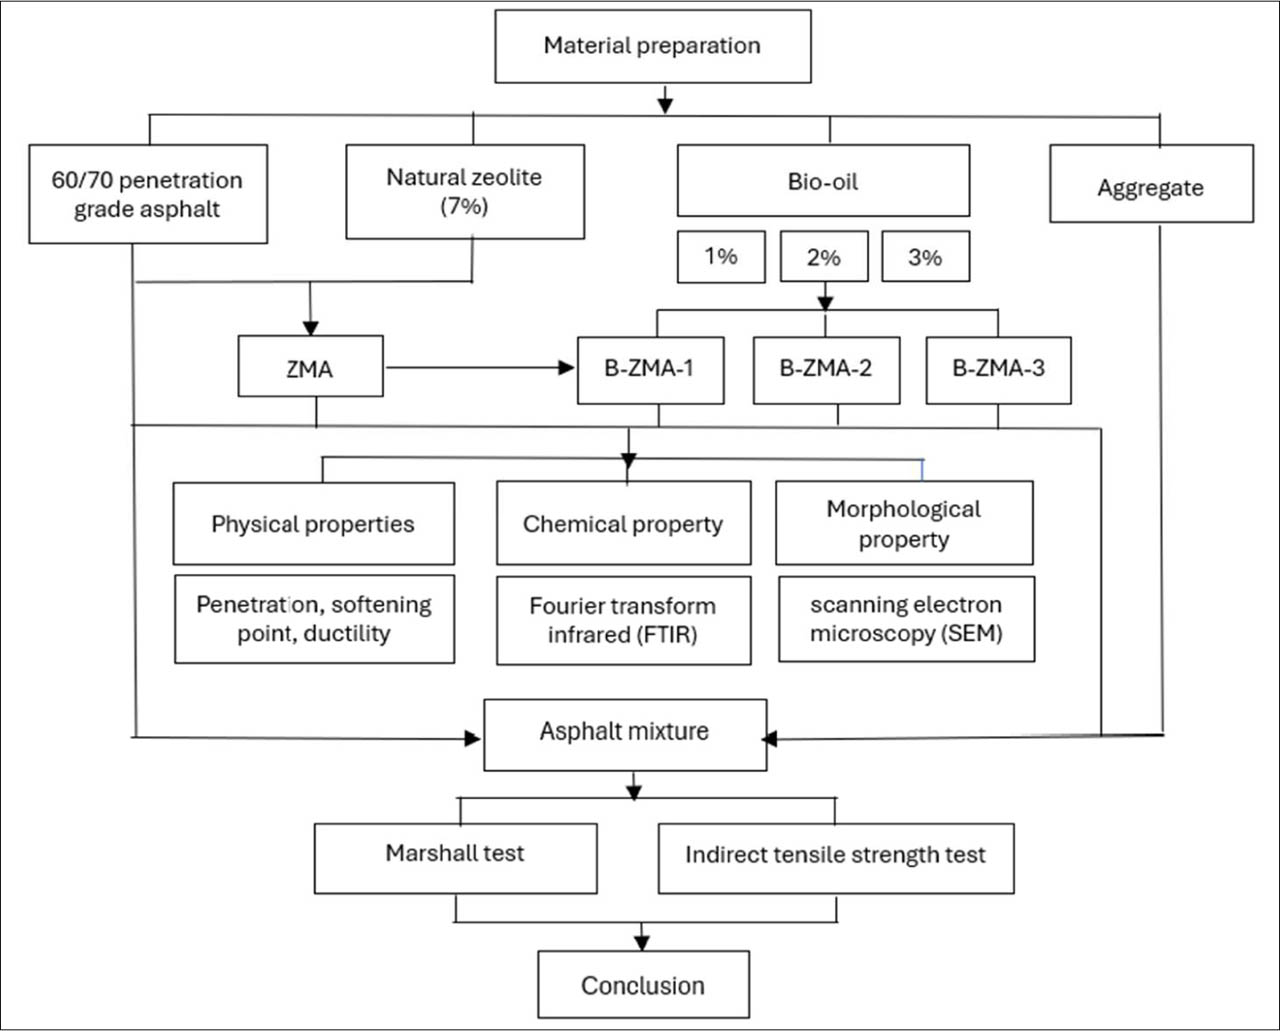
Figure 3:
Flowchart of the study
Table 5:
Properties of zeolite and bio-oil-modified asphalt
| Binder types | Softening point [°C] | Penetration [0.1 mm] | Ductility [cm] | The slope | Penetration index |
|---|---|---|---|---|---|
| ZMA (93% conventional asphalt + 7% zeolite) | 55.7 | 56.8 | 100.9 | 0.0374 | 0.450 |
| B-ZMA-1 (ZMA + 1% bio-oil) | 54.4 | 60.1 | 115.9 | 0.0382 | 0.302 |
| B-ZMA-2 (ZMA + 2% bio-oil) | 52.2 | 65.2 | 127.7 | 0.0401 | −0.017 |
| B-ZMA-3 (ZMA + 3% bio-oil) | 49.9 | 71 | 133.9 | 0.0422 | −0.360 |
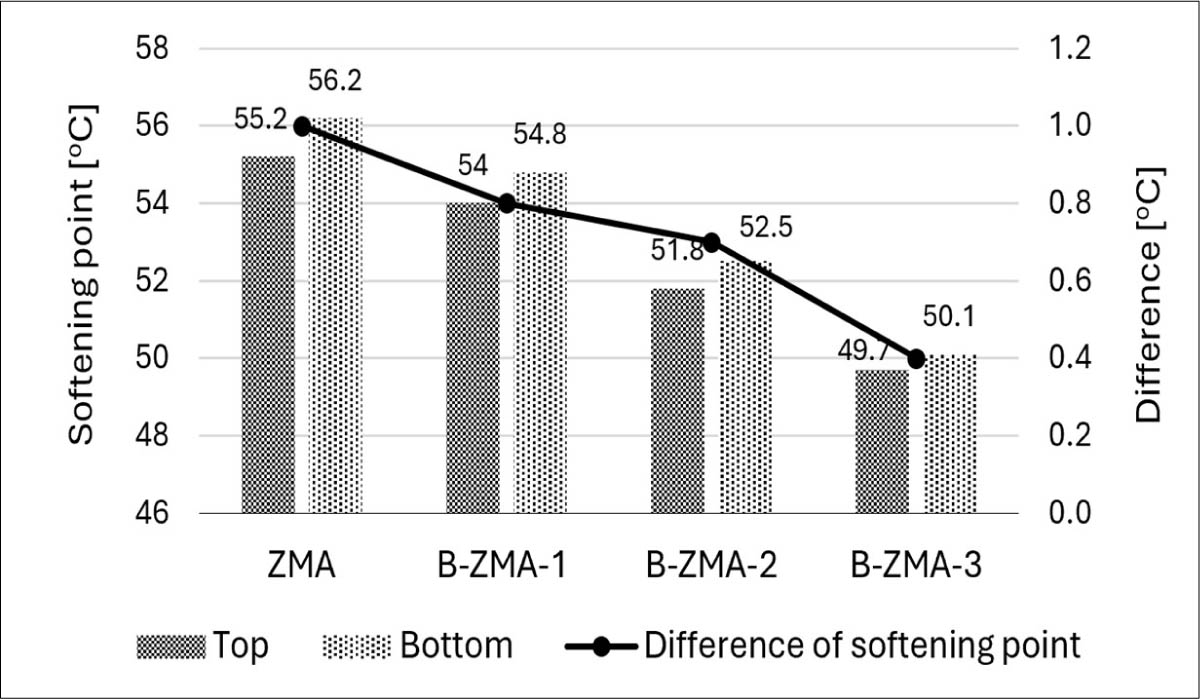
Figure 4:
Difference of softening point
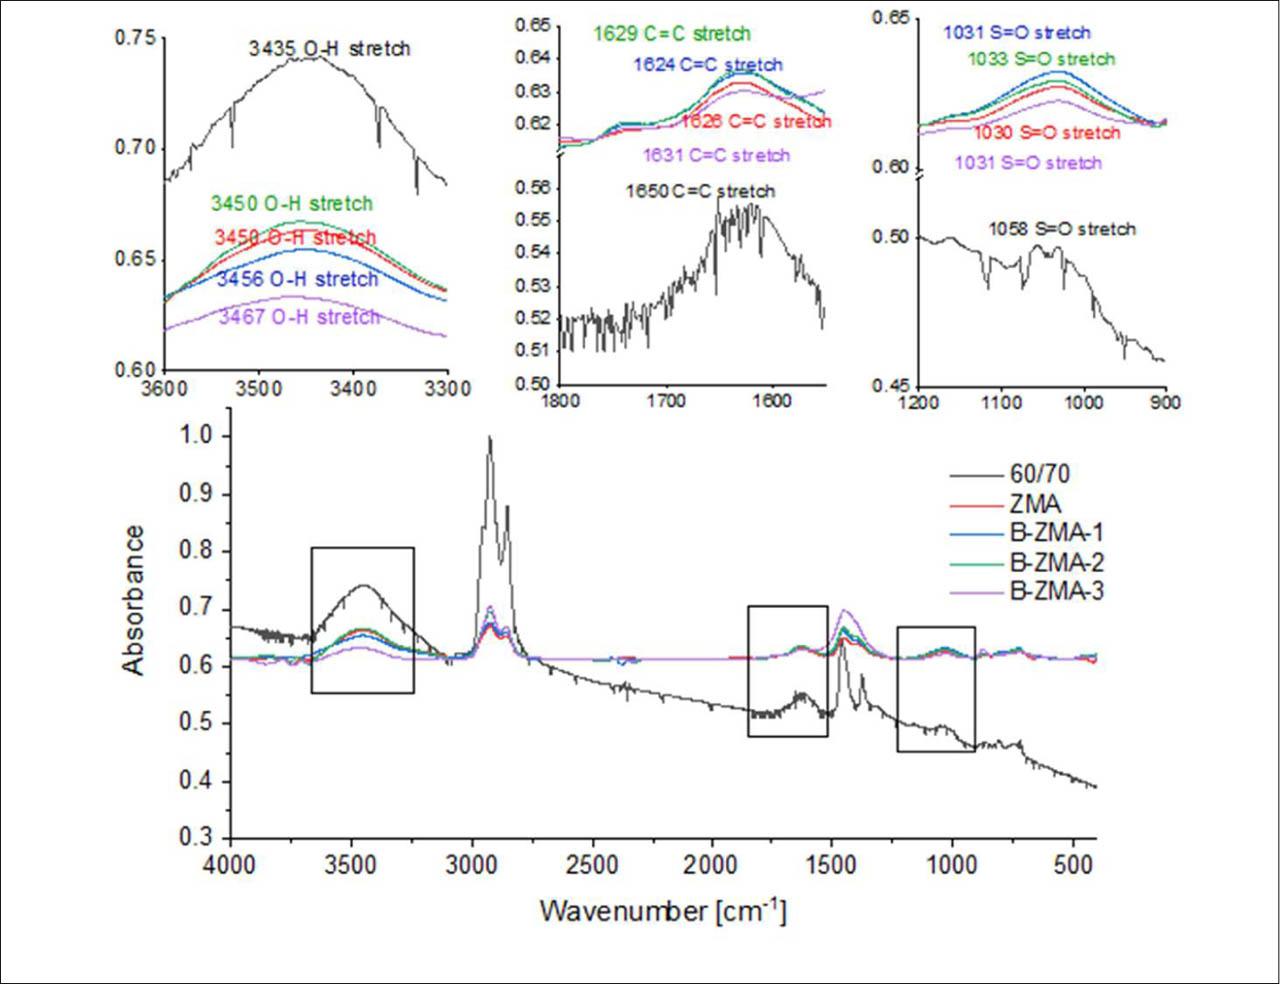
Figure 5:
FTIR spectra of bulk samples of each type of asphalt binder
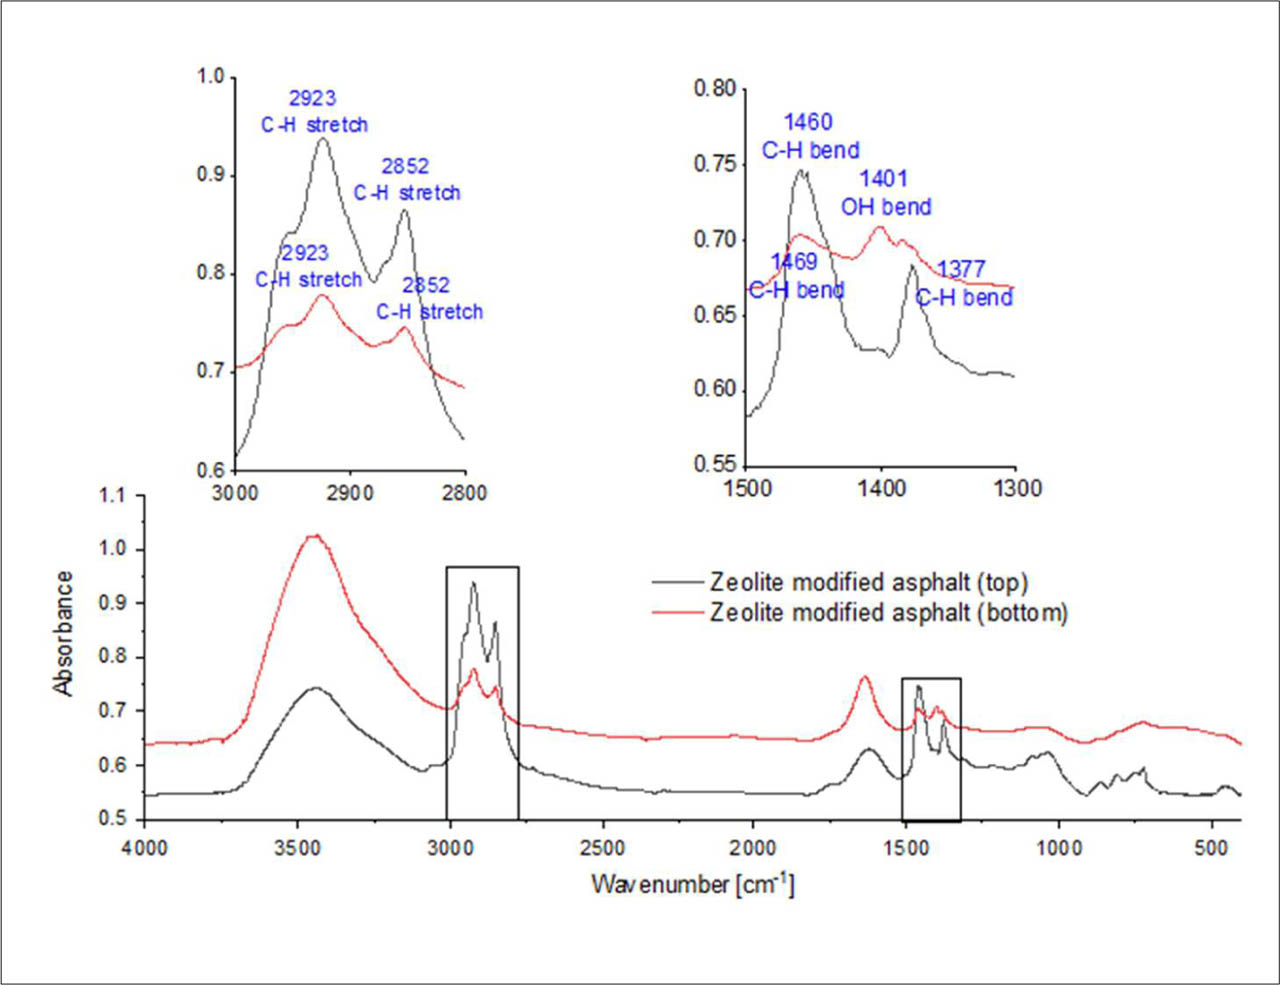
Figure 6:
FTIR spectra of zeolite-modified asphalt oil (top and bottom)
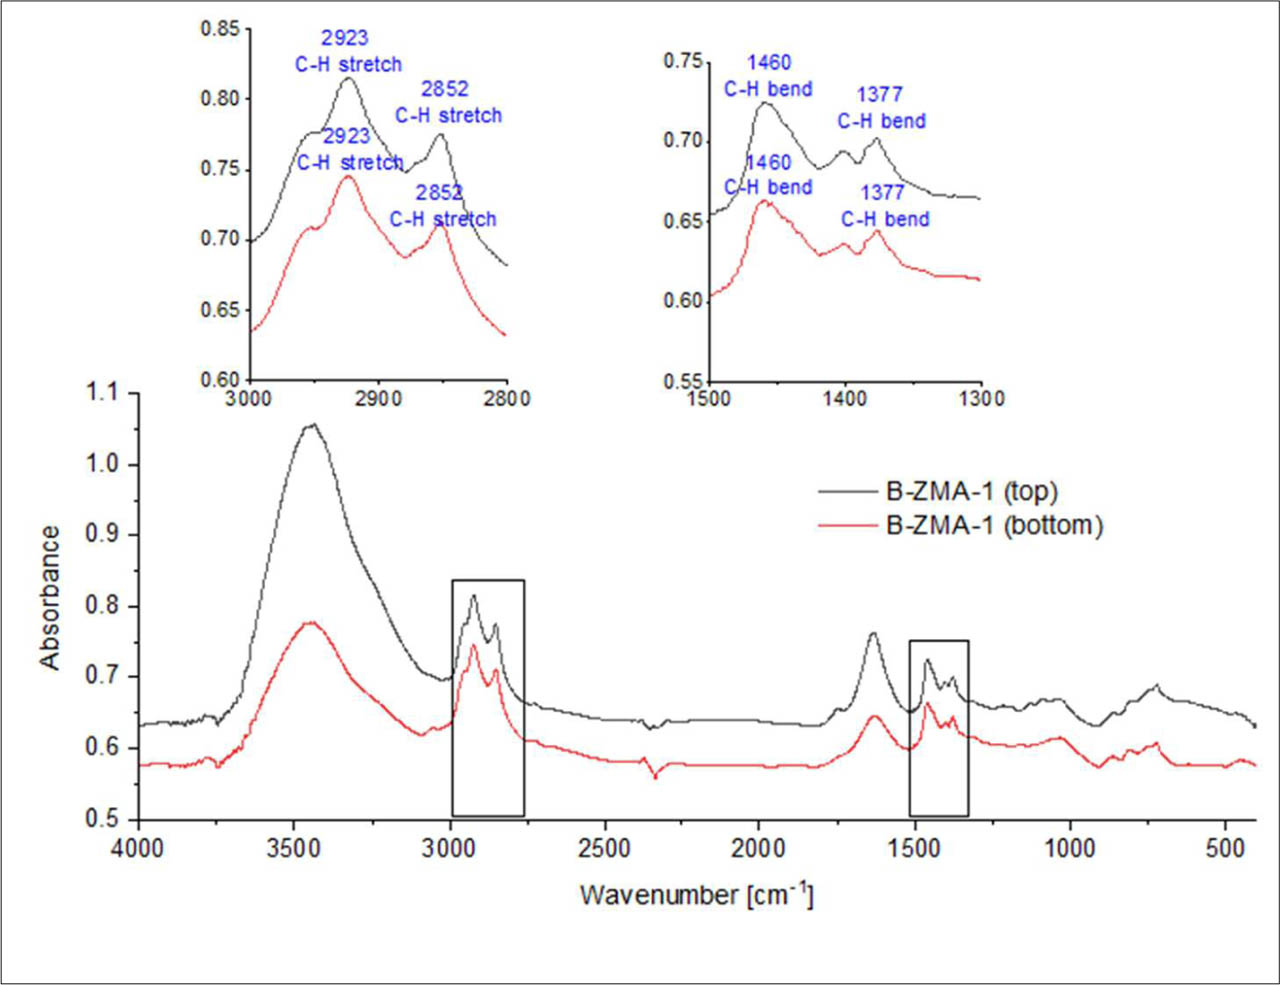
Figure 7:
FTIR spectra of zeolite-modified asphalt with 1% bio-oil (top and bottom)
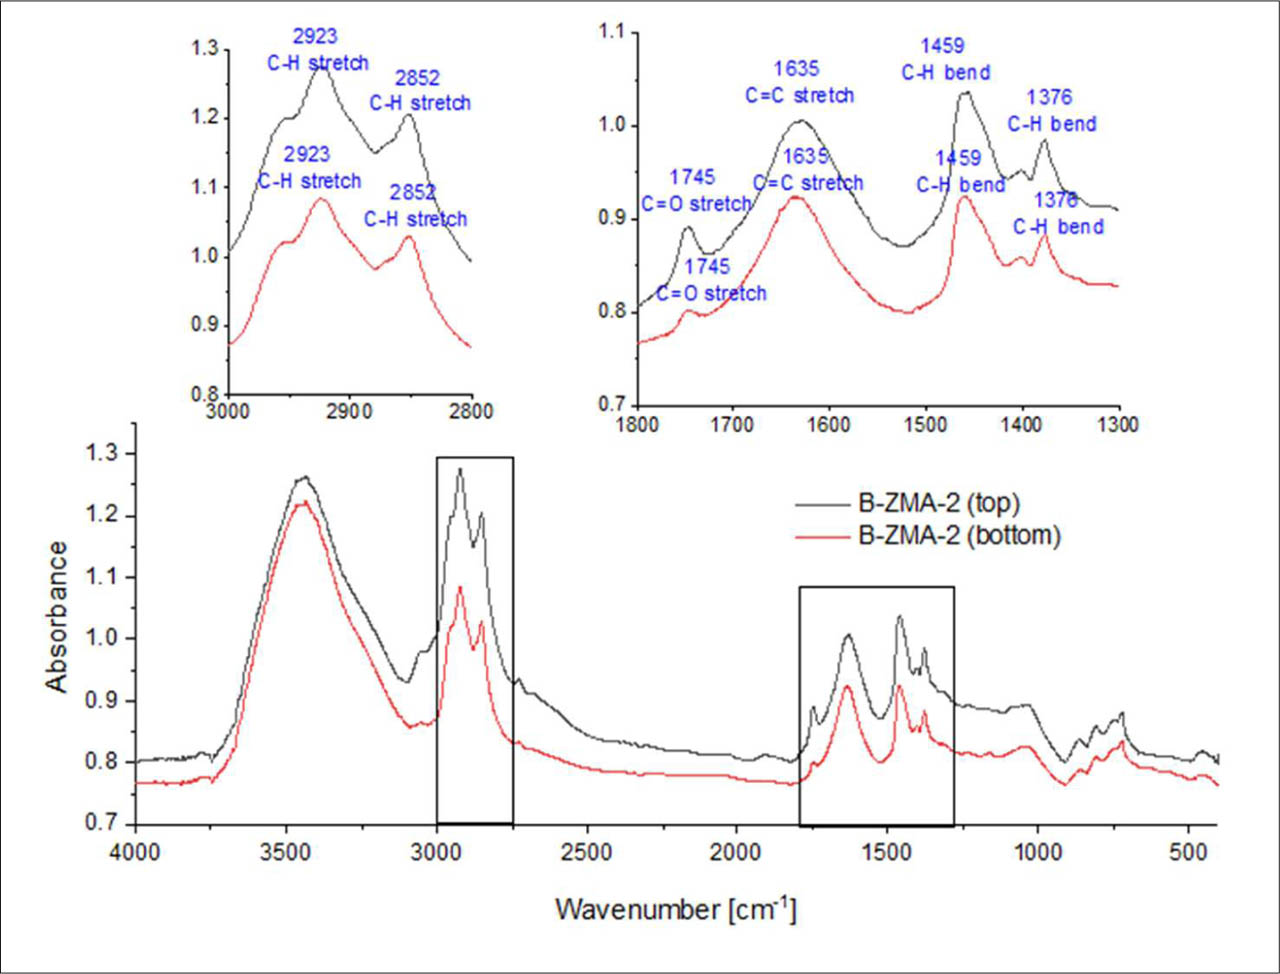
Figure 8:
FTIR spectra of zeolite-modified asphalt with 2% bio-oil (top and bottom)
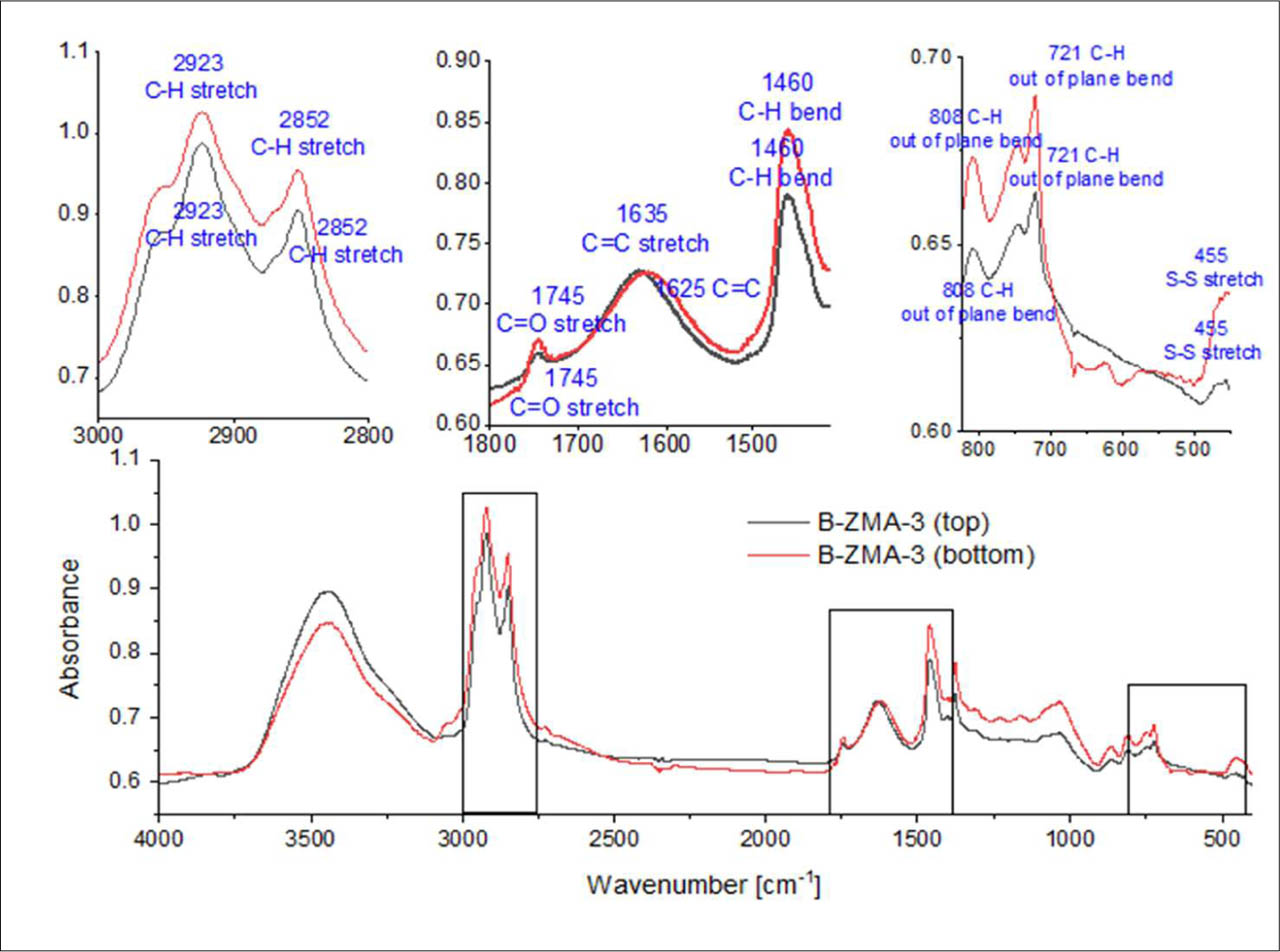
Figure 9:
FTIR spectra of zeolite-modified asphalt with 3% bio-oil (top and bottom)
Table 6:
FTIR absorbance of zeolite-modified asphalt
| Wavenumber [cm−1] | Functional groups | Compounds | Top | Bottom | Difference in IR absorbance |
|---|---|---|---|---|---|
| 3435 | O-H stretch | alcohol | 0.745 | 1.027 | −0.282 |
| 2923 | C-H stretch | methylene | 0.938 | 0.779 | 0.159 |
| 2852 | C-H stretch | methylene | 0.865 | 0.745 | 0.12 |
| 721 | C-H out-of-plane bend | aromatic | 0.597 | 0.682 | −0.085 |
Table 7:
FTIR absorbance of zeolite-modified asphalt with 1% bio-oil
| Wavenumber [cm−1] | Functional groups | Compounds | Top | Bottom | Difference in IR absorbance |
|---|---|---|---|---|---|
| 3425 | O-H stretch | alcohol | 1.049 | 0.773 | 0.276 |
| 2923 | C-H stretch | methylene | 0.815 | 0.745 | 0.07 |
| 2852 | C-H stretch | methylene | 0.775 | 0.712 | 0.063 |
| 1460 | C-H bend | methyl | 0.724 | 0.663 | 0.061 |
| 1377 | C-H bend | methyl | 0.702 | 0.645 | 0.057 |
| 771 | C-H out-of-plane bend | aromatic | 0.672 | 0.596 | 0.076 |
Table 8:
FTIR absorbance of zeolite-modified asphalt with 2% bio-oil
| Wavenumber [cm−1] | Functional groups | Compounds | Top | Bottom | Difference in IR absorbance |
|---|---|---|---|---|---|
| 3436 | O-H stretch | alcohol | 1.264 | 1.222 | 0.042 |
| 2923 | C-H stretch | methylene | 1.275 | 1.083 | 0.192 |
| 2852 | C-H stretch | methylene | 1.206 | 1.029 | 0.177 |
| 1745 | C=O stretch | ester | 0.891 | 0.802 | 0.089 |
| 1635 | C=C stretch | alkenyl | 1.005 | 0.922 | 0.083 |
| 1459 | C-H bend | methyl | 1.034 | 0.924 | 0.11 |
| 1376 | C-H bend | methyl | 0.985 | 0.883 | 0.102 |
| 861 | C-H out-of-plane bend | aromatic | 0.837 | 0.788 | 0.049 |
| 721 | C-H out-of-plane bend | aromatic | 0.882 | 0.835 | 0.047 |
Table 9:
FTIR absorbance of zeolite-modified asphalt with 3% bio-oil
| Wavenumber [cm−1] | Functional groups | Compounds | Top | Bottom | Difference in IR absorbance |
|---|---|---|---|---|---|
| 3435 | O-H stretch | alcohol | 0.897 | 0.848 | 0.049 |
| 2923 | C-H stretch | methylene | 0.987 | 1.025 | −0.038 |
| 2852 | C-H stretch | methylene | 0.904 | 0.954 | −0.05 |
| 1745 | C=O stretch | ester | 0.659 | 0.67 | −0.011 |
| 1460 | C-H bend | methyl | 0.79 | 0.843 | −0.053 |
| 808 | C-H out-of-plane bend | aromatic | 0.649 | 0.673 | −0.024 |
| 721 | C-H out-of-plane bend | aromatic | 0.664 | 0.69 | −0.026 |
| 455 | S-S stretch | aryl disulfides | 0.614 | 0.637 | −0.023 |
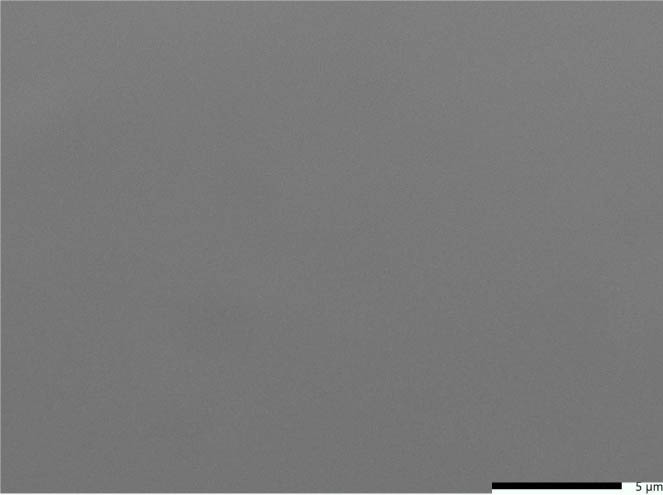
Figure 10:
SEM image of 60/70 asphalt
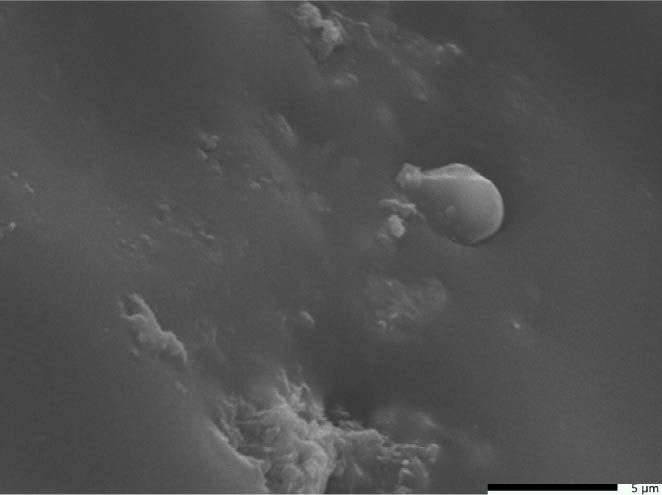
Figure 11:
SEM image of ZMA
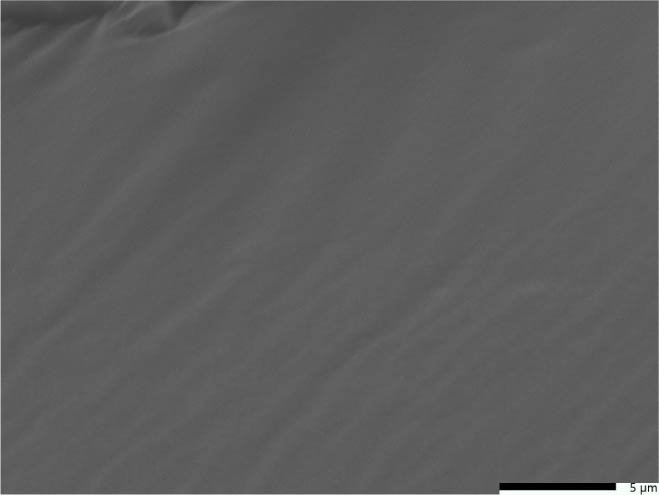
Figure 12:
SEM image of B-ZMA-1
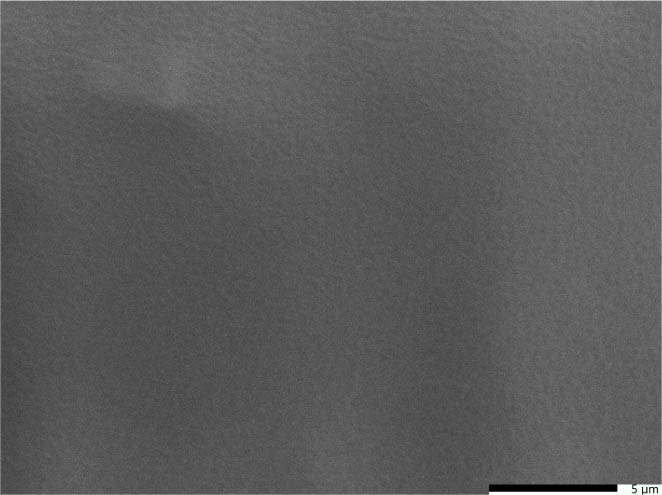
Figure 13:
SEM image of B-ZMA-2
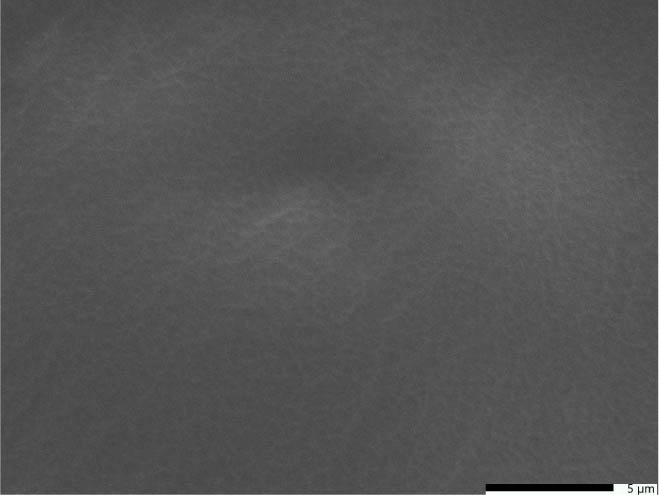
Figure 14:
SEM image of B-ZMA-3
Table 10:
Marshall stability and Marshall immersion
| Binder types in asphalt mixture | Marshall stability [kg] | Mean | Marshall immersion [kg] | Mean | RSI [%] | ||||
|---|---|---|---|---|---|---|---|---|---|
| Sample 1 | Sample 2 | Sample 3 | Sample 1 | Sample 2 | Sample 3 | ||||
| 60/70 | 2415 | 2467 | 2387 | 2423 | 2125 | 2247 | 2193 | 2188 | 90.30 |
| ZMA | 2620 | 2620 | 2445 | 2562 | 2520 | 2345 | 2096 | 2320 | 90.55 |
| B-ZMA-1 | 2645 | 2470 | 2395 | 2503 | 2220 | 2372 | 2227 | 2273 | 90.81 |
| B-ZMA-2 | 2614 | 2495 | 2345 | 2485 | 2251 | 2178 | 2345 | 2258 | 90.87 |
| B-ZMA-3 | 2520 | 2444 | 2299 | 2421 | 2495 | 2096 | 2081 | 2224 | 91.86 |
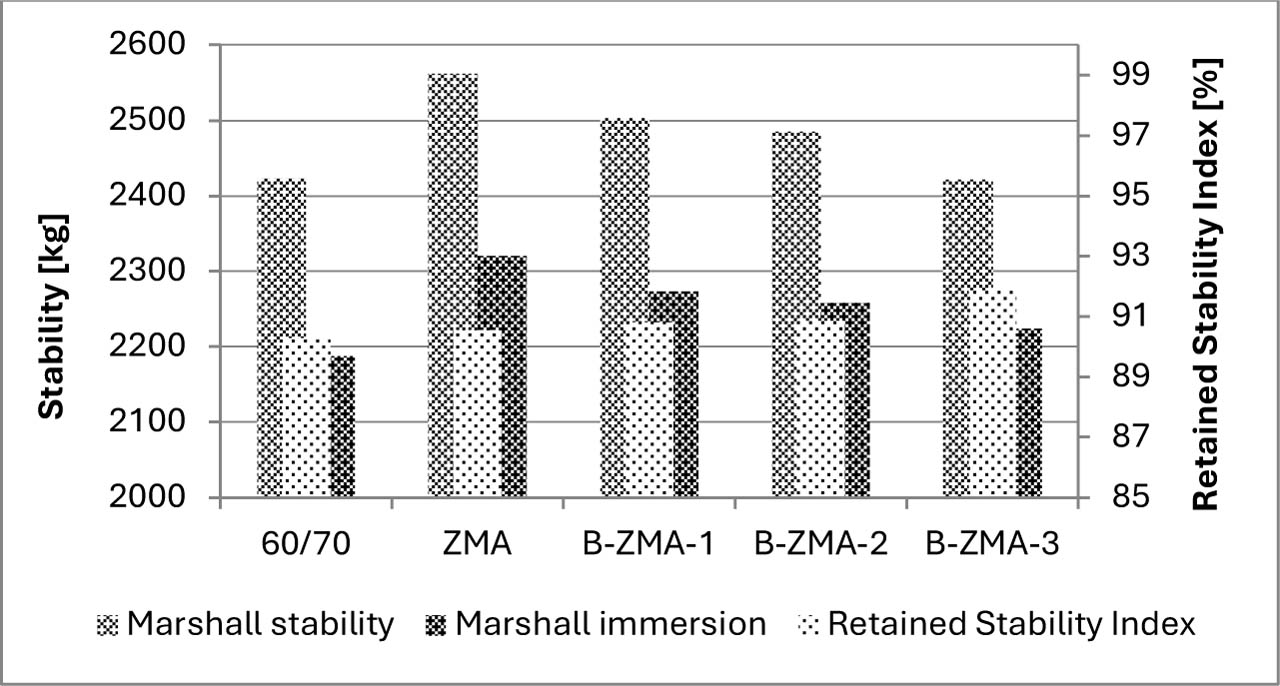
Figure 15:
Marshall properties of asphalt mixture
Table 11:
ANOVA results for Marshall stability
| ANOVA summary | |||||
|---|---|---|---|---|---|
| Group | Count | Mean | Variance | Std deviation | Coefficient of variation |
| 60/70 | 3 | 2423 | 1648.0 | 40.6 | 1.68 |
| ZMA | 3 | 2562 | 10208.3 | 101.0 | 3.94 |
| B-ZMA-1 | 3 | 2503 | 16458.3 | 128.3 | 5.12 |
| B-ZMA-2 | 3 | 2485 | 18170.3 | 134.8 | 5.43 |
| B-ZMA-3 | 3 | 2421 | 12607.0 | 112.3 | 4.64 |
| ANOVA results | |||||
|---|---|---|---|---|---|
| Source of Variance | df | Sum of square (SS) | Mean square (MS) | F-Value | p-Value |
| Between group | 4 | 41873 | 10468 | 0.89 | 0.507 |
| Within group | 10 | 118184 | 11818 | ||
| Total | 14 | 160057 | |||
Table 12:
ANOVA results for Marshall immersion
| ANOVA summary | |||||
|---|---|---|---|---|---|
| Group | Count | Mean | Variance | Std deviation | Coefficient of variation |
| 60/70 | 3 | 2188 | 3737.3 | 61.1 | 2.79 |
| ZMA | 3 | 2320 | 45400.0 | 213.0 | 9.18 |
| B-ZMA-1 | 3 | 2273 | 7363.0 | 85.8 | 3.78 |
| B-ZMA-2 | 3 | 2258 | 7009.0 | 83.7 | 3.71 |
| B-ZMA-3 | 3 | 2224 | 55137.0 | 235.0 | 10.56 |
| ANOVA results | |||||
|---|---|---|---|---|---|
| Source of Variance | df | Sum of square (SS) | Mean square (MS) | F-Value | p-Value |
| Between group | 4 | 29944 | 7486 | 0.32 | 0.861 |
| Within group | 10 | 237293 | 23729 | ||
| Total | 14 | 267237 | |||
Table 13:
Dimension and voids in mix (VIM) of specimens used for indirect tensile strength test
| Types of ITS test | Binder types in asphalt mixture | Asphalt content [%] | Diameter [cm] | Height [cm] | Voids in Mix [%] |
|---|---|---|---|---|---|
| ITS dry | 60/70 | 6.0 | 10 ± 0.00 | 5.99 ± 0.03 | 4.21 ± 0.04 |
| ZMA | 6.0 | 10 ± 0.00 | 5.86 ± 0.04 | 4.17 ± 0.05 | |
| B-ZMA-1 | 6.0 | 10 ± 0.00 | 5.92 ± 0.06 | 4.22 ± 0.07 | |
| B-ZMA-2 | 6.0 | 10 ± 0.00 | 5.94 ± 0.09 | 4.23 ± 0.02 | |
| B-ZMA-3 | 6.0 | 10 ± 0.00 | 5.95 ± 0.02 | 4.36 ± 0.04 | |
| ITS wet | 60/70 | 6.0 | 10 ± 0.00 | 5.97 ± 0.05 | 4.20 ± 0.08 |
| ZMA | 6.0 | 10 ± 0.00 | 5.89 ± 0.05 | 4.19 ± 0.08 | |
| B-ZMA-1 | 6.0 | 10 ± 0.00 | 5.98 ± 0.03 | 4.24 ± 0.05 | |
| B-ZMA-2 | 6.0 | 10 ± 0.00 | 6.00 ± 0.02 | 4.27 ± 0.02 | |
| B-ZMA-3 | 6.0 | 10 ± 0.00 | 5.93 ± 0.05 | 4.40 ± 0.07 |
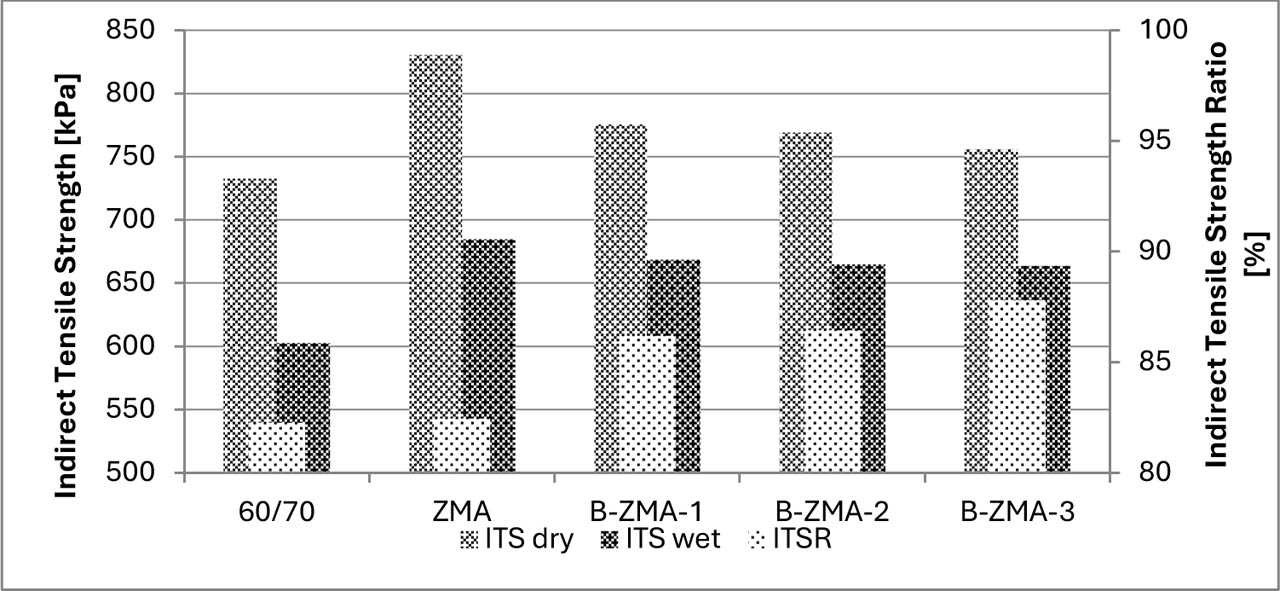
Figure 16:
Indirect tensile strength properties of asphalt mixture
Table 14:
Indirect tensile strength properties
| Binder types in asphalt mixture | ITS dry [kPa] | Mean | ITS wet [kPa] | Mean | ITSR [%] | ||||
|---|---|---|---|---|---|---|---|---|---|
| Sample 1 | Sample 2 | Sample 3 | Sample 1 | Sample 2 | Sample 3 | ||||
| 60/70 | 725.7 | 724.2 | 748.1 | 732.6 | 618.0 | 605.6 | 584.2 | 602.6 | 82.25 |
| ZMA | 857.8 | 813.5 | 819.5 | 830.3 | 629.1 | 746.5 | 678.2 | 684.6 | 82.45 |
| B-ZMA-1 | 737.2 | 846.1 | 742.9 | 775.4 | 701.8 | 648.7 | 654.6 | 668.4 | 86.20 |
| B-ZMA-2 | 733.1 | 745.2 | 828.8 | 769.0 | 668.1 | 677.1 | 652.3 | 664.7 | 86.44 |
| B-ZMA-3 | 753.1 | 758.5 | 756 | 755.9 | 654.5 | 695.5 | 640.7 | 663.6 | 87.79 |
Table 15:
ANOVA results for ITSdry
| ANOVA summary | |||||
|---|---|---|---|---|---|
| Group | Count | Mean | Variance | Std deviation | Coefficient of variation |
| 60/70 | 3 | 732.7 | 179.2 | 13.4 | 1.83 |
| ZMA | 3 | 830.3 | 577.6 | 24.0 | 2.89 |
| B-ZMA-1 | 3 | 775.4 | 3757.0 | 61.3 | 7.90 |
| B-ZMA-2 | 3 | 769.0 | 2715.6 | 52.1 | 6.78 |
| B-ZMA-3 | 3 | 755.9 | 7.3 | 2.7 | 0.36 |
| ANOVA results | |||||
|---|---|---|---|---|---|
| Source of Variance | df | Sum of square (SS) | Mean square (MS) | F-Value | p-Value |
| Between group | 4 | 15662 | 3916 | 2.71 | 0.092 |
| Within group | 10 | 14473 | 1447 | ||
| Total | 14 | 30135 | |||
Table 16:
ANOVA results for ITSwet
| ANOVA summary | |||||
|---|---|---|---|---|---|
| Group | Count | Mean | Variance | Std deviation | Coefficient of variation |
| 60/70 | 3 | 602.6 | 292.4 | 17.1 | 2.84 |
| ZMA | 3 | 684.6 | 3476.4 | 59.0 | 8.61 |
| B-ZMA-1 | 3 | 668.4 | 847.0 | 29.1 | 4.35 |
| B-ZMA-2 | 3 | 665.8 | 157.6 | 12.6 | 1.89 |
| B-ZMA-3 | 3 | 663.6 | 812.4 | 28.5 | 4.30 |
| ANOVA results | |||||
|---|---|---|---|---|---|
| Source of Variance | df | Sum of square (SS) | Mean square (MS) | F-Value | p-Value |
| Between group | 4 | 11914 | 2979 | 2.67 | 0.095 |
| Within group | 10 | 11172 | 1117 | ||
| Total | 14 | 23086 | |||