

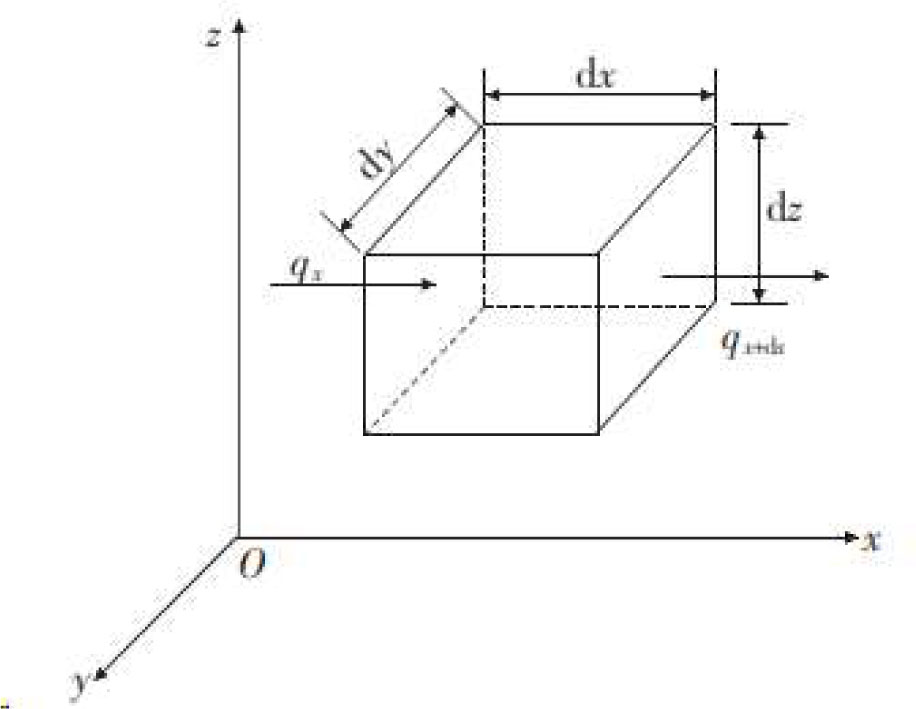
Figure 1:
Heat flow diagram
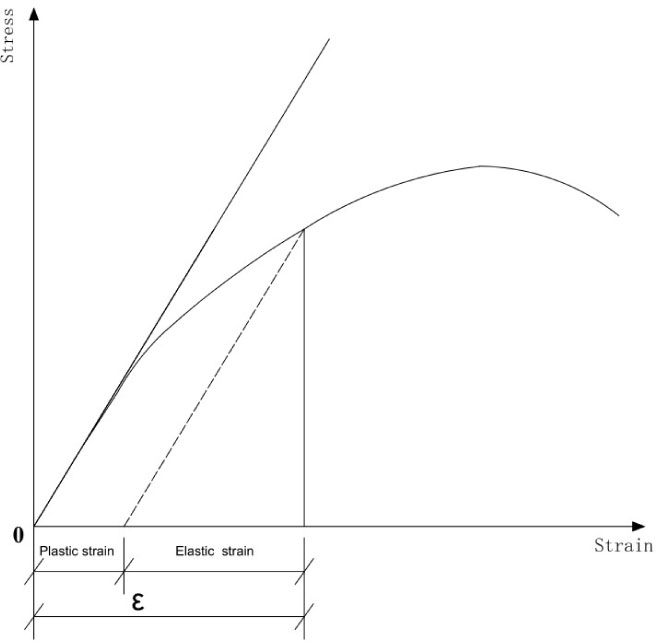
Figure 2:
Stress-strain curve during tension
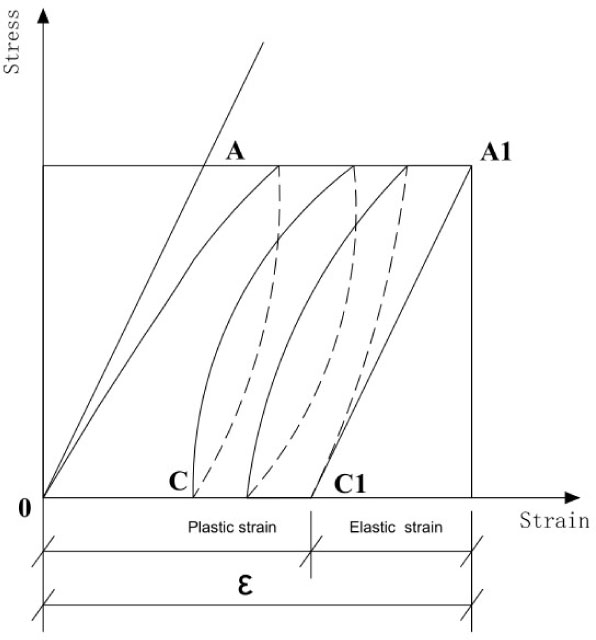
Figure 3:
Stress-strain curve under repeated loads
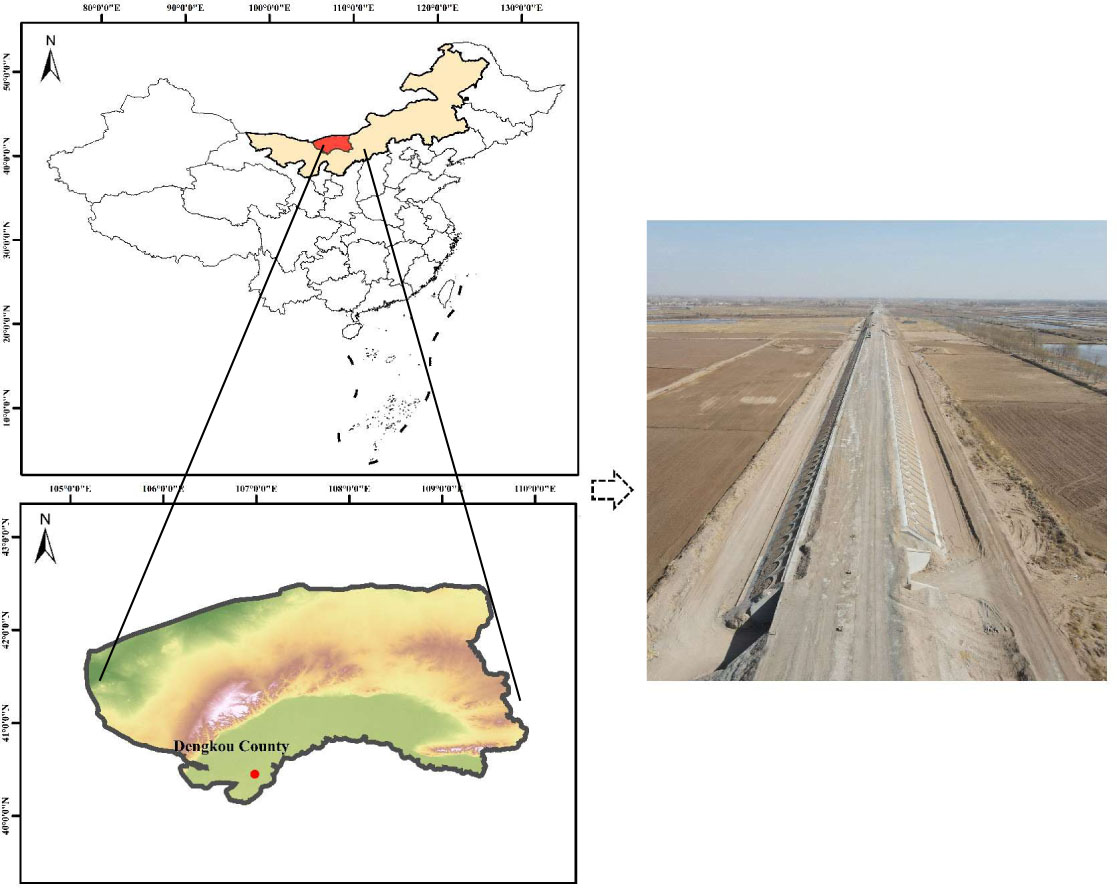
Figure 4:
Geographical position
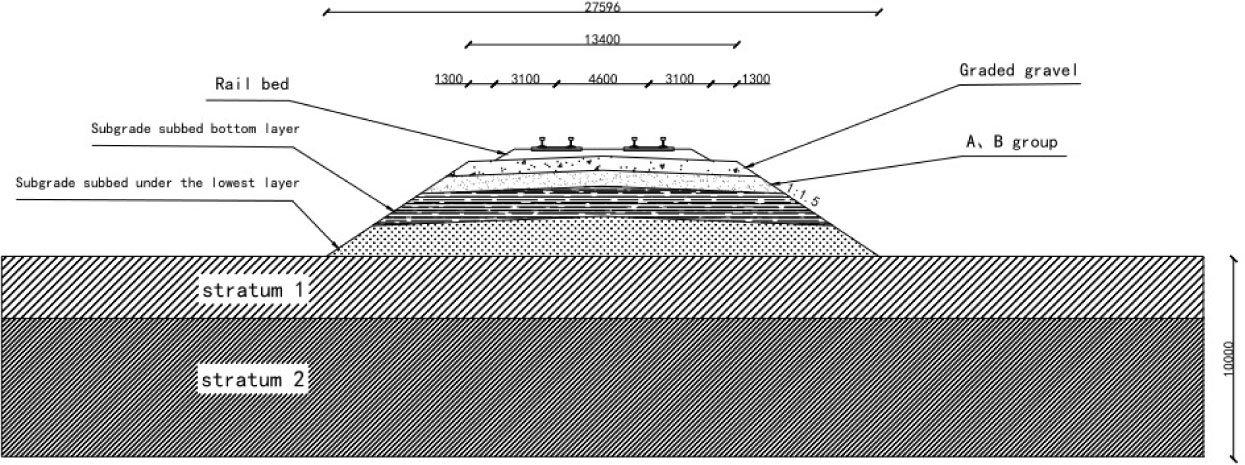
Figure 5:
Schematic diagram of subgrade filling in improved soil
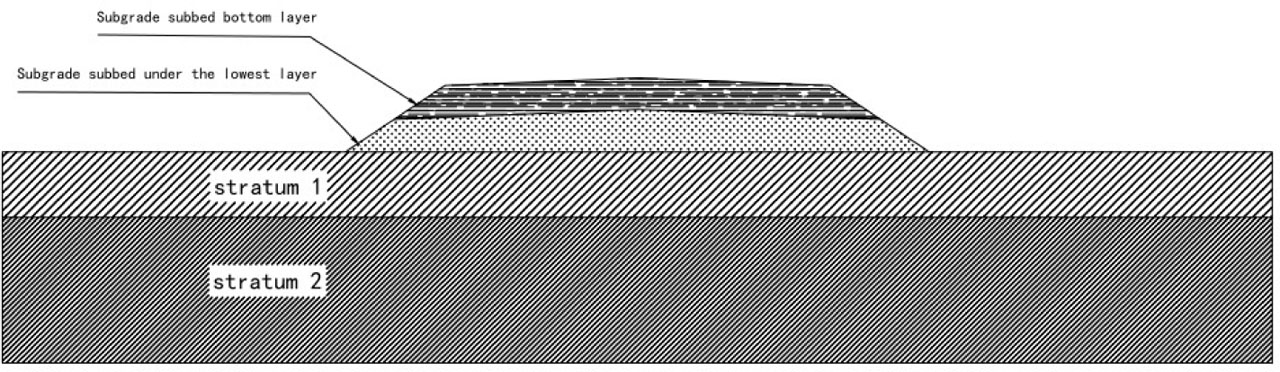
Figure 6:
Schematic diagram of subgrade section
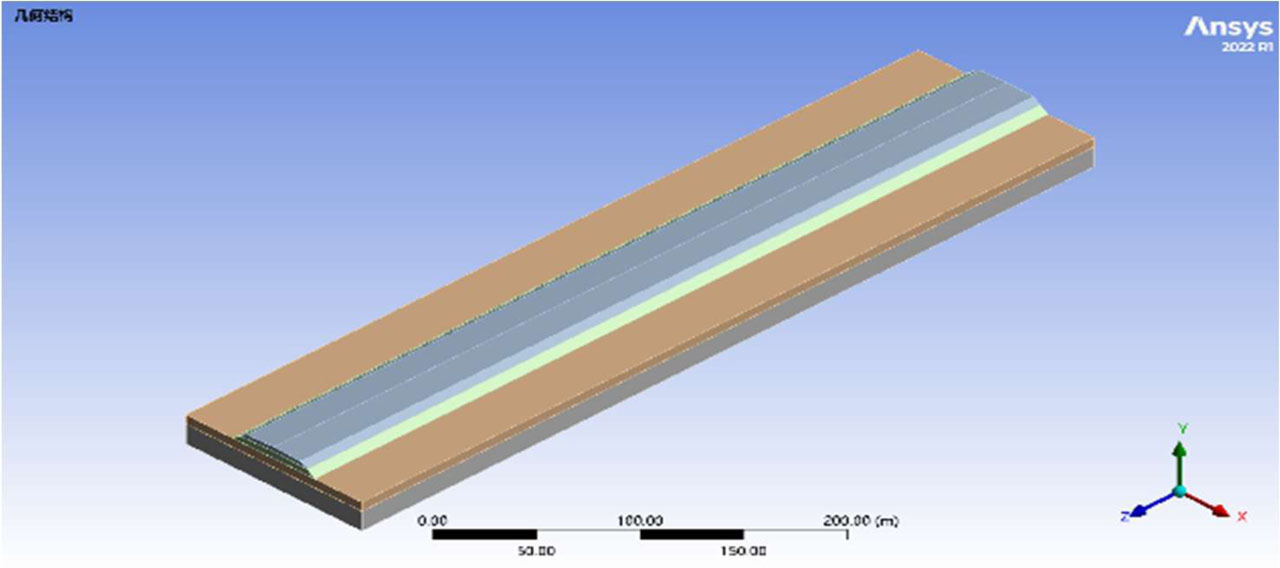
Figure 7:
Example finite element calculation model
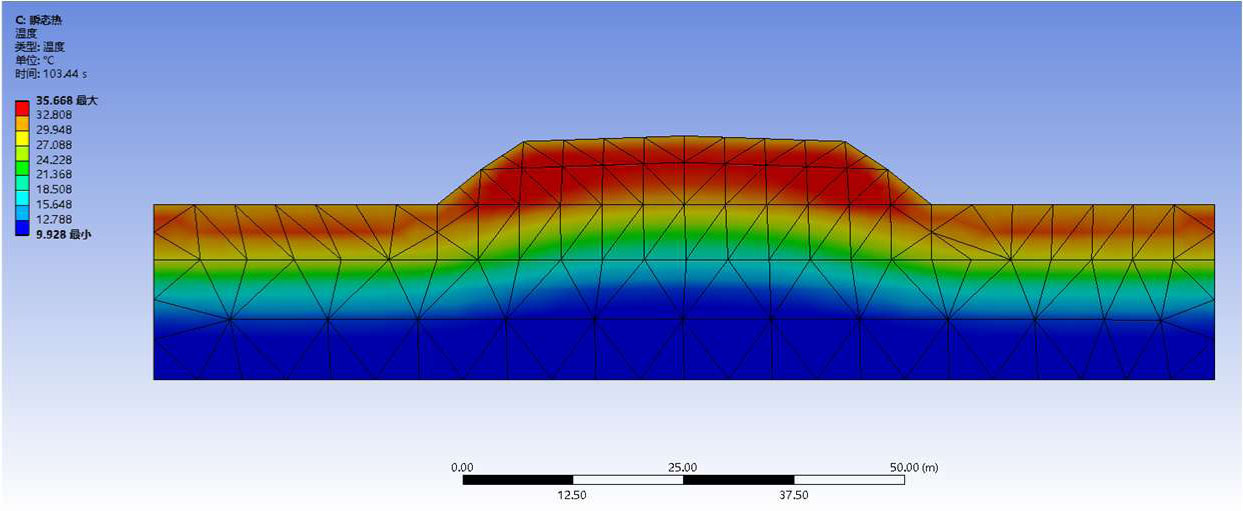
Figure 8:
Cross-section of temperature field
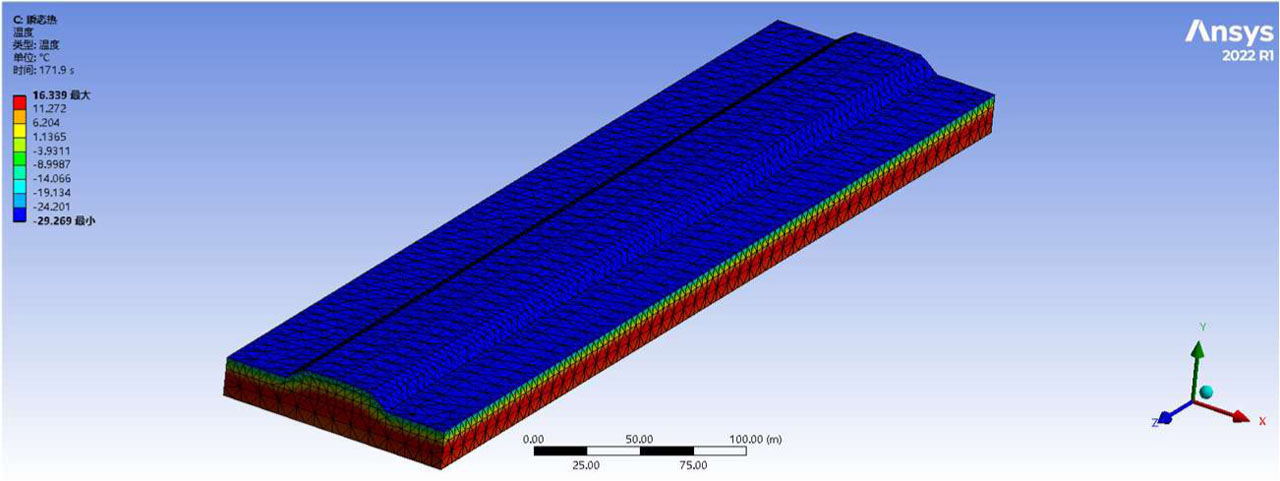
Figure 9:
Temperature field simulation diagram
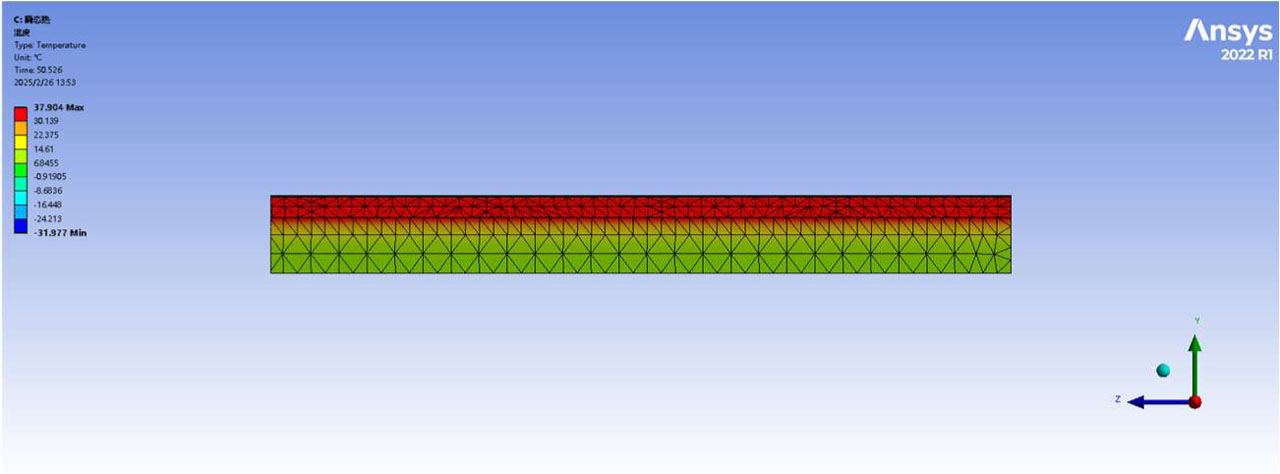
Figure 10:
Profile of temperature field
Table 1:
Thermal parameters of soil improved by aeolian sand
| Subgrade formation | Thermal conductivity [W/m.°C] | Specific Heat Capacity [J/kg.°C] | Density [kg/m3] | Modulus of elasticity [MPa] | Poisson's ratio | Coefficient of thermal expansion [1/°C] |
|---|---|---|---|---|---|---|
| Foundation bed | 0.9258 | 744.3 | 1.92 | 100 | 0.3 | 1e-05 |
| Subbed | 1 | 744.3 | 1.92 | 40 | 0.35 | 1e-05 |
Table 2:
Formation thermal parameters
| Subgrade formation | Thermal conductivity [W/m.°C] | Specific Heat Capacity [J/kg.°C] | Density [kg/m3] | Modulus of elasticity [Pa] | Poisson's ratio |
|---|---|---|---|---|---|
| Formation 1 | 0.5 | 700 | 1.5 | 1.2e+08 | 0.28 |
| Formation 2 | 0.3 | 700 | 2 | 1.2e+08 | 0.28 |
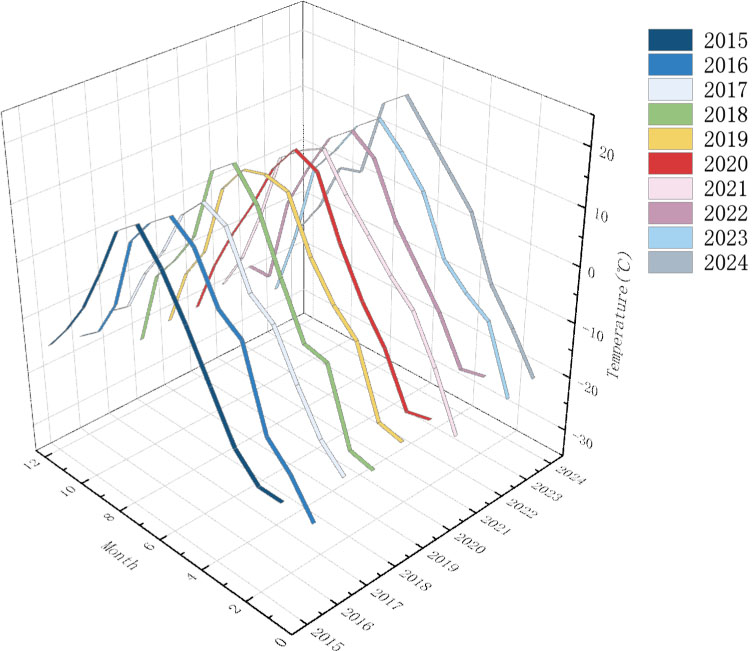
Figure 11:
Minimum monthly temperatures from 2015 to 2024
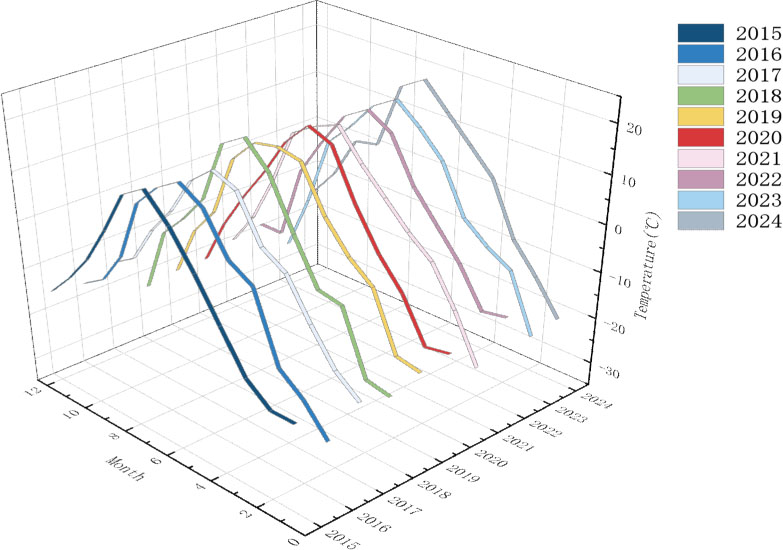
Figure 12:
Maximum monthly temperatures from 2015 to 2024
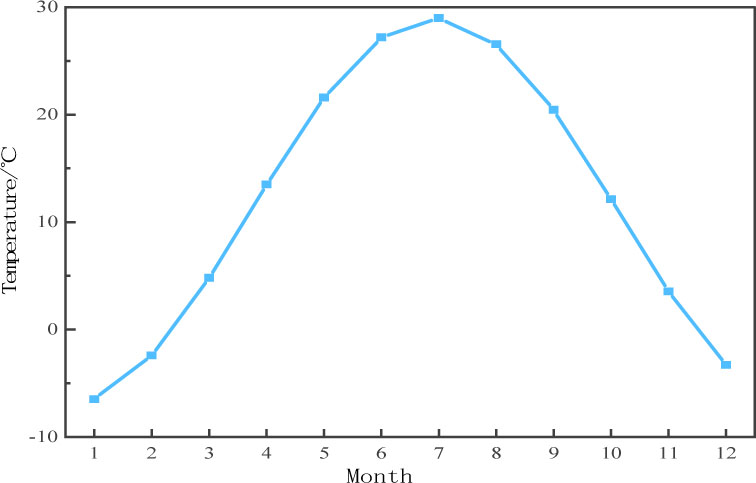
Figure 13:
Function image of monthly temperature change throughout the year
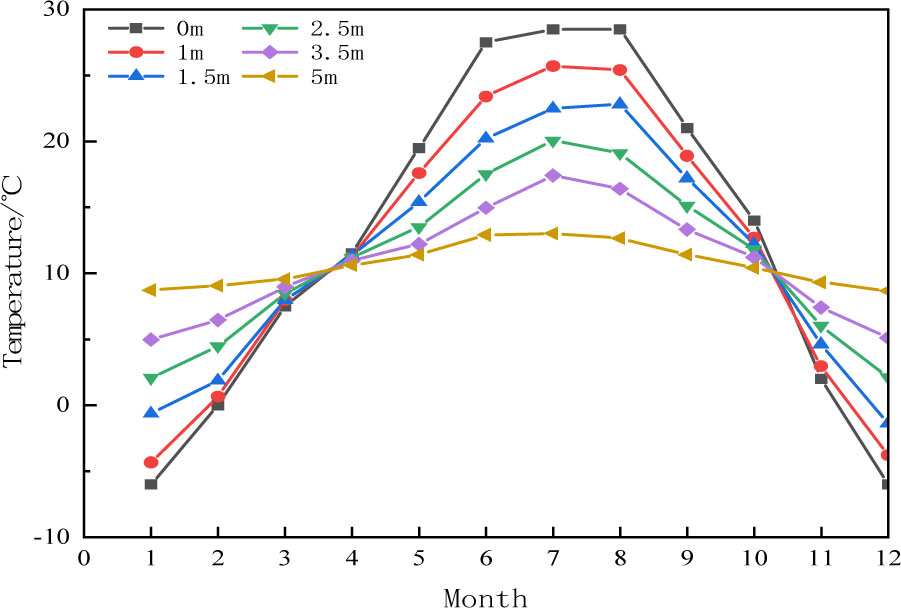
Figure 14:
Temperature of subgrade under different buried depths
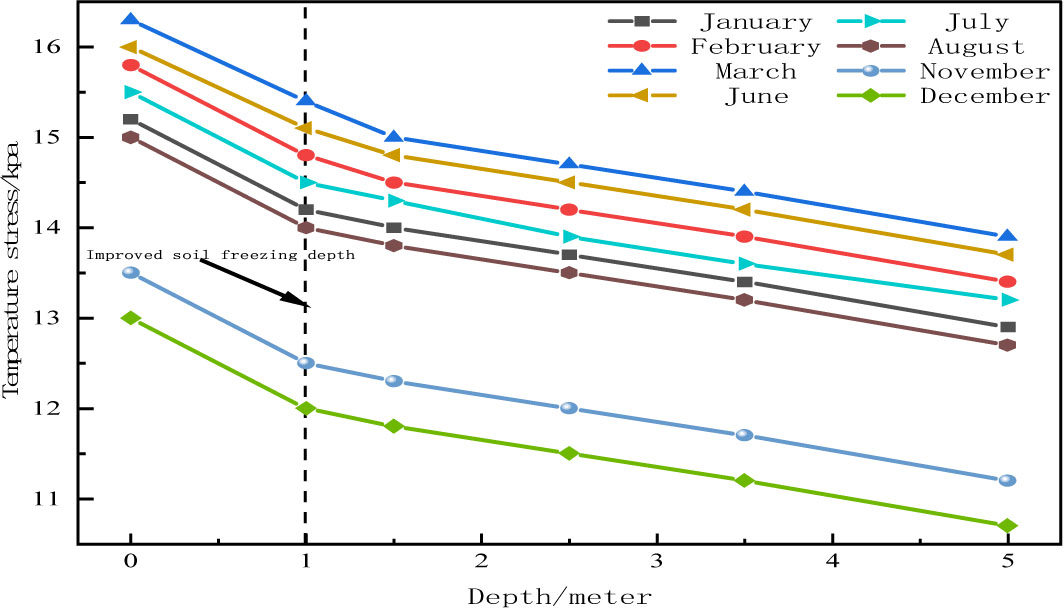
Figure 15:
Temperature stress at different burial depths
Table 3:
Temperature stress fatigue parameters of road surface in recent ten years (without joint)
| Year | Mean monthly temperature difference [°C] | Monthly mean temperature stress levelλ [KPa] | Average monthly temperature fatigue times N2 | Fatigue life year |
|---|---|---|---|---|
| 2015 | 25.4 | 0.1632 | 92217.64 | 88.70 |
| 2016 | 27.3 | 0.1740 | 79627.56 | 77.75 |
| 2017 | 25.5 | 0.1719 | 93248.77 | 75.87 |
| 2018 | 26.3 | 0.1684 | 79467.30 | 82.44 |
| 2019 | 25.3 | 0.1641 | 86923.24 | 87.14 |
| 2020 | 26.0 | 0.1627 | 85305.66 | 89.32 |
| 2021 | 26.3 | 0.1705 | 60396.46 | 83.36 |
| 2022 | 25.7 | 0.1680 | 95897.05 | 83.37 |
| 2023 | 27.5 | 0.1715 | 59280.17 | 83.82 |
| 2024 | 25.3 | 0.1646 | 81027.25 | 88.61 |
| Average fatigue life/year | 84.04 |
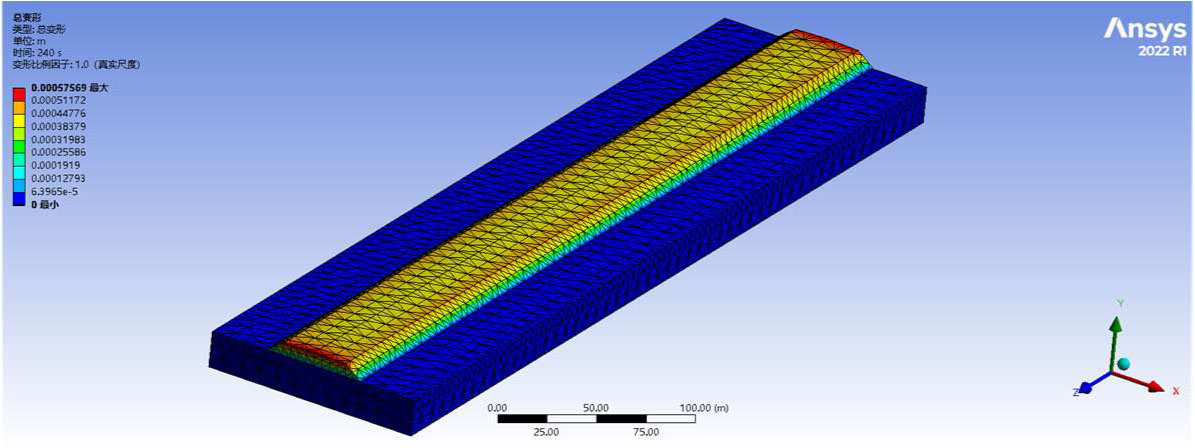
Figure 16:
Total simulated deformation of subgrade (seamless)
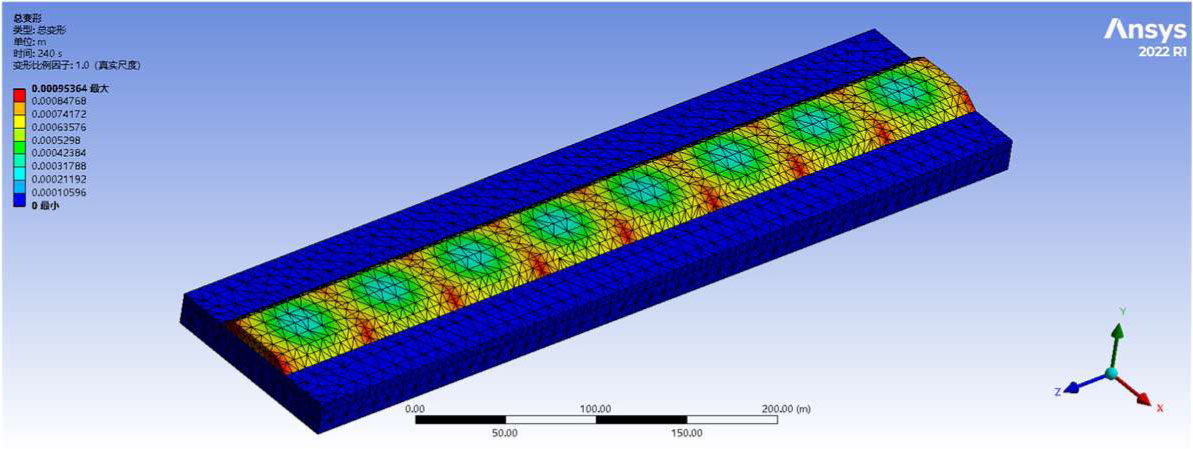
Figure 17:
Total simulated deformation of subgrade (with cracks)
Table 4:
Temperature stress fatigue parameters of road surface in recent ten years (joint)
| Year | Mean monthly temperature difference [°C] | Monthly mean temperature stress levelλ [KPa] | Average monthly temperature fatigue times N2 | Fatigue life year |
|---|---|---|---|---|
| 2015 | 25.4 | 0.1423 | 106925.42 | 118.99 |
| 2016 | 27.3 | 0.1513 | 91950.22 | 105.11 |
| 2017 | 25.5 | 0.1486 | 107796.98 | 104.44 |
| 2018 | 26.3 | 0.1464 | 92521.91 | 111.42 |
| 2019 | 25.3 | 0.1425 | 100987.50 | 117.88 |
| 2020 | 26.0 | 0.1420 | 99127.60 | 119.70 |
| 2021 | 26.3 | 0.1481 | 71613.75 | 113.27 |
| 2022 | 25.7 | 0.1459 | 110358.63 | 113.01 |
| 2023 | 27.5 | 0.1493 | 70225.44 | 113.06 |
| 2024 | 25.3 | 0.1428 | 94610.40 | 120.32 |
| Average fatigue life/year | 113.72 |
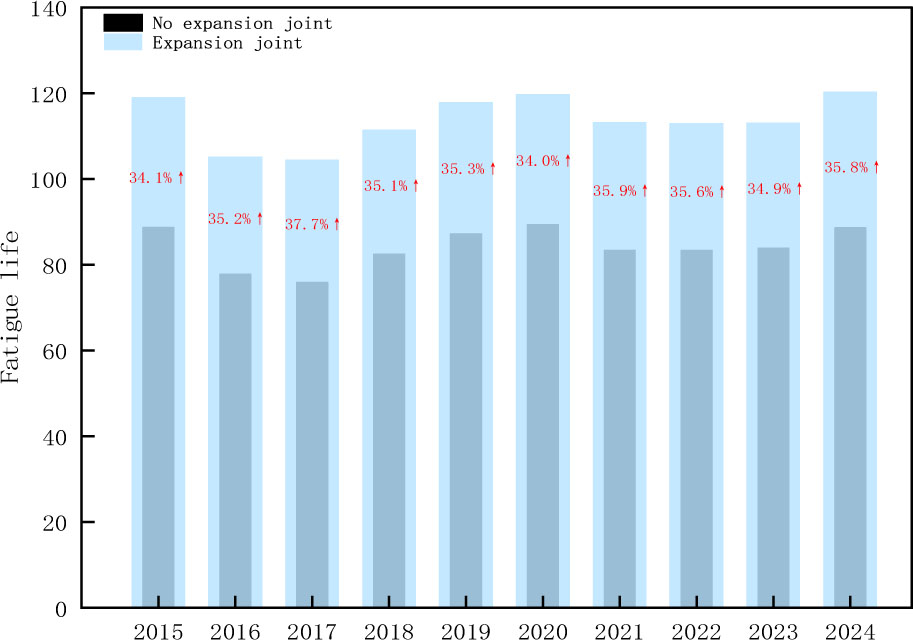
Figure 18:
Increase the extension of fatigue life of expansion joints
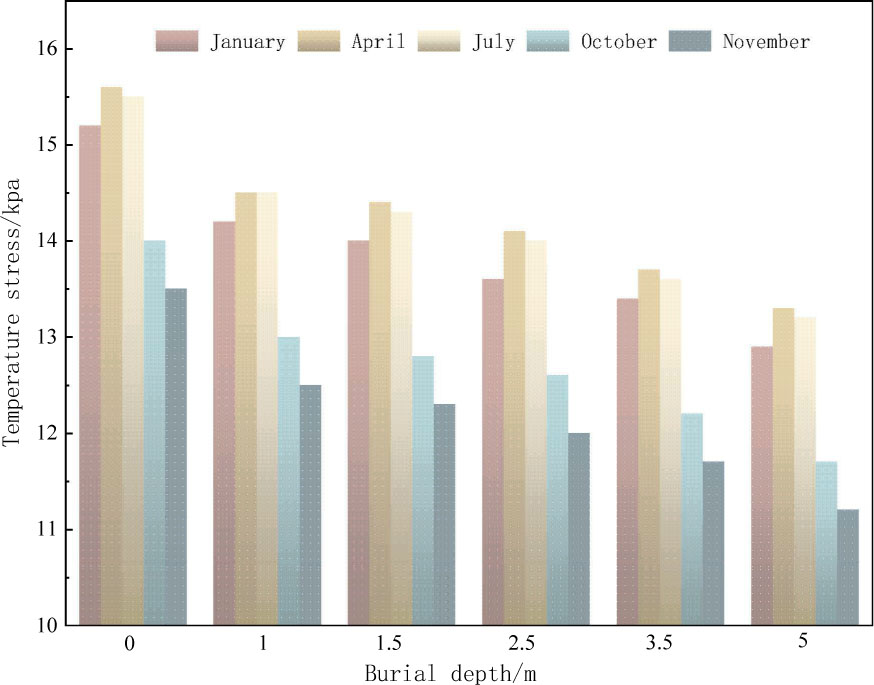
Figure 19:
Temperature stress under different temperature differences