

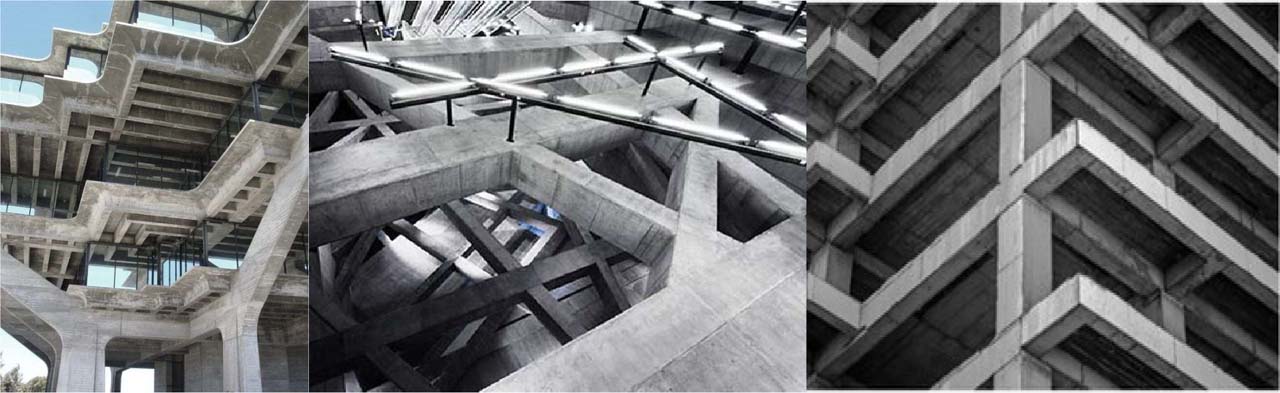
Figure 1:
Beam with out-of-plane parts applications
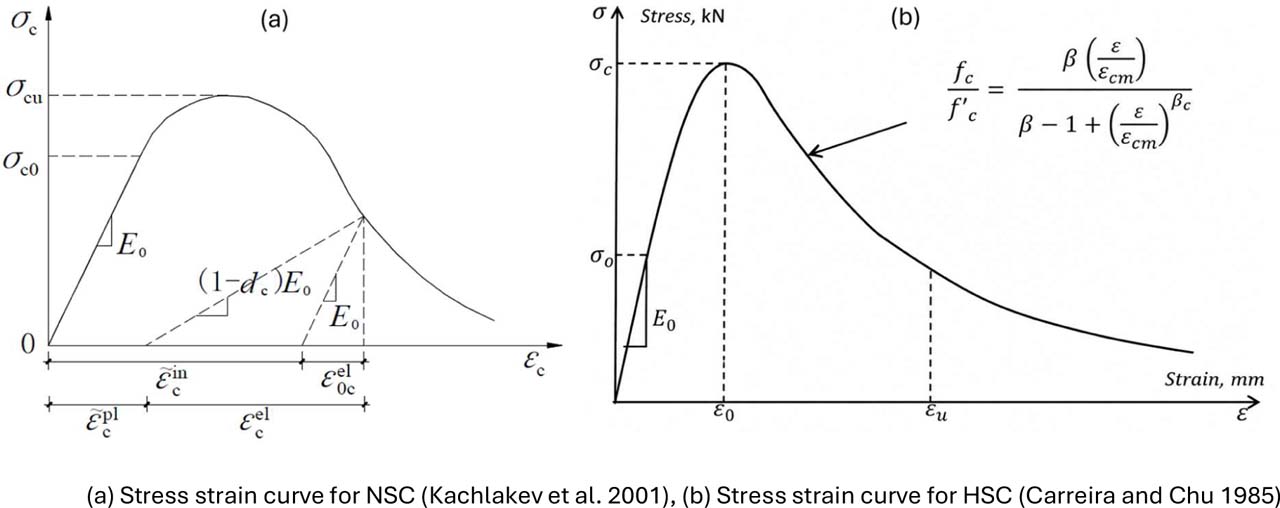
Figure 2:
Plastic damage curve of ordinary concrete under uniaxial compression
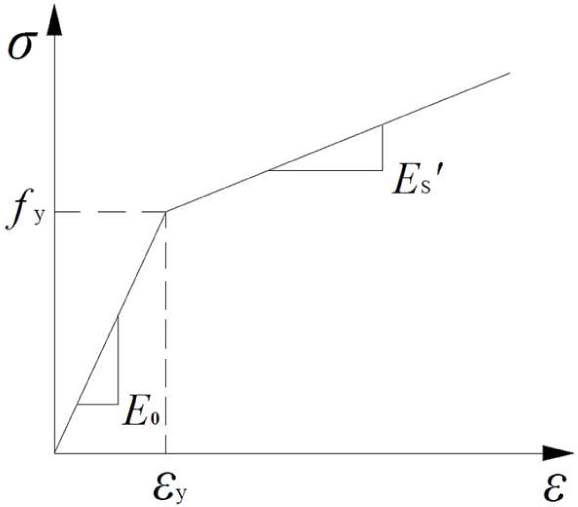
Figure 3:
Stress–strain curve of steel [24]
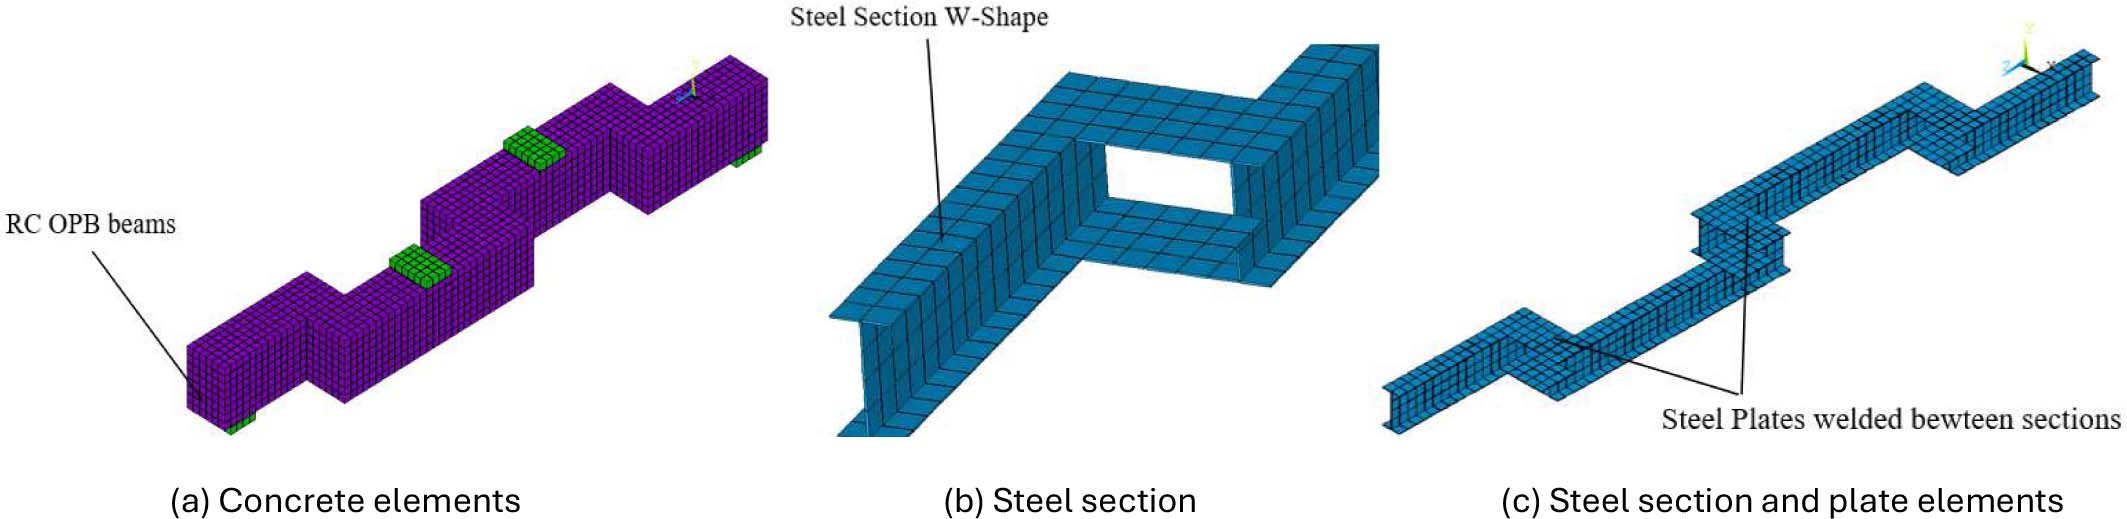
Figure 2:
The finite element model shows the mesh of OPB beams in ANSYS
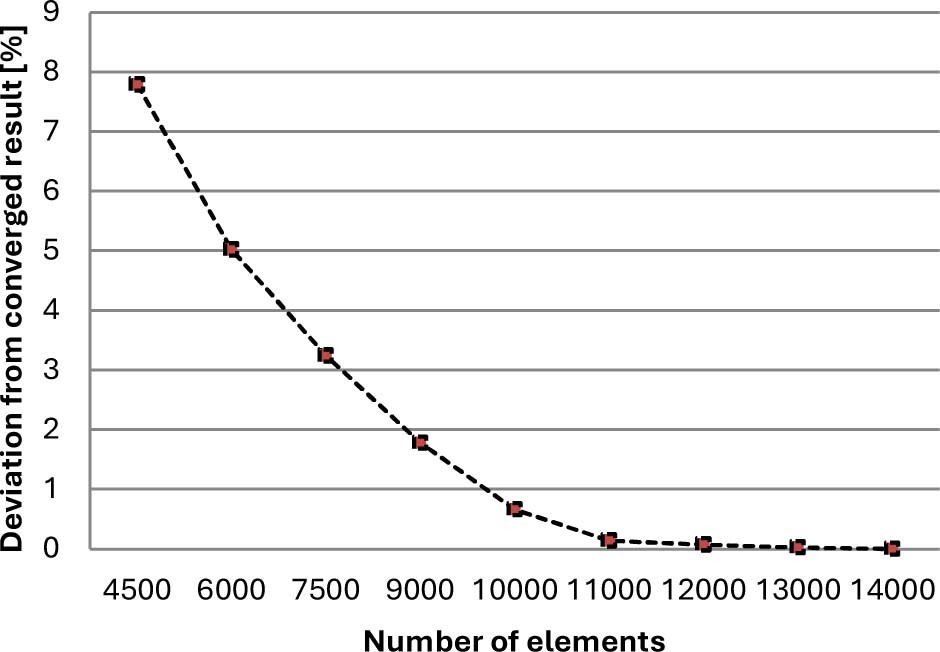
Figure 3:
FE model mesh analysis curve
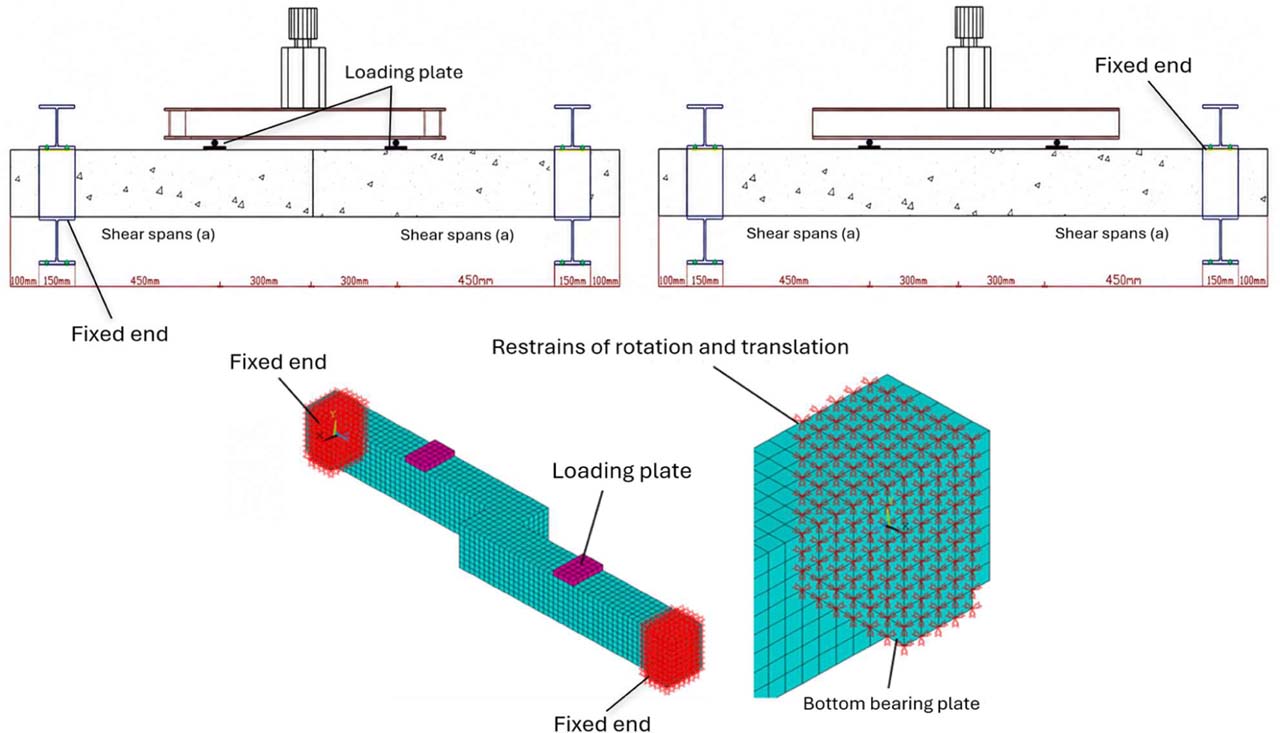
Figure 4:
Boundary condition of OPB beams details
Table 1:
Verification results include the failure load
| SP | Experimental load PE [kN] By (Mohsin et al. 2021) | Numerical load PN [kN] by (Albegmprli et al. 2025) | Numerical load PN (kN) | Matching (1) of PE and PN | Matching (2) of PE and PN |
|---|---|---|---|---|---|
| NSC-1OP | 369.2 | 364.77 | 376.42 | 101.96% | 103.19% |
| HSC-1OP | 385.99 | 363.99 | 394.54 | 102.22% | 108.39% |
| HSC-1OPT | 460.49 | 467.40 | 484.87 | 105.29% | 103.74% |
Table 2:
Verification results include the maximum displacement
| SP | Experimental Disp. ∆E (mm) (Mohsin et al. 2021) | Numerical Disp. ∆N (mm) (Albegmprli et al. 2025) | Numerical Disp. ∆N (mm | Matching (2) of ∆E and ∆N | Matching (2) of ∆E and ∆N |
|---|---|---|---|---|---|
| NSC-1OP | 61.21 | 54.97 | 53.11 | 91.67% | 96.62% |
| HSC-1OP | 51.22 | 51.15 | 47.53 | 92.80% | 92.92% |
| HSC-1OPT | 49.62 | 48.63 | 46.21 | 93.13% | 95.02% |
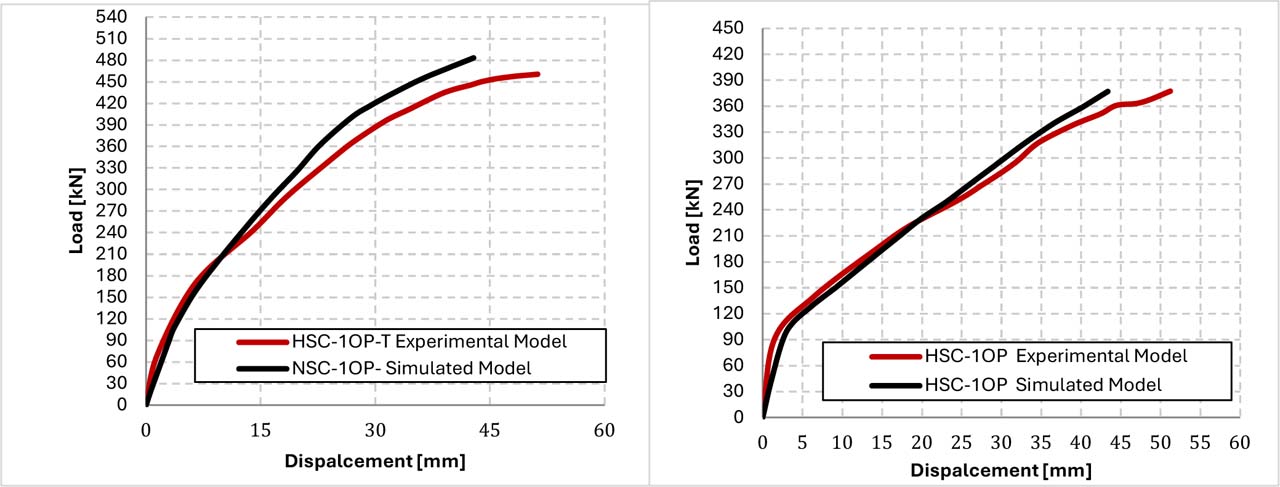
Figure 5:
Comparison between the experimental and simulated OPB beams
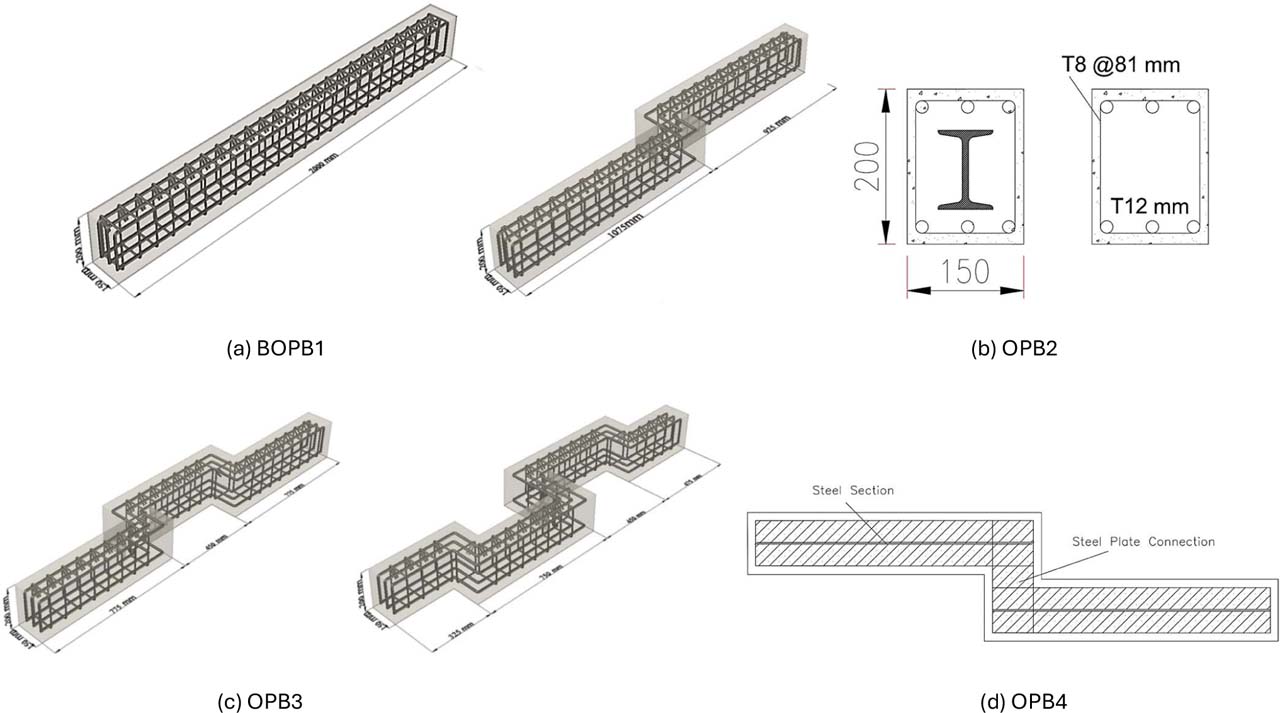
Figure 6:
Series one beams details
Table 3:
Details of specimens
| ID | Concrete Type | f′c (N/mm2) | Fr (N/mm2) | βt | βc | EC (N/mm2) | OPBs Number |
|---|---|---|---|---|---|---|---|
| BOPB1 | NSC | 40 | 3.92 | 0.213 | 0.718 | 29.73 × 10³ | Linear Section |
| NSC-OPB2 | NSC | 40 | 3.92 | 0.327 | 0.841 | 29.73 × 10³ | Two segments |
| NSC-OPB3 | NSC | 40 | 3.92 | 0.294 | 0.653 | 29.73 × 10³ | Three segments |
| NSC-OPB4 | NSC | 40 | 3.92 | 0.221 | 0.709 | 29.73 × 10³ | Four segments |
| NSC-OPB2C | NSC | 40 | 3.92 | 0.341 | 0.829 | 29.73 × 10³ | Two segments |
| NSC-OPB3C | NSC | 40 | 3.92 | 0.259 | 0.665 | 29.73 × 10³ | Three segments |
| NSC-OPB4C | NSC | 40 | 3.92 | 0.276 | 0.691 | 29.73 × 10³ | Four segments |
| HSC-OPB2 | HSC | 70 | 5.54 | 0.237 | 0.734 | 31.35 × 10³ | Two segments |
| HSC-OPB3 | HSC | 70 | 5.54 | 0.331 | 0.673 | 31.35 × 10³ | Three segments |
| HSC-OPB4 | HSC | 70 | 5.54 | 0.297 | 0.805 | 31.35 × 10³ | Four segments |
| HSC-OPB2C | HSC | 70 | 5.54 | 0.289 | 0.847 | 31.35 × 10³ | Two segments |
| HSC-OPB3C | HSC | 70 | 5.54 | 0.266 | 0.621 | 31.35 × 10³ | Three segments |
| HSC-OPB4C | HSC | 70 | 5.54 | 0.323 | 0.788 | 31.35 × 10³ | Four segments |
Table 4:
Results of NSC and HSCOPB
| Variable | ID | Yield load (kN) | Yield disp. (mm) | Failure load (kN) | δ corr. To Pu (mm) | εmax | Von Mises εmax | Von mises σmax (MPa) |
|---|---|---|---|---|---|---|---|---|
| Series One ref. | BOPB1 | 184.52 | 8.92 | 604.66 | 30.12 | 0.00373 | 0.019236 | 405.19 |
| NSC | NSC-OPB2 | 138.97 | 10.17 | 379.41 | 42.46 | 0.01981 | 0.057806 | 401.19 |
| NSC-OPB3 | 127.56 | 8.56 | 289.37 | 33.36 | 0.02252 | 0.067392 | 401.65 | |
| NSC-OPB4 | 126.18 | 8.44 | 229.14 | 21.44 | 0.02199 | 0.017716 | 180.66 | |
| Composite NSC | NSC-OPB2C | 154.95 | 13.80 | 638.93 | 38.77 | 0.0149 | 0.04512 | 426.51 |
| NSC-OPB3C | 152.43 | 8.88 | 441.00 | 28.46 | 0.01637 | 0.048753 | 412.24 | |
| NSC-OPB4C | 128.07 | 9.45 | 304.30 | 15.84 | 0.01598 | 0.039801 | 384.02 | |
| Series Two ref. | HSC-BOPB1 | 188.00 | 9.20 | 712.89 | 27.84 | 0.00351 | 0.018304 | 412.68 |
| HSC | HSC-OPB2 | 200.67 | 11.15 | 586.57 | 38.78 | 0.01894 | 0.055671 | 397.85 |
| HSC-OPB3 | 168.77 | 7.43 | 430.29 | 22.36 | 0.02131 | 0.064788 | 403.13 | |
| HSC-OPB4 | 142.94 | 8.16 | 353.79 | 21.44 | 0.02011 | 0.015602 | 176.54 | |
| Composite HSC with section | HSC-OPB2C | 225.36 | 11.90 | 730.86 | 36.98 | 0.01387 | 0.041782 | 434.76 |
| HSC-OPB3C | 193.07 | 10.59 | 542.60 | 28.63 | 0.01555 | 0.045501 | 418.23 | |
| HSC-OPB4C | 155.52 | 7.03 | 418.18 | 17.61 | 0.01512 | 0.03634 | 389.56 |
Table 4:
Results percentages of NSC and HSCOPB
| ID | Yield load changing percentage | Yield disp. changing percentage | Failure load: changing percentage | δ changing percentage | εmax changing percentage | Von mises εmax changing percentage | Von mises σmax changing percentage |
|---|---|---|---|---|---|---|---|
| BOPB1 | - | - | - | - | - | - | - |
| NSC-OPB2 | −24.69% | 14.01% | −37.25% | 43.79% | 431.13% | 200.51% | −0.99% |
| NSC-OPB3 | −30.87% | −4.04% | −52.14% | 12.97% | 503.97% | 250.34% | −0.87% |
| NSC-OPB4 | −31.62% | −5.38% | −62.10% | −27.40% | 489.62% | −7.90% | −55.41% |
| NSC-OPB2C | −16.02% | 54.71% | 5.67% | 31.28% | 299.65% | 134.56% | 5.26% |
| NSC-OPB3C | −17.39% | −0.45% | −27.07% | −3.62% | 339.10% | 153.45% | 1.74% |
| NSC-OPB4C | −30.59% | 5.94% | −49.67% | −46.36% | 328.53% | 106.91% | −5.23% |
| HSC-BOPB1 | − | − | − | − | − | − | − |
| HSC-OPB2 | 6.74% | 21.20% | −17.72% | 39.30% | 439.29% | 204.15% | −3.59% |
| HSC-OPB3 | −10.23% | −19.24% | −39.64% | −19.68% | 506.72% | 253.96% | −2.32% |
| HSC-OPB4 | −23.97% | −11.30% | −50.37% | −22.99% | 472.69% | −14.76% | −57.22% |
| HSC-OPB2C | 19.87% | 29.35% | 2.52% | 32.83% | 294.99% | 128.27% | 5.35% |
| HSC-OPB3C | 2.70% | 15.11% | −23.89% | 2.84% | 342.65% | 148.59% | 1.34% |
| HSC-OPB4C | −17.27% | −23.59% | −41.34% | −36.75% | 330.64% | 98.54% | −5.60% |
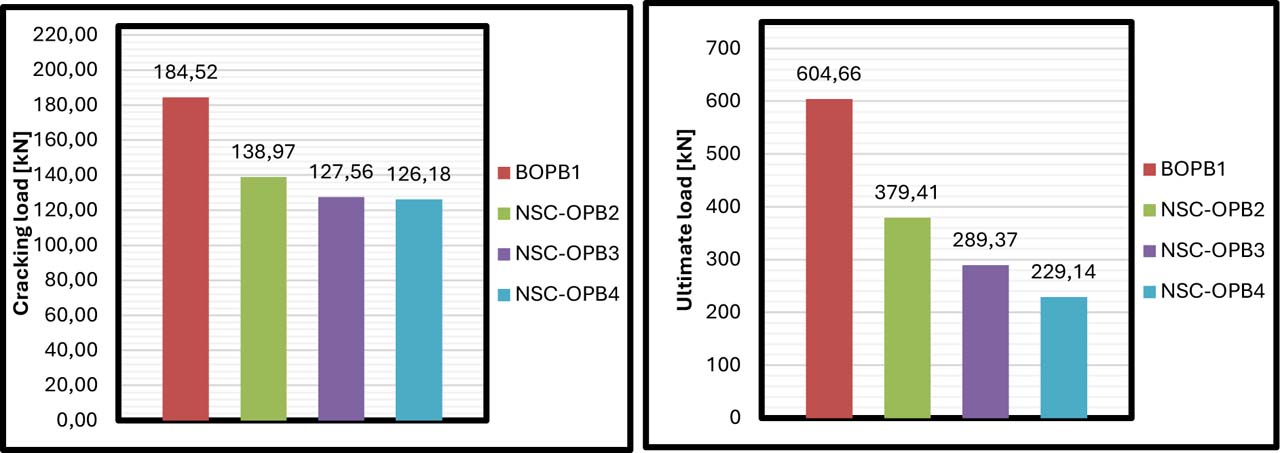
Figure 7:
Cracking and ultimate loads of NSC Non-Composite OPB beams
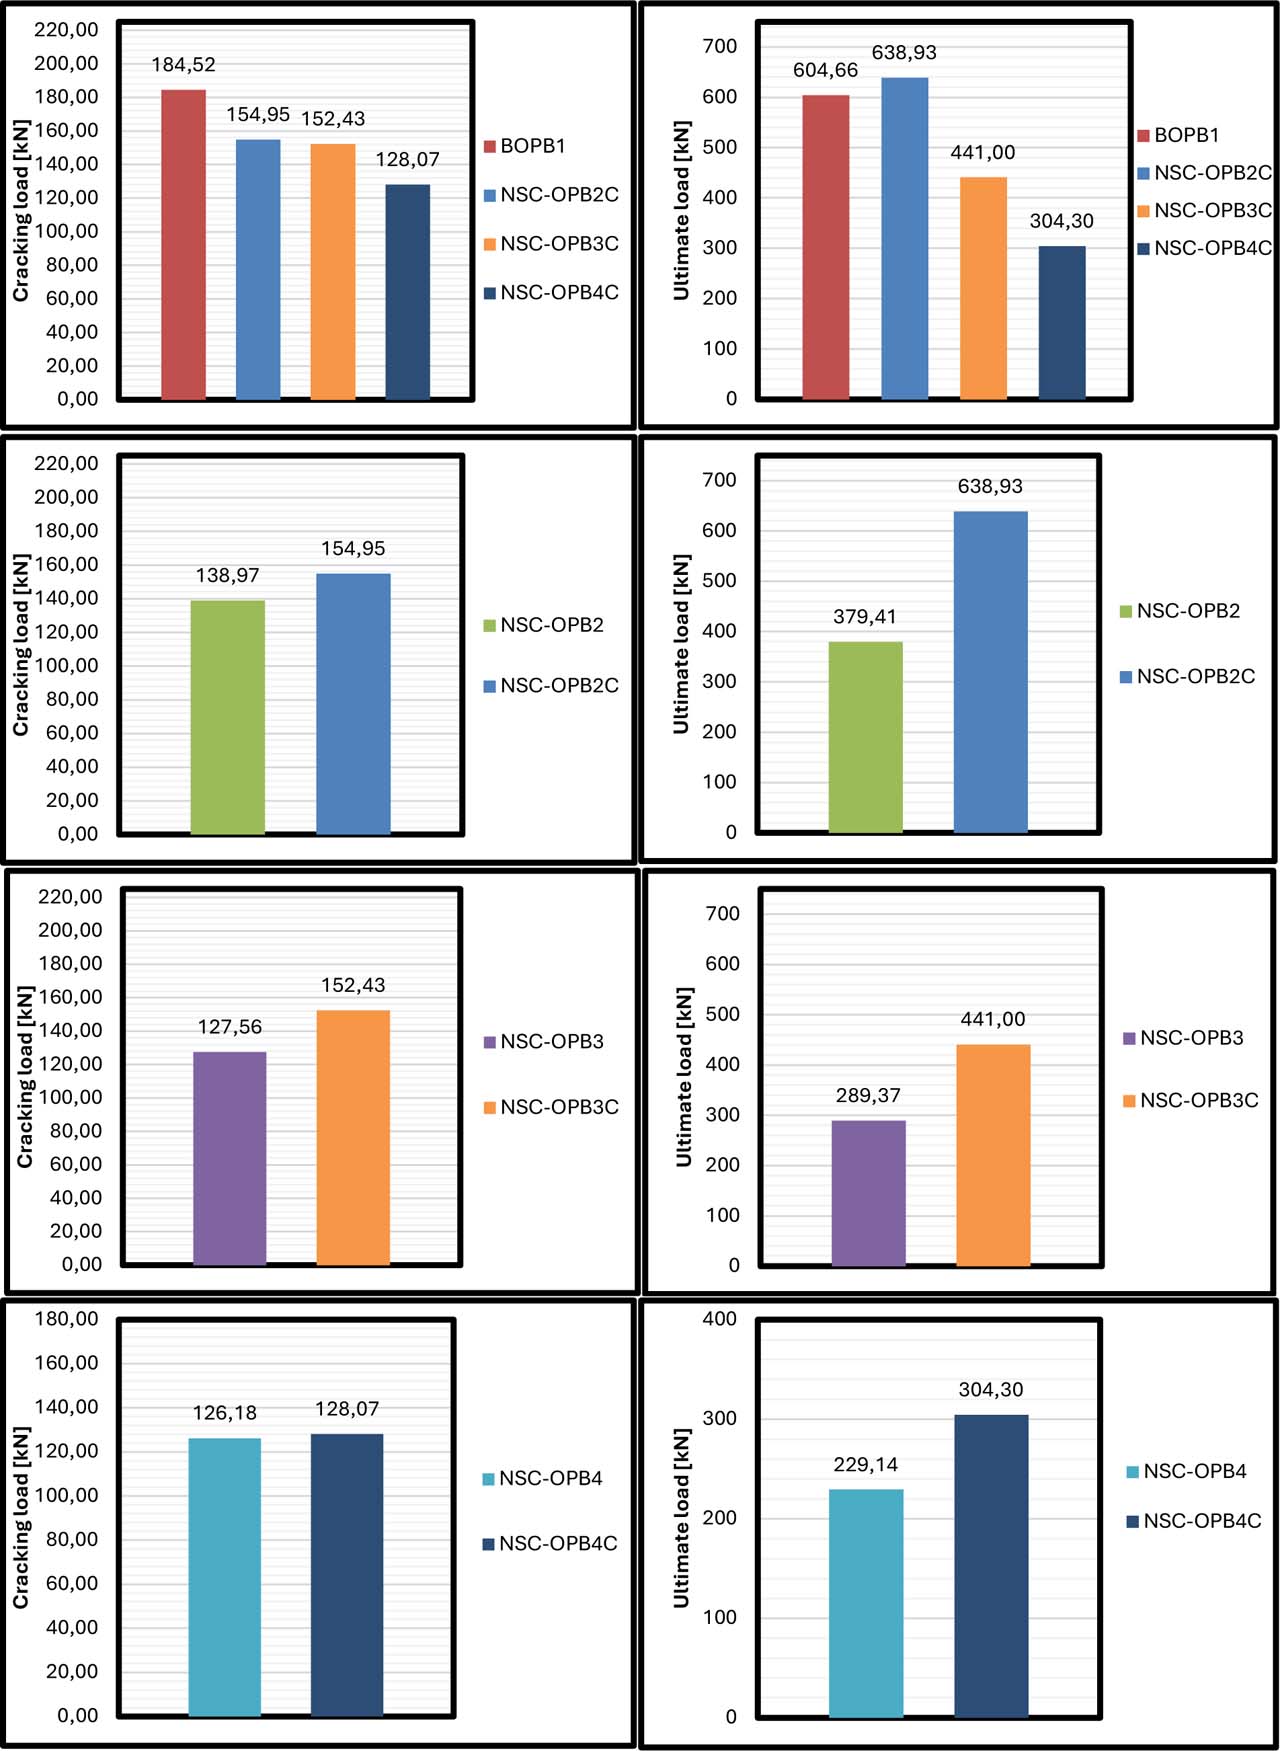
Figure 8:
Cracking and ultimate loads of NSC Composite OPB beams
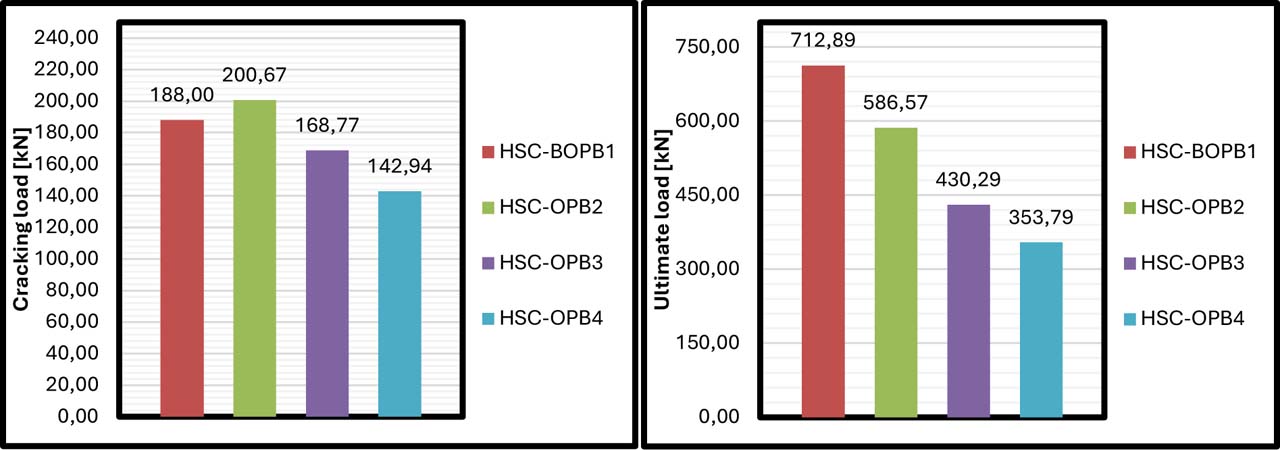
Figure 9:
Cracking and ultimate loads of HSC non-composite OPB beams
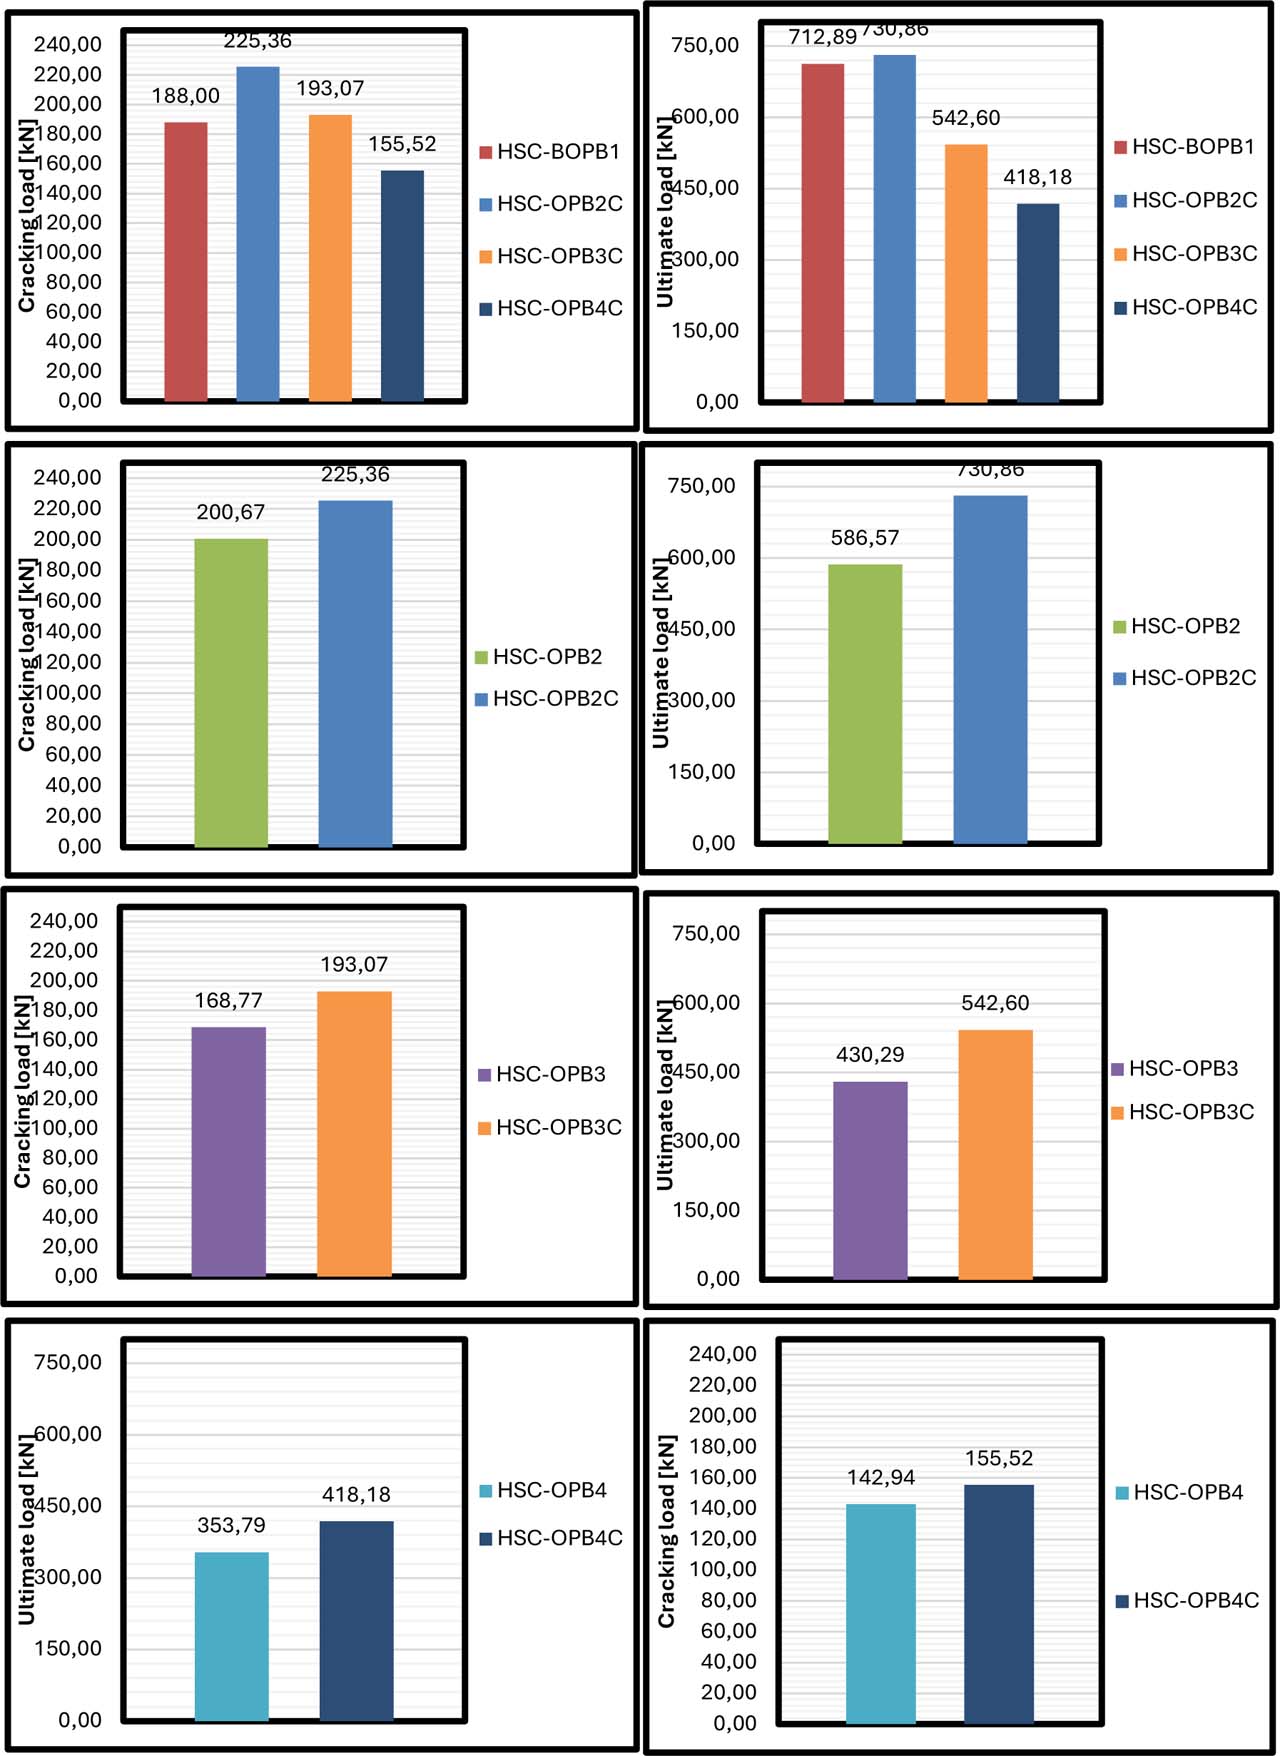
Figure 10:
Cracking and ultimate loads of HSC composite OPB beams
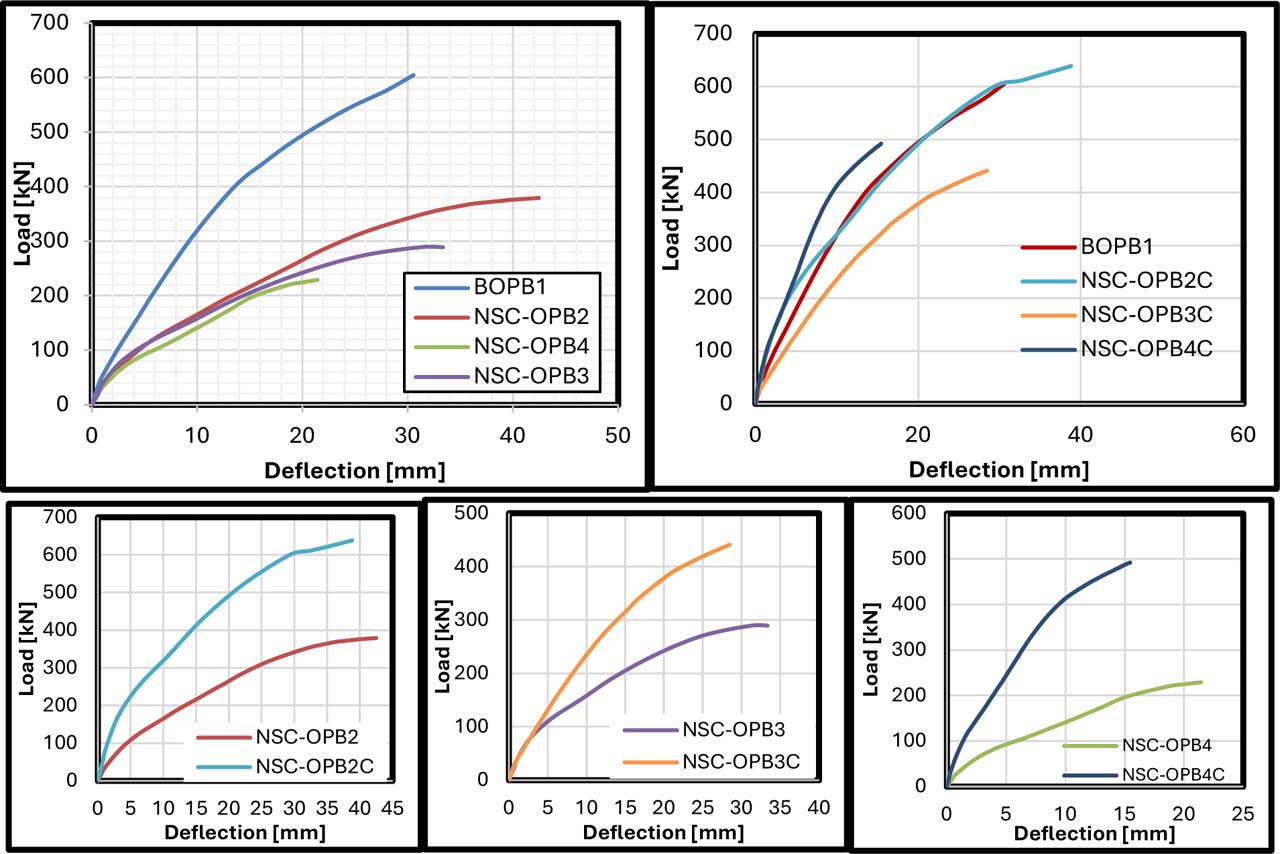
Figure 11:
Load-deflection relationship of NSC OPB beams
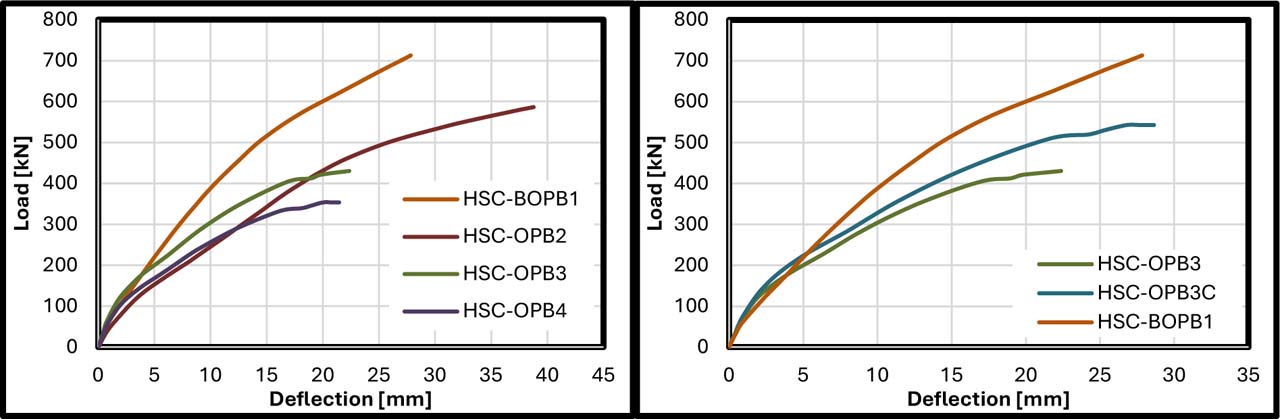
Figure 12:
Load-deflection relationship of HSC OPB beams
Table 5:
Results of ductility indices, initial stiffness, and toughness
| Variable | ID | Ductility index | Ki [kN/mm] | Toughness [kN.mm] |
|---|---|---|---|---|
| Series one ref. | BOPB1 | 3.31 | 20.69 | 8929.60 |
| NSC | NSC-OPB2 | 4.17 | 13.65 | 8055.30 |
| NSC-OPB3 | 3.90 | 14.89 | 4814.40 | |
| NSC-OPB4 | 2.54 | 14.94 | 2457.80 | |
| Composite NSC | NSC-OPB2C | 4.63 | 11.22 | 11786.00 |
| NSC-OPB3C | 2.91 | 17.71 | 9004.20 | |
| NSC-OPB4C | 3.25 | 13.56 | 5856.70 | |
| Series Two Ref. | HSC-BOPB1 | 3.26 | 20.43 | 10693.40 |
| HSC | HSC-OPB2 | 4.28 | 20.07 | 9336.90 |
| HSC-OPB3 | 3.01 | 20.89 | 6906.60 | |
| HSC-OPB4 | 2.45 | 16.95 | 3117.80 | |
| Composite HSC with section | HSC-OPB2C | 4.03 | 25.10 | 12752.10 |
| HSC-OPB3C | 3.28 | 27.51 | 8048.70 | |
| HSC-OPB4C | 2.51 | 22.12 | 3693.10 |
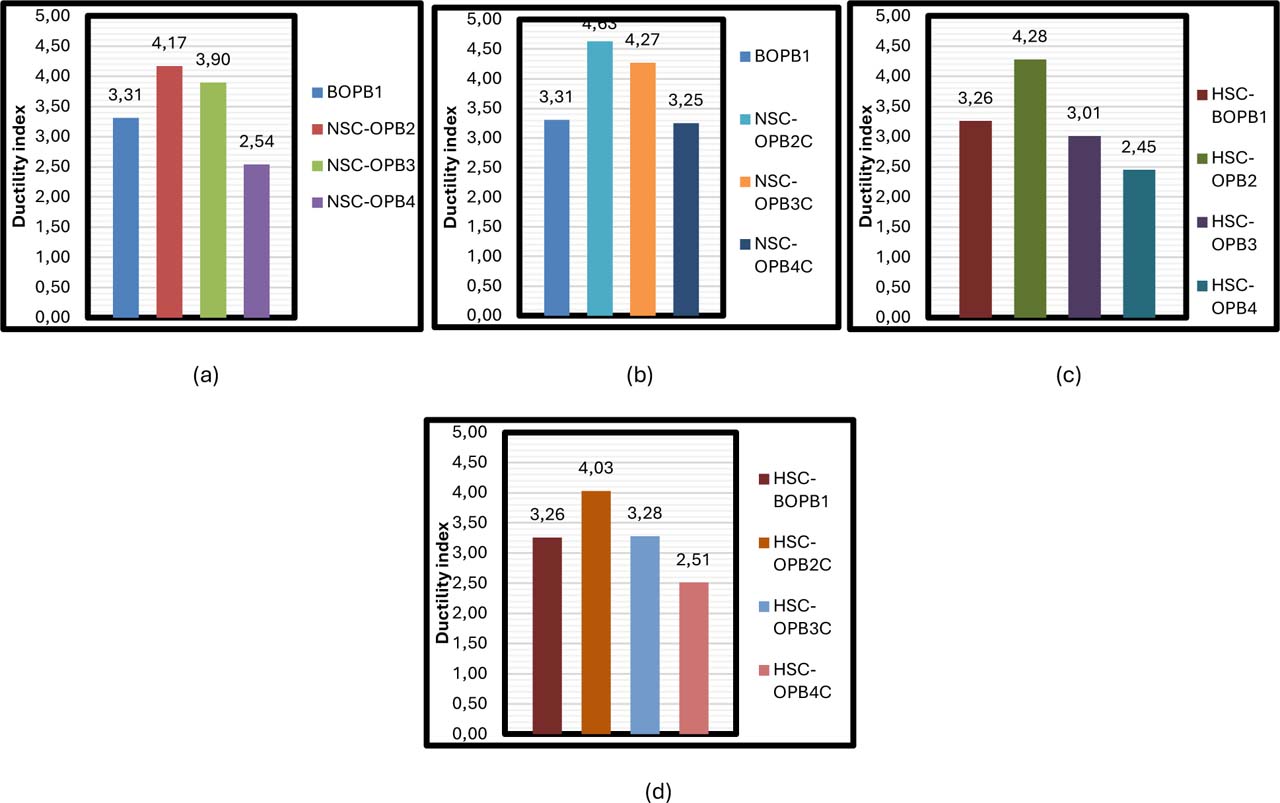
Figure 13:
Ductility index of the OPB beams
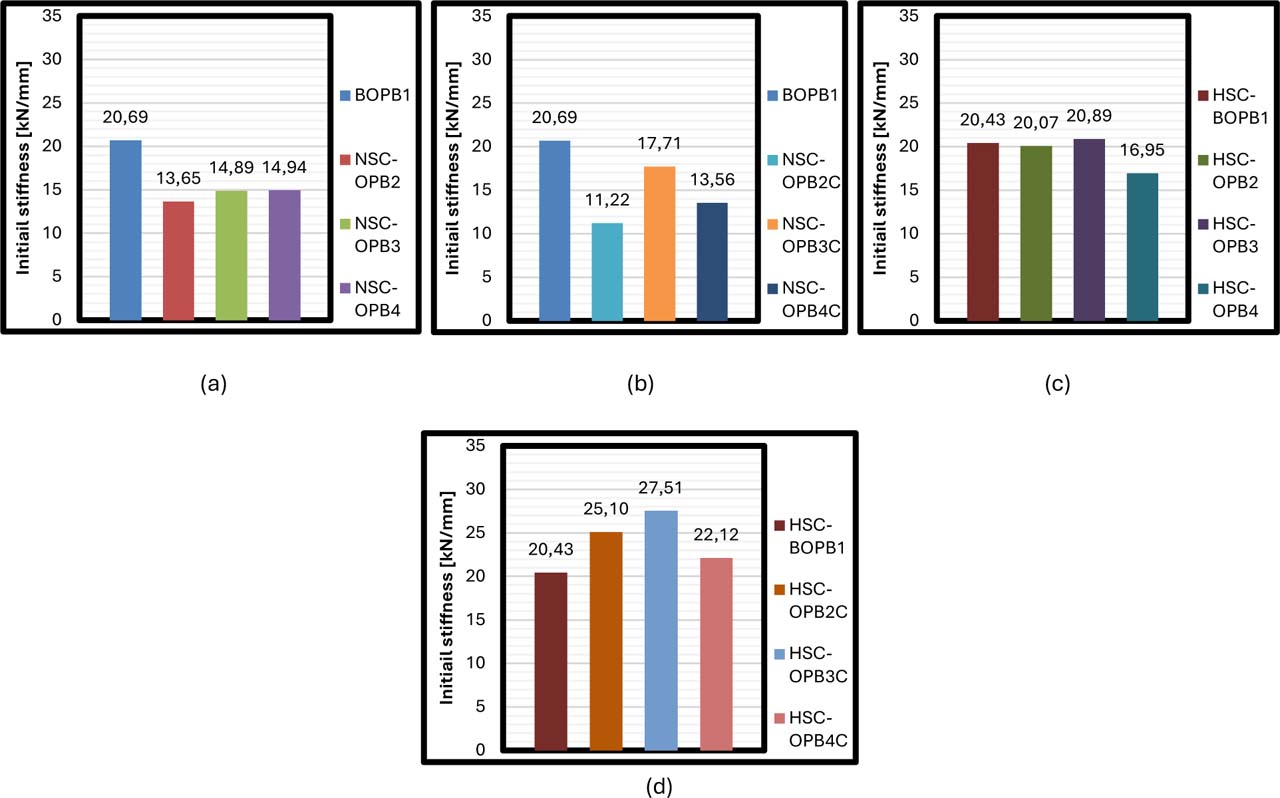
Figure 14:
Initial stiffness of the OPB beams
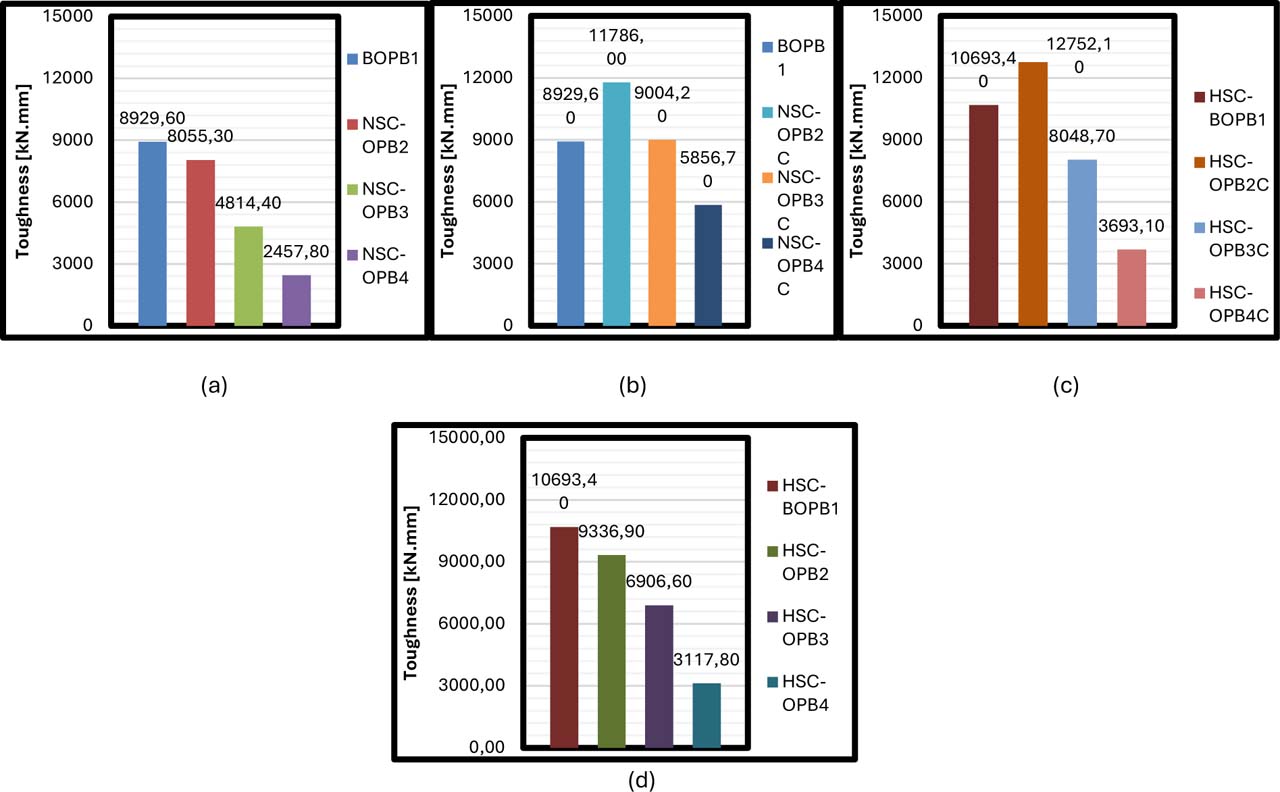
Figure 15:
Toughness of the OPB beams
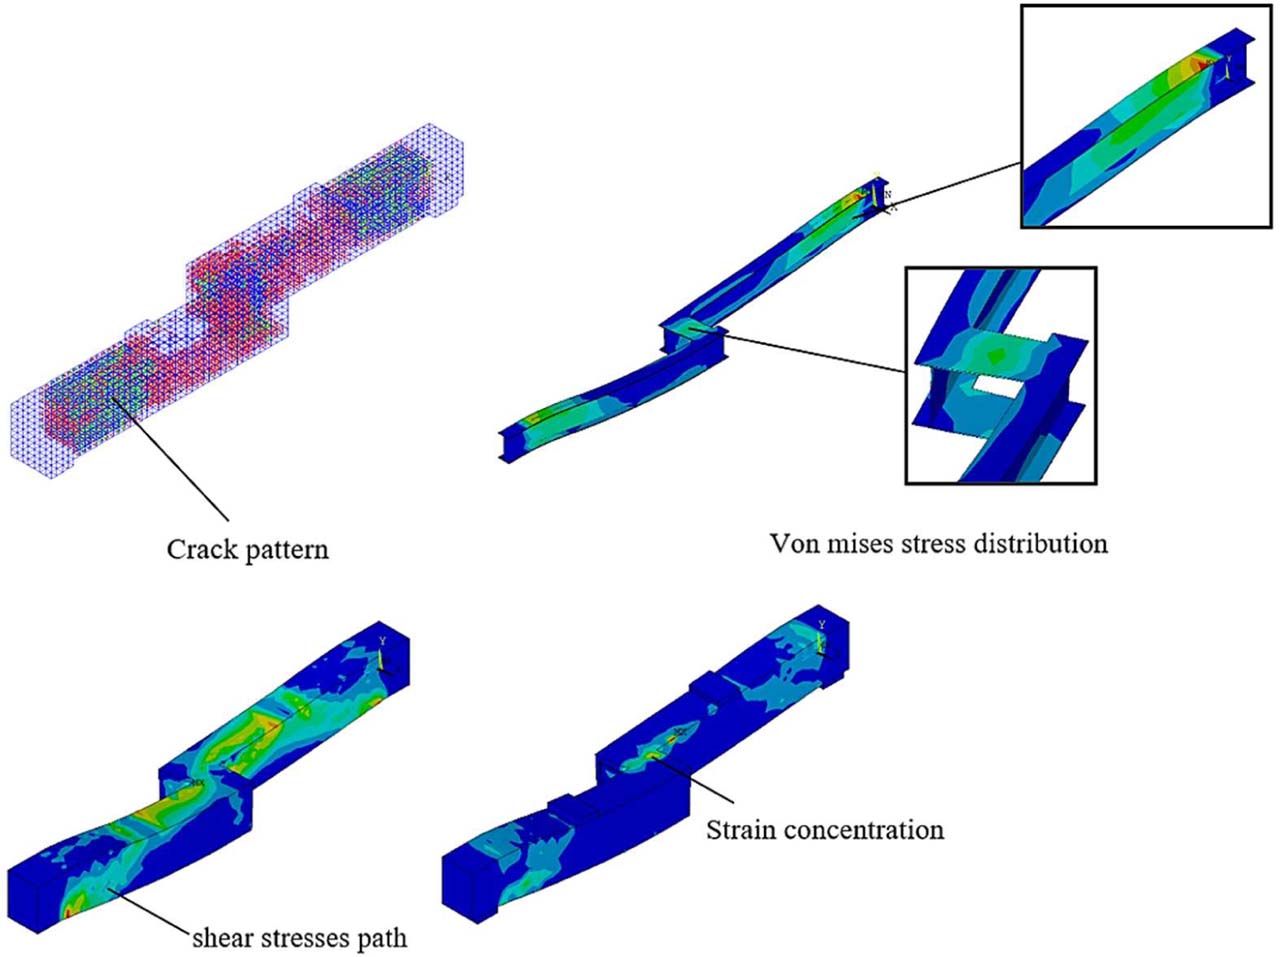
Figure 16:
Cracking mode, stress distribution, and failure mechanism of the NSC-OPB2C beam
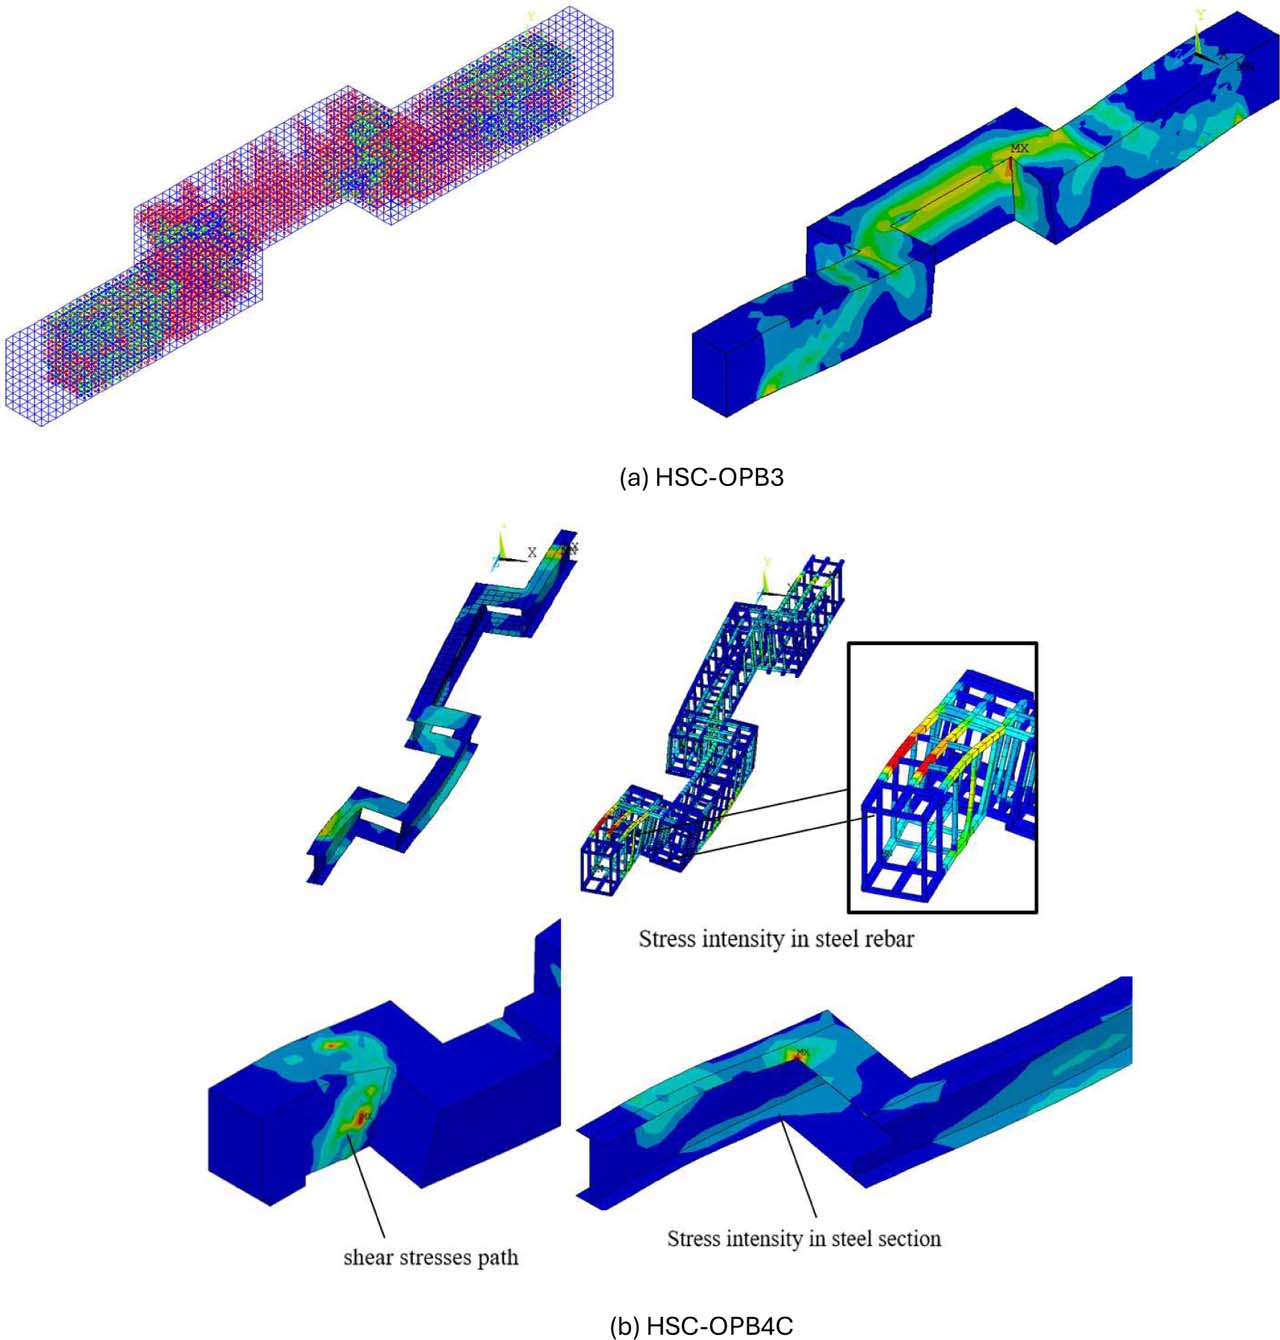
Figure 17:
Cracking mode, stress distribution, and failure mechanism of HSC-OPB beam