

Table 1:
Main properties of the constituent aggregate materials
| Material/property | Bulk specific gravity | SSD specific gravity | Apparent specific gravity | Absorption/result [%] |
|---|---|---|---|---|
| Crushed aggregate, 19 mm | 2.477 | 2.523 | 2.598 | 1.881 |
| Crushed aggregate, 12 mm | 2.554 | 2.571 | 2.598 | 0.659 |
| Stone dust | 2.631 | 2.632 | 2.633 | 0.040 |
| Kampar River sand | 2.580 | 2.630 | 2.720 | 2.040 |
| Los Angeles abrasion [%] | - | - | - | 27.18 |
Table 2:
Characteristics and processing temperatures of the 60/70 penetration-grade binder
| Property/process | Standard | Test condition | Result |
|---|---|---|---|
| Penetration | SNI 2456:2011 | 25 °C, 5 s | 61.4 [0.1 mm] (6.14 mm) |
| Softening point | SNI 2434:2011 | Initial water temperature 25 °C; two results | 48.15 [°C] (48.25; 48.05) |
| Ductility | SNI 2432:2011 | 25 °C; pulling rate 5 cm/min | 146.5 [cm] |
| Kinematic viscosity | SNI 06-6837-2002 / ASTM D2170 | 135 °C | 300 [cSt] (300 mm2/s) |
| Mixing temperature | Laboratory procedure | Recorded operating temperature | 160 [°C] |
| Compaction temperature | Laboratory procedure | Recorded operating range | 140–150 [°C] |
| Binder specific gravity | SNI 2441:2011 / ASTM D70 | 25 °C | 1.030 [g/cm3] (1.03 kg/L) |
Table 3:
Aggregate proportions during the replacement stage
| Fine-fraction replacement [%] | 19-mm aggregate [%] | 12-mm aggregate [%] | Stone dust [%] | River sand [% of total aggregate] | River sand [%] of fine fraction |
|---|---|---|---|---|---|
| 0 | 13.00 | 26.00 | 61.00 | 0.00 | 0 |
| 5 | 13.00 | 26.00 | 57.95 | 3.05 | 5 |
| 10 | 13.00 | 26.00 | 54.90 | 6.10 | 10 |
| 15 | 13.00 | 26.00 | 51.85 | 9.15 | 15 |
| 20 | 13.00 | 26.00 | 48.80 | 12.20 | 20 |
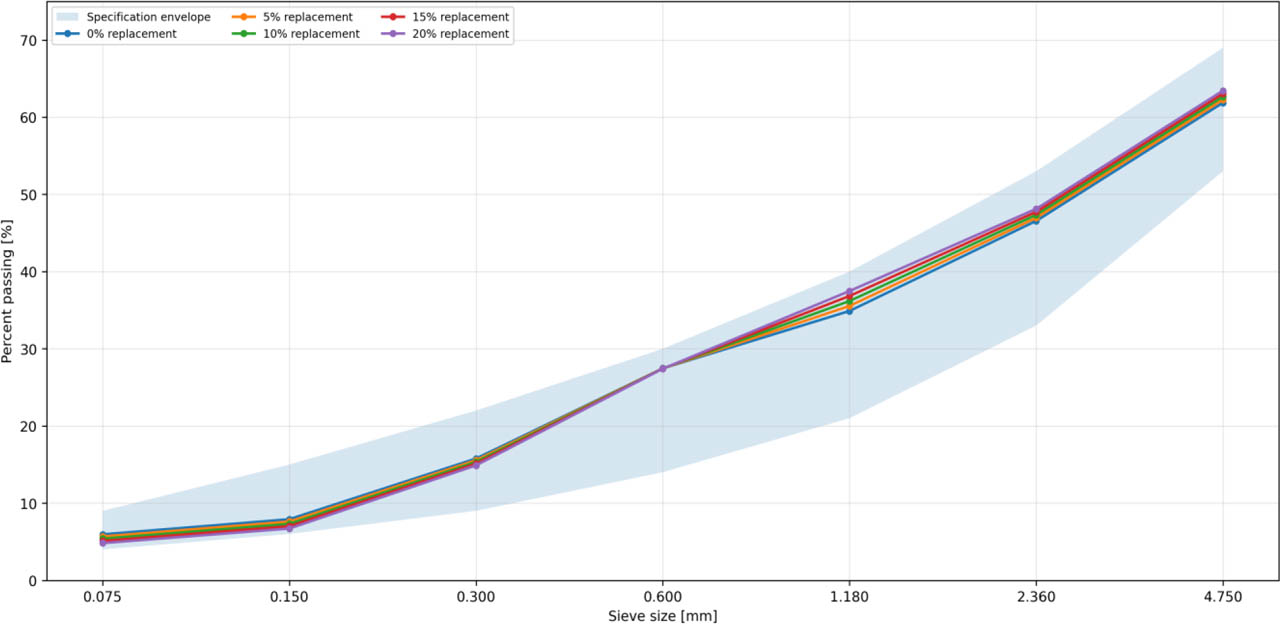
Figure 1:
Recalculated combined gradations at the five river-sand replacement levels
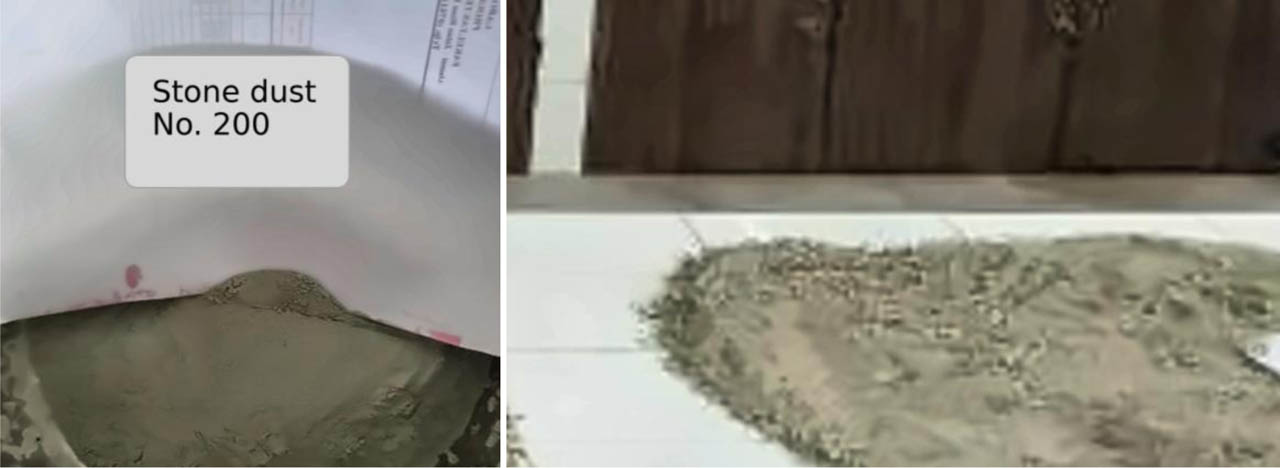
Figure 2:
Fine materials used in the study: (a) stone dust and (b) Kampar River sand
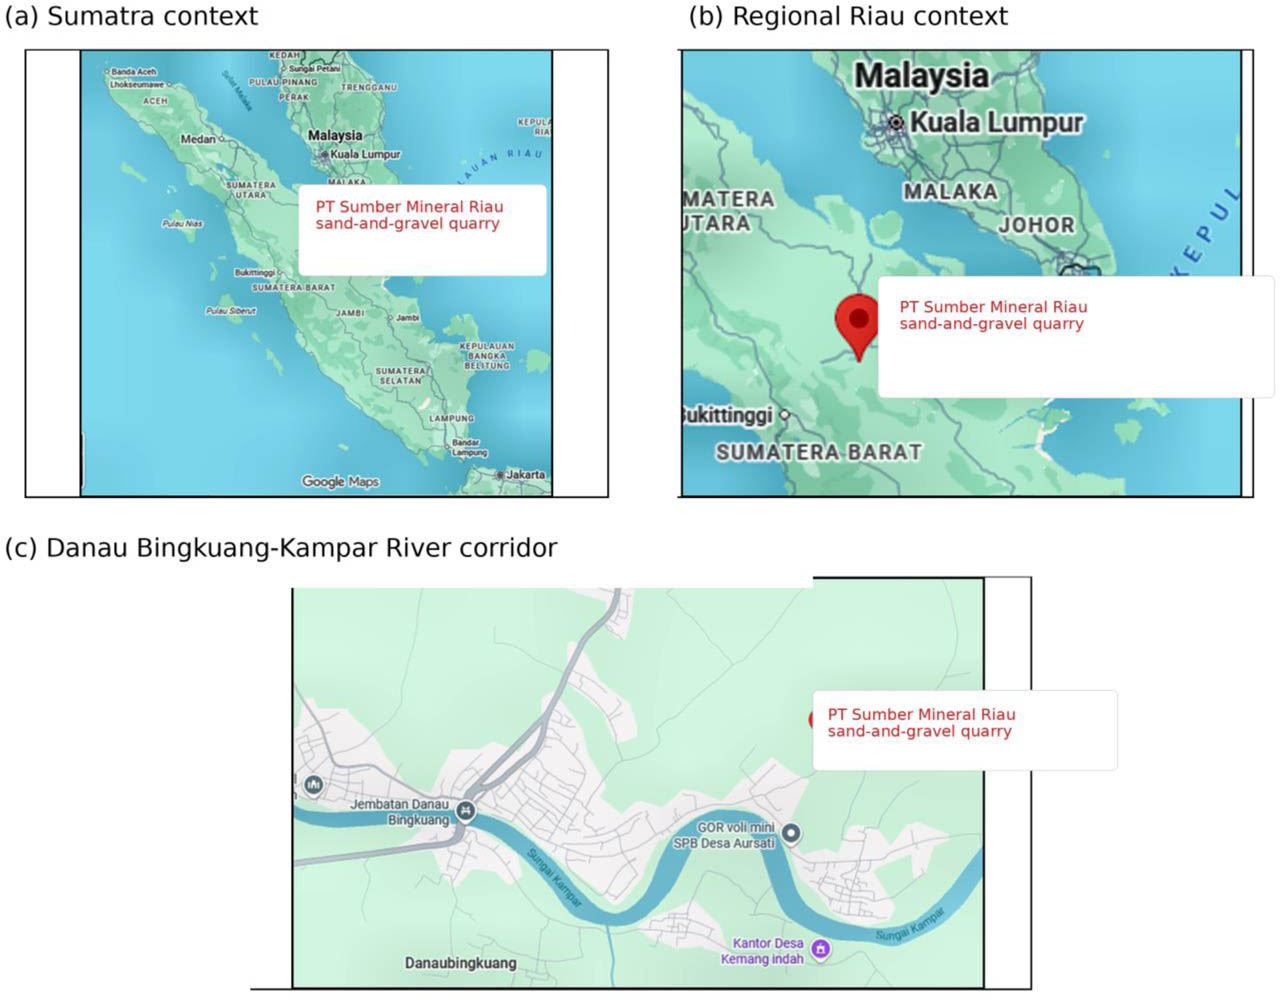
Figure 3:
Source location of Kampar River sand: (a) Sumatra context, (b) regional Riau context, and (c) the Danau Bingkuang Kampar River corridor. Base map: Google Maps; location information provided by PT Sumber Mineral Riau; adapted by the authors
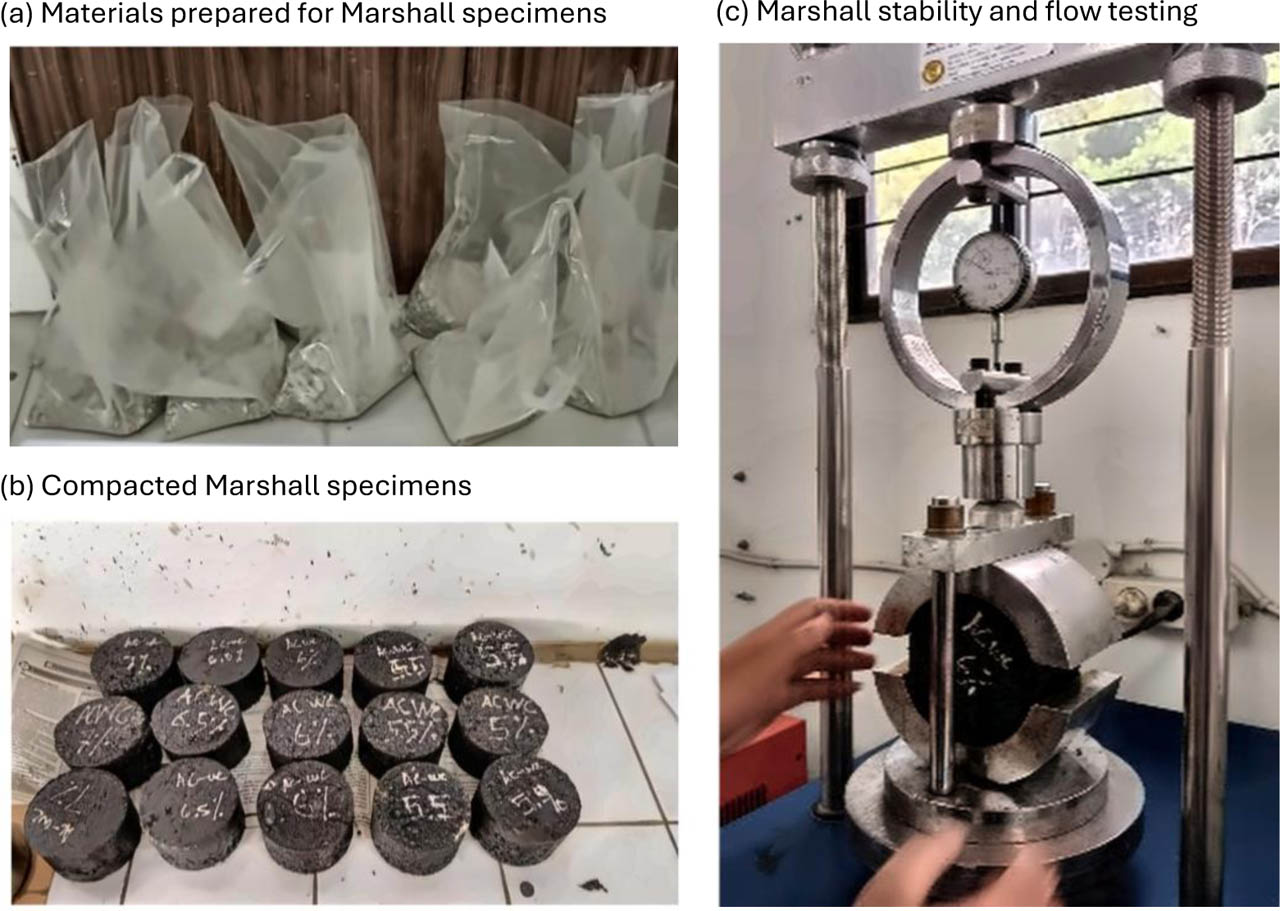
Figure 4:
Documentation of materials, compacted specimens, and Marshall testing: (a) aggregate weighed and packaged by batch, (b) compacted Marshall specimens, and (c) loading apparatus
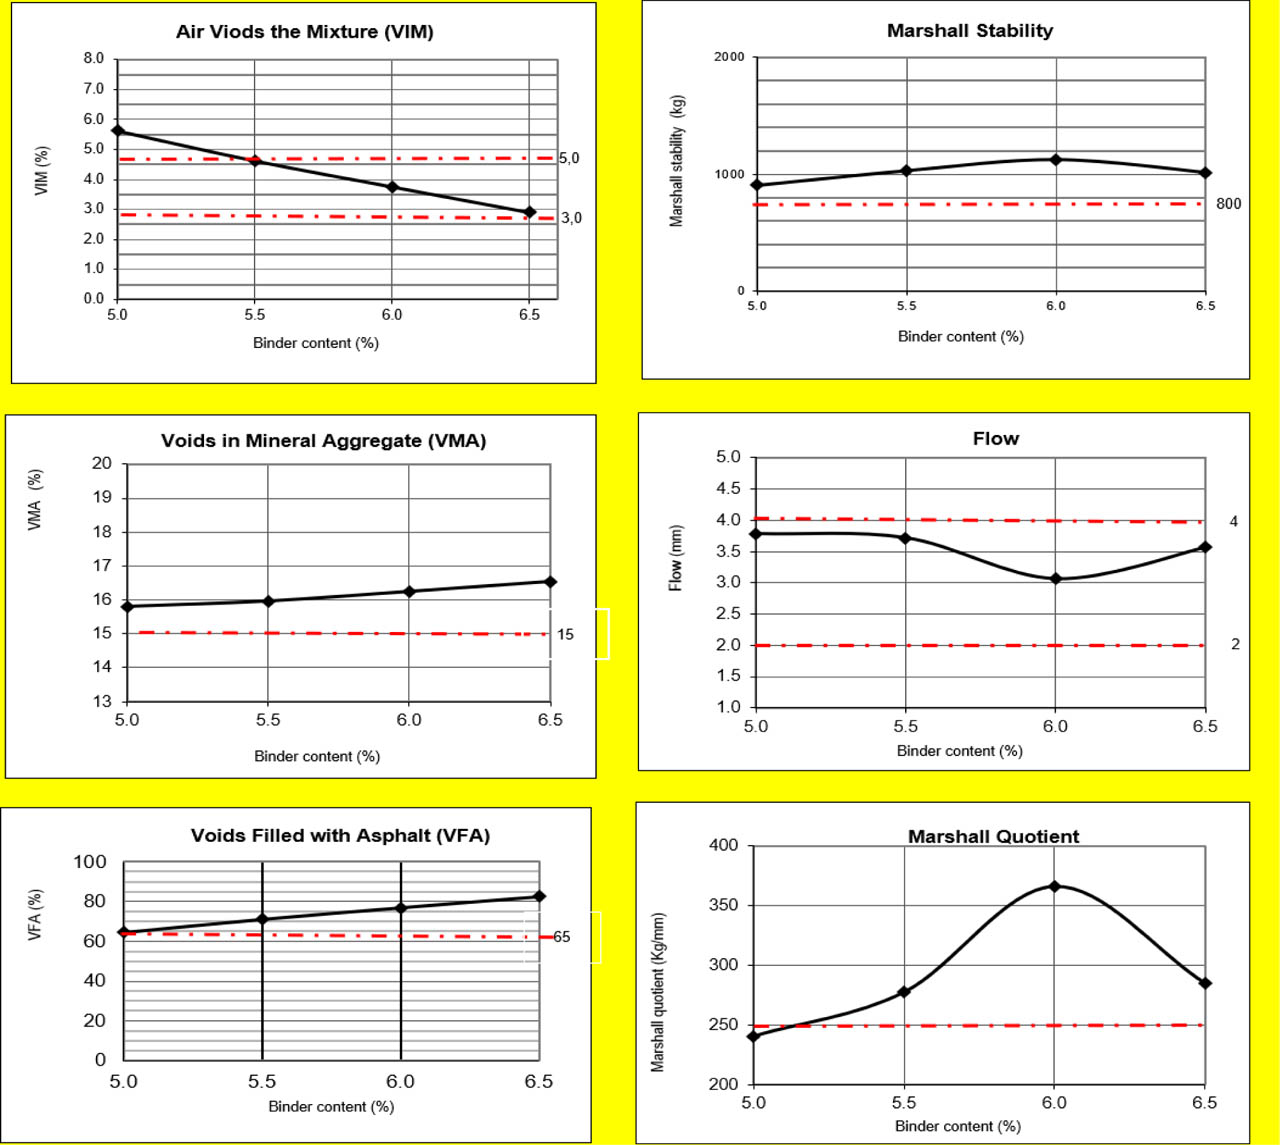
Figure 5:
Marshall indicator curves used to determine the optimum binder content (binder content 5.0–6.5%)
Table 4:
Recalculated combined gradations and the adopted AC-WC specification envelope
| Sieve size [mm] | Passing, 0% [%] | Passing, 5% [%] | Passing, 10% [%] | Passing, 15% [%] | Passing, 20% [%] | Lower limit [%] | Upper limit [%] |
|---|---|---|---|---|---|---|---|
| 4.750 | 61.87 | 62.26 | 62.65 | 63.04 | 63.43 | 53 | 69 |
| 2.360 | 46.56 | 46.95 | 47.34 | 47.73 | 48.12 | 33 | 53 |
| 1.180 | 34.89 | 35.54 | 36.18 | 36.83 | 37.47 | 21 | 40 |
| 0.600 | 27.46 | 27.45 | 27.44 | 27.43 | 27.41 | 14 | 30 |
| 0.300 | 15.77 | 15.55 | 15.33 | 15.11 | 14.89 | 9 | 22 |
| 0.150 | 7.91 | 7.61 | 7.31 | 7.01 | 6.71 | 6 | 15 |
| 0.075 | 5.95 | 5.67 | 5.39 | 5.10 | 4.82 | 4 | 9 |
Table 5:
Specimen-level data from separate batches at binder contents of 5.9 and 6.0%
| Binder content [%] | Specimen | Gmb | Gmm | VIM [%] | VMA [%] | VFA [%] | Stability [kg] / Flow [mm] / MQ [kg/mm] |
|---|---|---|---|---|---|---|---|
| 5.9 | 1 | 2.299 | 2.401 | 4.26 | 16.45 | 74.13 | 1351.3 / 3.15 / 428.98 |
| 5.9 | 2 | 2.297 | 2.401 | 4.32 | 16.51 | 73.80 | 1322.2 / 3.11 / 425.15 |
| 5.9 | 3 | 2.297 | 2.401 | 4.34 | 16.52 | 73.75 | 1394.9 / 3.21 / 434.54 |
| 5.9 | Mean | 2.298 | 2.401 | 4.31 | 16.49 | 73.89 | 1356.1 / 3.16 / 429.61 |
| 6.0 | 1 | 2.306 | 2.397 | 3.79 | 16.27 | 76.69 | 1060.7 / 3.10 / 342.16 |
| 6.0 | 2 | 2.307 | 2.397 | 3.77 | 16.25 | 76.81 | 1176.9 / 3.05 / 385.88 |
| 6.0 | 3 | 2.308 | 2.397 | 3.73 | 16.22 | 77.00 | 1133.3 / 3.05 / 371.59 |
| 6.0 | Mean | 2.307 | 2.397 | 3.76 | 16.25 | 76.83 | 1123.7 / 3.07 / 366.41 |
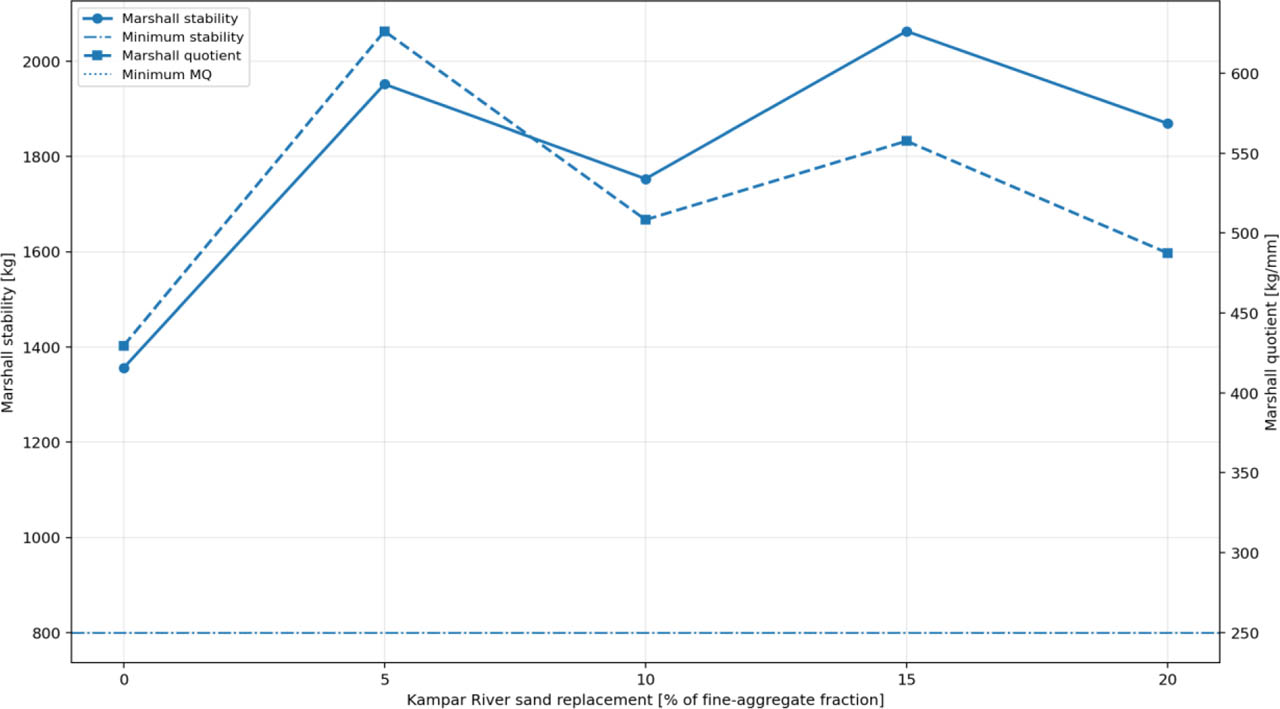
Figure 6:
Effect of river-sand replacement on mean Marshall stability and Marshall quotient
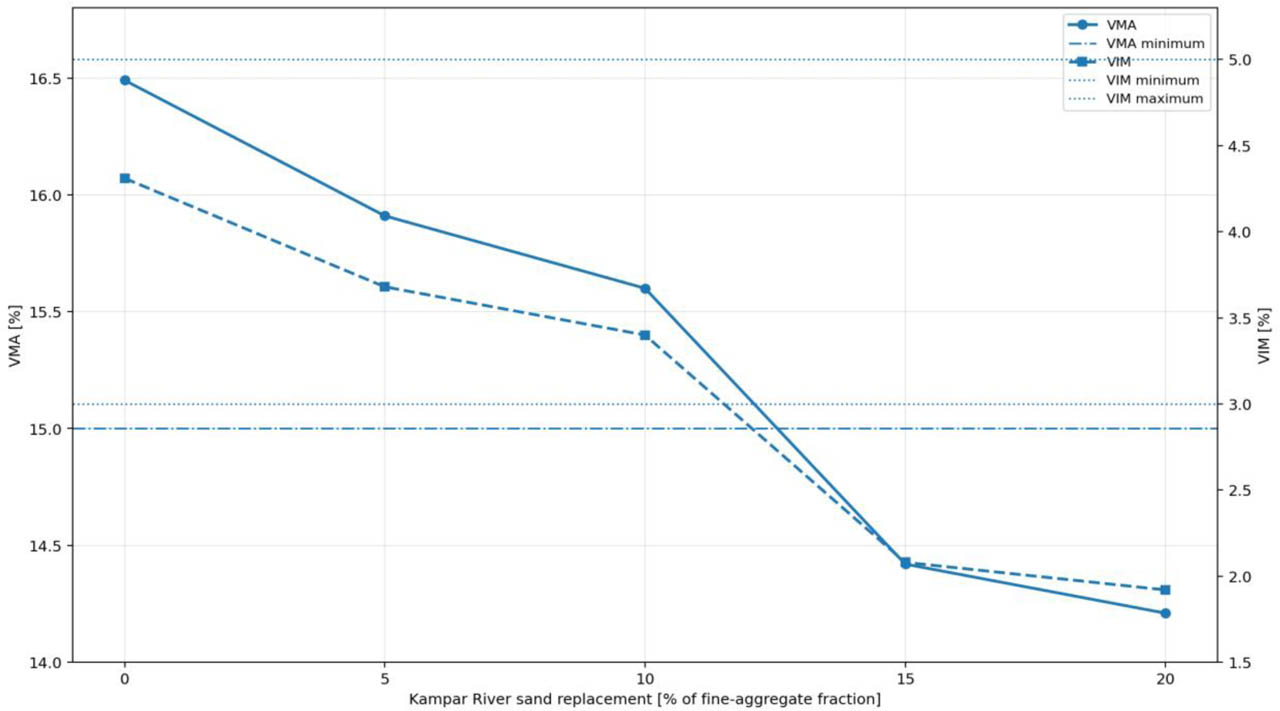
Figure 7:
Mean VMA and VIM responses relative to the adopted specification limits
Table 6:
Marshall results at 5.9% binder content, reported as the mean ± standard deviation of three specimens
| Replacement [% of fine fraction] | Gmm* | Gsb | Gmb | Stability [kg] | Flow [mm] | MQ [kg/mm] | VMA [%] | VFA [%] | VIM [%] | Pbe [%] ** |
|---|---|---|---|---|---|---|---|---|---|---|
| 0 | 2.401 | 2.589 | 2.298 ± 0.001 | 1356.13 ± 36.59 | 3.16 ± 0.05 | 429.56 ± 4.72 | 16.49 ± 0.04 | 73.89 ± 0.21 | 4.31 ± 0.04 | 5.462 |
| 5 | 2.401 | 2.588 | 2.313 ± 0.002 | 1951.87 ± 58.71 | 3.12 ± 0.02 | 626.30 ± 20.38 | 15.91 ± 0.07 | 76.88 ± 0.42 | 3.68 ± 0.08 | 5.448 |
| 10 | 2.401 | 2.586 | 2.319 ± 0.009 | 1753.30 ± 160.07 | 3.45 ± 0.04 | 508.31 ± 47.59 | 15.60 ± 0.32 | 78.24 ± 1.87 | 3.40 ± 0.36 | 5.419 |
| 15 | 2.401 | 2.585 | 2.351 ± 0.001 | 2063.27 ± 38.48 | 3.70 ± 0.01 | 557.62 ± 8.97 | 14.42 ± 0.03 | 85.55 ± 0.20 | 2.08 ± 0.03 | 5.404 |
| 20 | 2.401 | 2.583 | 2.355 ± 0.001 | 1869.53 ± 183.95 | 3.84 ± 0.03 | 487.49 ± 51.01 | 14.21 ± 0.04 | 86.50 ± 0.27 | 1.92 ± 0.04 | 5.375 |
| Specification | - | - | - | ≥ 800 | 2–4 | ≥ 250 | ≥ 15 | ≥ 65 | 3–5 | - |
Table 7:
Specimen-level Gmb and Gmm data for the replacement stage at 5.9% binder content
| Replacement [% fine fraction] | Specimen | Gsb | Gmb | Gmm | VIM [%] | VMA [%] | VFA [%] |
|---|---|---|---|---|---|---|---|
| 0 | 1 | 2.589 | 2.299 | 2.401 | 4.25 | 16.46 | 74.21 |
| 0 | 2 | 2.589 | 2.297 | 2.401 | 4.31 | 16.52 | 73.89 |
| 0 | 3 | 2.589 | 2.297 | 2.401 | 4.33 | 16.53 | 73.83 |
| 5 | 1 | 2.588 | 2.312 | 2.401 | 3.70 | 15.99 | 76.81 |
| 5 | 2 | 2.588 | 2.315 | 2.401 | 3.58 | 15.88 | 77.59 |
| 5 | 3 | 2.588 | 2.311 | 2.401 | 3.74 | 16.02 | 76.59 |
| 10 | 1 | 2.586 | 2.309 | 2.401 | 3.81 | 16.08 | 76.32 |
| 10 | 2 | 2.586 | 2.325 | 2.401 | 3.16 | 15.51 | 79.63 |
| 10 | 3 | 2.586 | 2.324 | 2.401 | 3.20 | 15.55 | 79.44 |
| 15 | 1 | 2.585 | 2.350 | 2.401 | 2.11 | 14.59 | 85.57 |
| 15 | 2 | 2.585 | 2.351 | 2.401 | 2.07 | 14.57 | 85.77 |
| 15 | 3 | 2.585 | 2.352 | 2.401 | 2.04 | 14.54 | 85.97 |
| 20 | 1 | 2.583 | 2.354 | 2.401 | 1.95 | 14.46 | 86.50 |
| 20 | 2 | 2.583 | 2.356 | 2.401 | 1.87 | 14.39 | 87.03 |
| 20 | 3 | 2.583 | 2.355 | 2.401 | 1.90 | 14.42 | 86.79 |
* Note. VIM, VMA, and VFA were recalculated using the composition-specific Gsb values, specimen-level Gmb values, and the Gmm value reported in the laboratory appendix. Because composition-specific Gmm values were not available, the table supports transparency of the current calculation basis but does not replace the need for future Gmm verification.
Table 8:
Compact pass/fail summary for the adopted Marshall and volumetric criteria
| Replacement [% fine fraction] | Stability ≥ 800 kg | Flow 2–4 mm | MQ ≥ 250 kg/mm | VMA ≥ 15% | VFA ≥ 65% | VIM 3–5% | Overall |
|---|---|---|---|---|---|---|---|
| 0 | Pass | Pass | Pass | Pass | Pass | Pass | Pass |
| 5 | Pass | Pass | Pass | Pass | Pass | Pass | Pass |
| 10 | Pass | Pass | Pass | Pass | Pass | Pass | Pass |
| 15 | Pass | Pass | Pass | Fail | Pass | Fail | Fail |
| 20 | Pass | Pass | Pass | Fail | Pass | Fail | Fail |
* Note. Pass/fail status was assigned from the mean values in Table 6 and the adopted limits used in this study. The 15 and 20% mixtures failed overall because their VMA and VIM values were below the specified limits, even though their mechanical indicators satisfied the adopted thresholds.
Table 9:
Table caption, the numbering is automatic, use “Update Field”
| Response | df1 | df2 | F | p | Eta-squared |
|---|---|---|---|---|---|
| Gmb [-] | 4 | 10 | 111.949 | < 0.001 | 0.978 |
| Stability [kg] | 4 | 10 | 16.911 | < 0.001 | 0.871 |
| Flow [mm] | 4 | 10 | 319.646 | < 0.001 | 0.992 |
| MQ [kg/mm] | 4 | 10 | 15.372 | < 0.001 | 0.860 |
| VMA [%] | 4 | 10 | 131.026 | < 0.001 | 0.981 |
| VFA [%] | 4 | 10 | 120.855 | < 0.001 | 0.980 |
| VIM | 4 | 10 | 111.949 | < 0.001 | 0.978 |
* Note. Eta-squared represents the proportion of total variation associated with replacement level. The ANOVA for Gmb, VMA, VFA, and VIM was recalculated from specimen-level mass data using the composition-specific Gsb values. The large effect sizes should not be interpreted as overcoming the limitations of the small number of replicates or the need to verify Gmm for each composition.