

1. Introduction
Asphalt concrete-wearing course (AC-WC) is a dense-graded surface layer that is continuously subjected to traffic loads and environmental exposure. Its performance reflects the combined effects of the asphalt binder, coarse and fine aggregates, mineral filler, and the internal void structure. A mixture may provide high load resistance but still be unsuitable when its air voids or voids in mineral aggregate fall outside the specified range. Mechanical and volumetric properties should therefore be considered together rather than assessed separately (Asphalt Institute, 2014; Directorate General of Highways, 2018; Huang, 2004; Mallick & El-Korchi, 2017).
Fine aggregate has an important role in particle arrangement, total surface area, binder demand, and continuity of the aggregate skeleton. Its gradation and morphology affect stability, compactability, voids in mineral aggregate (VMA), and air voids in the compacted mixture (VIM) (Abdullah et al., 1998; Pan et al., 2006; Pouranian & Haddock, 2018; Vavrik et al., 2001). Fine particles that rearrange easily may increase mixture density and apparent stability. If the structure becomes too dense, however, the available space for an adequate binder film and for further densification under traffic may be reduced. This balance is particularly important when natural river sand is used because its particles are generally more rounded and its gradation varies with the source.
Natural river sand is readily available in Riau Province, Indonesia. Sand from the Kampar River near Danau Bingkuang is a potential local substitute for part of the crushed fine aggregate used in AC-WC mixtures. Its use in practice remains limited because natural sand can change the aggregate skeleton and the volumetric balance of a dense-graded mixture. The Indonesian General Specifications for Road and Bridge Construction allow natural sand in asphalt concrete but restrict its proportion to no more than 15% of the total aggregate mass (Directorate General of Highways, 2018). Availability alone is therefore not a sufficient basis for use; the effect of the material on the complete mixture must also be established.
Previous studies have consistently shown that gradation, particle shape, and aggregate packing influence VMA and the mechanical behavior of asphalt mixtures (Abdullah et al., 1998; Kandhal et al., 1998; Pan et al., 2006; Pouranian & Haddock, 2018; Vavrik et al., 2001). More recent work has also reported that the type of fine aggregate and mineral filler can affect Marshall stability, permanent deformation, stiffness, and volumetric balance (Kamran et al., 2023; Khan et al., 2023a, 2023b). Basri et al. (2022), for example, found that sawdust ash and Portland cement could be used as fillers while maintaining the required Marshall properties, whereas Fayissa et al. (2020) examined sawdust ash as a filler in asphalt concrete. These studies did not investigate Kampar River sand as a replacement for stone dust, nor did they directly examine the trade-off between higher stability and lower VMA and VIM. Because gradation, absorption, angularity, and surface texture are specific to the material source, results obtained with other aggregates cannot be applied without verification. A mixture selected only for its maximum stability may be excessively dense and may not provide enough space for an effective binder film or for subsequent densification under traffic.
Existing research indicates that natural sand can be incorporated into asphalt mixtures at limited proportions and that aggregate packing strongly affects both VMA and mechanical response. What remains unclear is how Kampar River sand, with a water absorption of 2.040% compared with 0.040% for stone dust, affects the balance among VMA, VIM, VFA, and effective binder content in AC-WC mixtures. Establishing an appropriate replacement limit is practically important for road construction in Riau and other parts of Indonesia because it could support the use of material from Danau Bingkuang while reducing dependence on crushed stone dust. This study therefore examined replacement levels of 0, 5, 10, 15, and 20% of the fine-aggregate fraction. Marshall stability, flow, Marshall quotient (MQ), VMA, voids filled with asphalt (VFA), and VIM were measured to determine which replacement levels met the adopted specifications. It was hypothesized that a limited amount of river sand would improve particle packing and Marshall response, whereas excessive replacement would reduce VMA and VIM below the specified limits.
2. Methodology
2.1. Research Design
A controlled laboratory program was carried out in two stages. In the first stage, Marshall design curves were developed at binder contents of 5.0, 5.5, 6.0, and 6.5% to determine the optimum binder content (OBC) of the control mixture. The mean VIM values at 5.5 and 6.0% binder were 4.63 and 3.76%, respectively. Interpolation at a target VIM of 4.0% gave a binder content of 5.86%. This value was rounded to 5.9% and verified using three newly prepared specimens. In the second stage, Kampar River sand replaced 0–20% of the fine-aggregate fraction at the selected OBC. Replacement level was treated as the independent variable, while Gmb, stability, flow, MQ, VMA, VFA, and VIM were evaluated as response variables. Each specimen was prepared from a separate batch of approximately 1200 g. The aggregate and binder were weighed, heated, mixed, and compacted independently for each specimen rather than being divided from one large batch. In total, 27 Marshall specimens were prepared: 12 for the initial binder-content evaluation (4 levels x 3 replicates) and 15 for the replacement stage (5 levels x 3 replicates). All specimens received 75 blows on each face.
2.2. Materials and Aggregate Characterization
The experimental work was conducted at the Highway Engineering Laboratory, Department of Civil Engineering, Faculty of Engineering, Universitas Abdurrab, Pekanbaru, Indonesia. A 60/70 penetration-grade asphalt binder was used throughout the study. Penetration, softening point, and ductility were determined in accordance with SNI 2456:2011, SNI 2434:2011, and SNI 2432:2011, respectively (Standardization Agency of Indonesia, 2011a, 2011b, 2011c). The binder properties and processing temperatures are summarized in Table 2. The binder had a penetration of 61.4 [0.1 mm] at 25 °C for 5 s, a mean softening point of 48.15 °C, and a ductility of 146.5 cm at 25 °C with a pulling rate of 5 cm/min. Kinematic viscosity was 300 cSt at 135 °C according to SNI 06-6837-2002/ASTM D2170, and the binder specific gravity was 1.030 g/cm3 at 25 °C according to SNI 2441:2011/ASTM D70. Mixing was performed at 160 °C, while compaction was carried out at 140–150 °C. Crushed aggregate and stone dust were sourced from Rokan Hulu, Riau, and the natural sand was collected from the Kampar River near Danau Bingkuang. The nominal coarse-aggregate fractions were 19 and 12 mm. Sieve analysis, Los Angeles abrasion, specific gravity, water absorption, and silt content were determined using the relevant Indonesian standards (Standardization Agency of Indonesia, 1990, 2008, 2012, 2016a, 2016b). The standards used for viscosity and binder specific gravity are listed as Standardization Agency of Indonesia (2002, 2011d).
Table 1:
Main properties of the constituent aggregate materials
| Material/property | Bulk specific gravity | SSD specific gravity | Apparent specific gravity | Absorption/result [%] |
|---|---|---|---|---|
| Crushed aggregate, 19 mm | 2.477 | 2.523 | 2.598 | 1.881 |
| Crushed aggregate, 12 mm | 2.554 | 2.571 | 2.598 | 0.659 |
| Stone dust | 2.631 | 2.632 | 2.633 | 0.040 |
| Kampar River sand | 2.580 | 2.630 | 2.720 | 2.040 |
| Los Angeles abrasion [%] | - | - | - | 27.18 |
Table 2:
Characteristics and processing temperatures of the 60/70 penetration-grade binder
| Property/process | Standard | Test condition | Result |
|---|---|---|---|
| Penetration | SNI 2456:2011 | 25 °C, 5 s | 61.4 [0.1 mm] (6.14 mm) |
| Softening point | SNI 2434:2011 | Initial water temperature 25 °C; two results | 48.15 [°C] (48.25; 48.05) |
| Ductility | SNI 2432:2011 | 25 °C; pulling rate 5 cm/min | 146.5 [cm] |
| Kinematic viscosity | SNI 06-6837-2002 / ASTM D2170 | 135 °C | 300 [cSt] (300 mm2/s) |
| Mixing temperature | Laboratory procedure | Recorded operating temperature | 160 [°C] |
| Compaction temperature | Laboratory procedure | Recorded operating range | 140–150 [°C] |
| Binder specific gravity | SNI 2441:2011 / ASTM D70 | 25 °C | 1.030 [g/cm3] (1.03 kg/L) |
The Kampar River sand had a fineness modulus of 2.90, a compacted bulk density of 1.50 g/cm3, and a loose bulk density of 1.41 g/cm3. Its organic-impurity color classification was No. 2; 0.45% passed the 0.075-mm sieve, and 94.57% passed the 4.8-mm sieve. The Los Angeles abrasion value of the crushed aggregate and the river-sand silt content of 2.32% complied with the adopted limits. Water absorption of the river sand was 2.040%, compared with 0.040% for stone dust. Maintaining the same total binder content across the mixtures could therefore alter the effective binder content and binder-film thickness. Fine aggregate angularity (FAA; AASHTO T 304/ASTM C1252), uncompacted void content, surface texture, and packing characteristics were not measured. As a result, the influence of particle morphology could not be separated fully from the effects of gradation and absorption.
2.3. Mixture Design and Specimen Preparation
The control aggregate blend contained 13% of the 19-mm fraction, 26% of the 12-mm fraction, and 61% of the stone dust. Kampar River sand replaced between 0 and 20% of the fine-aggregate fraction. Thus, a 5% replacement within the fine fraction was equivalent to 3.05% of the total aggregate mass. Both calculation bases are shown in Table 3. For each mixture, the combined percentage passing sieve j was recalculated from the contribution of each aggregate component using Equation (1):
Table 3:
Aggregate proportions during the replacement stage
| Fine-fraction replacement [%] | 19-mm aggregate [%] | 12-mm aggregate [%] | Stone dust [%] | River sand [% of total aggregate] | River sand [%] of fine fraction |
|---|---|---|---|---|---|
| 0 | 13.00 | 26.00 | 61.00 | 0.00 | 0 |
| 5 | 13.00 | 26.00 | 57.95 | 3.05 | 5 |
| 10 | 13.00 | 26.00 | 54.90 | 6.10 | 10 |
| 15 | 13.00 | 26.00 | 51.85 | 9.15 | 15 |
| 20 | 13.00 | 26.00 | 48.80 | 12.20 | 20 |
In Equation (1), Pblend,j denotes the combined percentage passing sieve j. P19,j, P12,j, Psd,j, and Ps,j are the corresponding percentages passing for the 19-mm aggregate, 12-mm aggregate, stone dust, and river sand, respectively, and r is the proportion of river-sand replacement within the fine-aggregate fraction.
The initial binder-content evaluation used 12 specimens, while the replacement stage used 15. Marshall specimens for the design stage were prepared at binder contents of 5.0, 5.5, 6.0, and 6.5%. The OBC was selected at a target VIM of 4.0%, within the specified range of 3–5%. Interpolation between the mean VIM values of 4.63% at 5.5% binder and 3.76% at 6.0% binder produced an OBC of 5.86%, which was rounded to 5.9%. A separate verification series at 5.9% gave a mean VIM of 4.30%, and all Marshall parameters met the adopted limits. For the replacement stage, three independent batches of approximately 1200 g were prepared at each river-sand level of 0, 5, 10, 15, and 20% of the fine-aggregate fraction. Aggregates and binder were mixed at 160 °C and compacted at 140–150 °C using 75 blows per face. The specimens were then conditioned in water at 60 ± 1 °C for 30–40 min and tested at a loading rate of approximately 50 mm/min.
2.4. Volumetric Calculations and Data Analysis
Marshall stability and flow were determined in accordance with ASTM D6927/D6927M-15. The bulk specific gravity of each compacted specimen was measured according to AASHTO T 166 and calculated as Gmb = A/(B-C), where A is the dry mass in air, B is the saturated-surface-dry mass in air, and C is the submerged mass in water. The theoretical maximum specific gravity, Gmm, was determined according to AASHTO T 209. Air voids in the compacted mixture, recorded as Pa in the laboratory worksheets and reported as VIM in this article, were calculated using VIM = 100(1-Gmb/Gmm).
The bulk specific gravity of the combined aggregate was calculated as Gsb = 100/Σ(Pi/Gi), and the effective aggregate specific gravity was obtained from Gse = Ps/[(100/Gmm)-(Pb/Gb)]. Binder absorption, expressed as a percentage of aggregate mass, was calculated as Pba = 100Gb(Gse-Gsb)/(Gse x Gsb). Effective binder content, expressed as a percentage of total mixture mass, was calculated as Pbe = Pb-(Pba x Ps/100). The void parameters were then obtained from VMA = 100-(Gmb x Ps/Gsb) and VFA = 100(VMA-VIM)/VMA. Here, Pb and Ps denote the binder and aggregate contents as percentages of the total mixture mass.
Using Gb = 1.030, Pb = 5.9%, Ps = 94.1%, and Gmm = 2.401, the recalculation produced Gse = 2.6196. The updated specific-gravity appendix reported composition-specific Gsb values of 2.589, 2.588, 2.586, 2.585, and 2.583 for replacement levels of 0, 5, 10, 15, and 20%, respectively. Based on these values, Pba increased from 0.465 to 0.558% of aggregate mass, whereas Pbe declined from 5.462 to 5.375% of total mixture mass. VIM, VMA, and VFA were recalculated from specimen-level Gmb, the Gsb value for each composition, and the Gmm value of 2.401 reported in the appendix. The component specific gravities recorded in the Marshall worksheets were not identical to the aggregate-characterization values in Table 1, and the same Gmm was reported for every composition. This discrepancy most likely reflects a combination of rounding during worksheet transcription, tests conducted on different dates, or the use of different aggregate or specimen lots; however, the available laboratory records do not allow these sources to be separated with certainty. Although the revised volumetric calculations can be traced mathematically, Gmm should be measured separately for each composition before the results are adopted as the basis for a final mixture design.
Specimen-level observations were available for every replacement level. Results are presented as the mean ± standard deviation of three independent batches and were compared with the adopted limits for stability, flow, MQ, VMA, VFA, and VIM. The influence of replacement level was explored by one-way ANOVA using five groups (k = 5), three replicates per group, a significance level of 0.05, df1 = 4, and df2 = 10. Given the small number of observations within each group, ANOVA was treated as supporting evidence that at least one group differed and was not used as the sole basis for selecting a replacement level. The engineering assessment continued to rely on the magnitude of each response, consistency among replicates, and compliance with the specified limits.
2.5. Materials and Specimen Documentation
Figures 2–4 document the fine materials, the sand source, the materials weighed and packaged for the OBC and river-sand batches, the compacted specimens, and the Marshall testing apparatus. The use of separate material packages for each specimen is consistent with the preparation of independent batches.
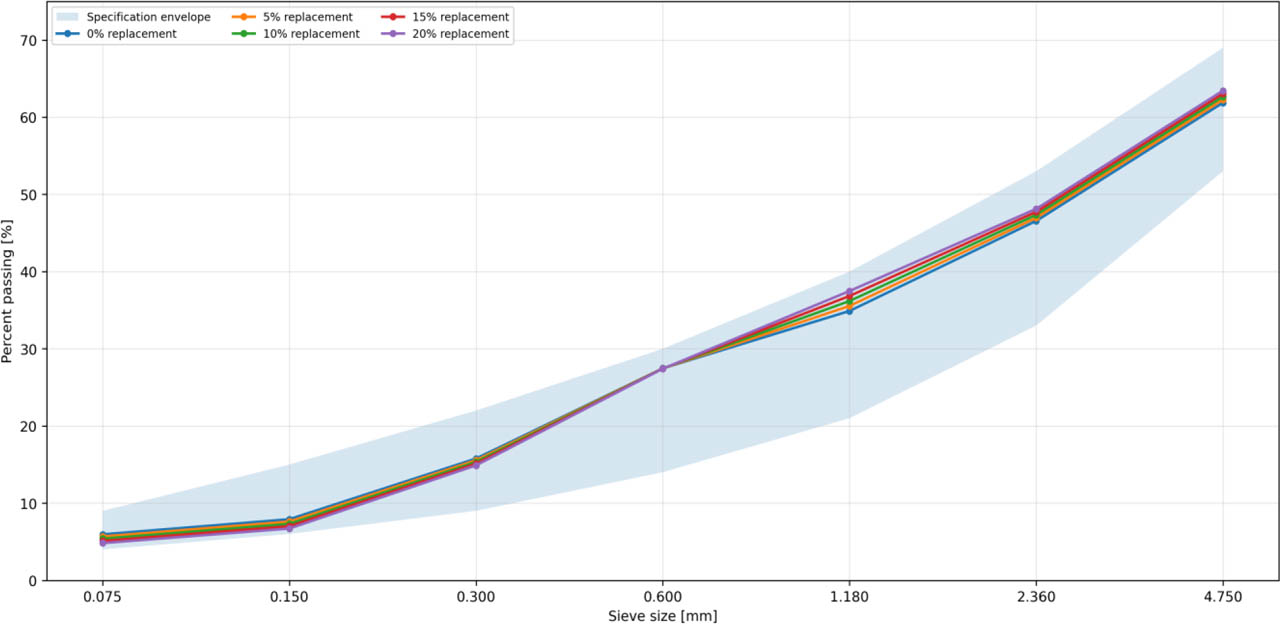
Figure 1:
Recalculated combined gradations at the five river-sand replacement levels
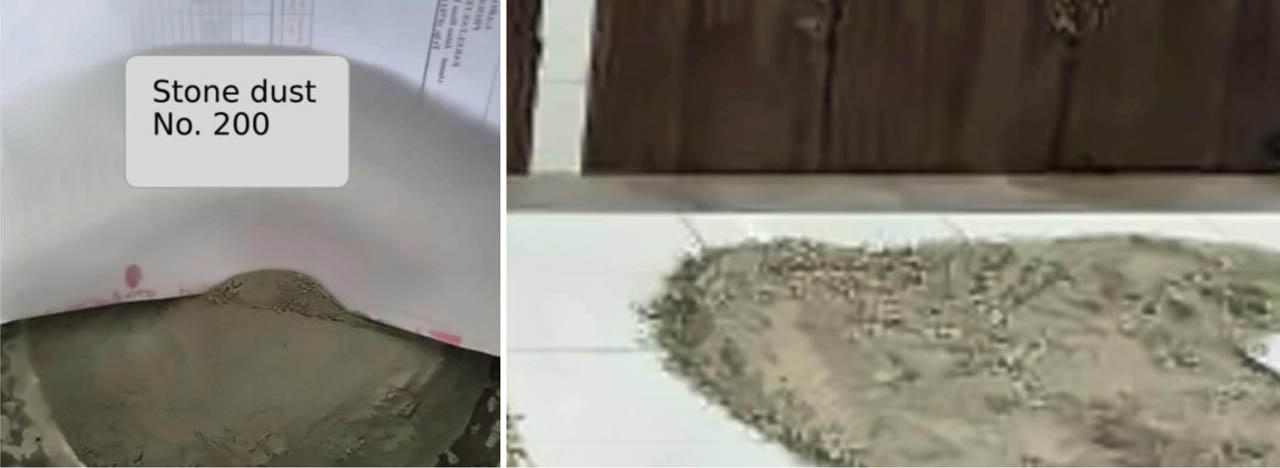
Figure 2:
Fine materials used in the study: (a) stone dust and (b) Kampar River sand
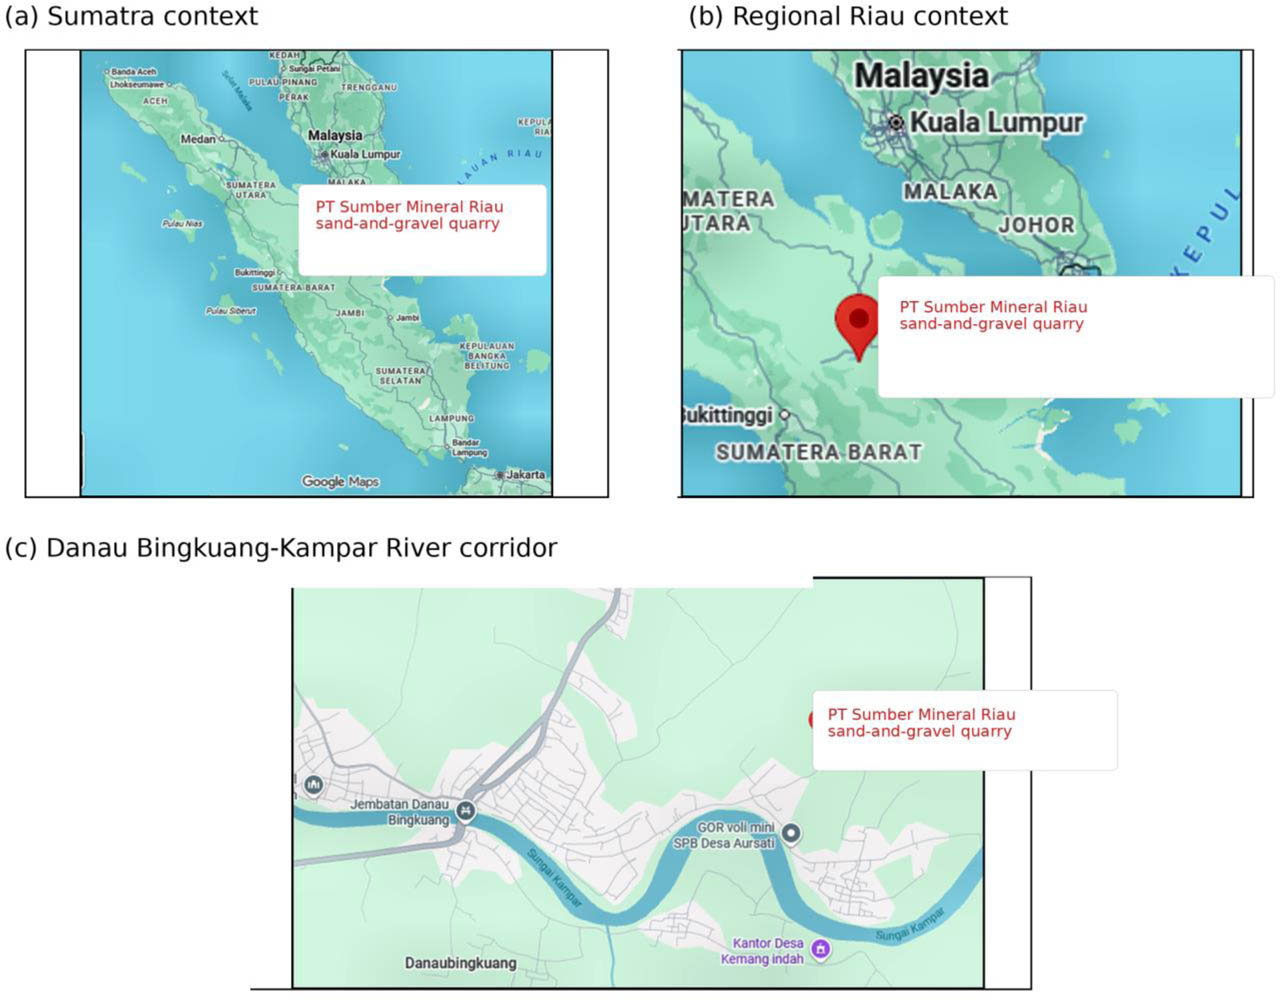
Figure 3:
Source location of Kampar River sand: (a) Sumatra context, (b) regional Riau context, and (c) the Danau Bingkuang Kampar River corridor. Base map: Google Maps; location information provided by PT Sumber Mineral Riau; adapted by the authors
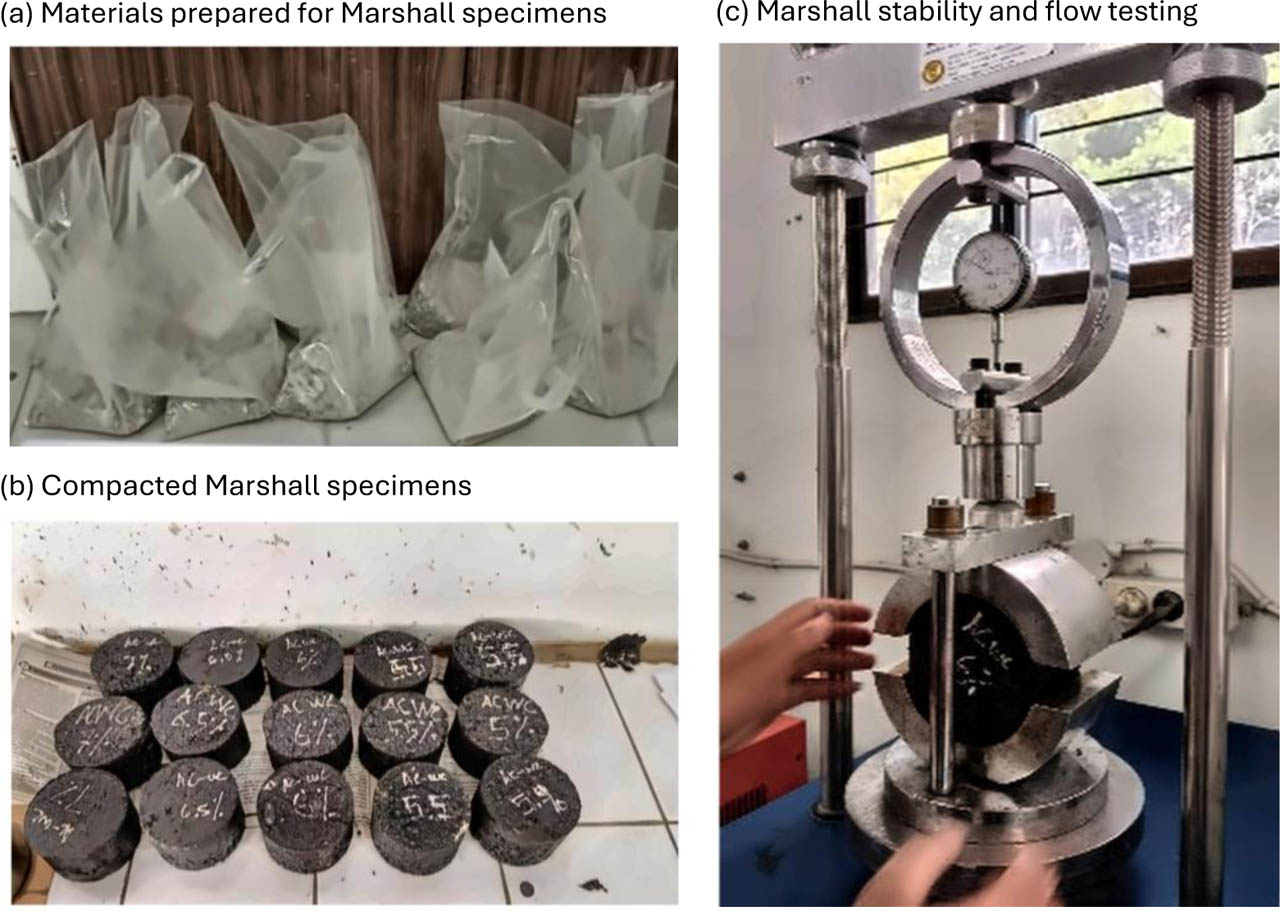
Figure 4:
Documentation of materials, compacted specimens, and Marshall testing: (a) aggregate weighed and packaged by batch, (b) compacted Marshall specimens, and (c) loading apparatus
3. Results
3.1. Binder Content Evaluation
Figure 5 presents the Marshall design curves used to determine the OBC. Across the binder-content range of 5.0–6.5%, the curves showed a reduction in VIM from 5.62 to 2.91% as binder content increased. The target VIM of 4.0% fell between the mean values measured at 5.5% binder (4.63%) and 6.0% binder (3.76%). Linear interpolation gave 5.86%, which was rounded to an OBC of 5.9%. At 6.0% binder, the mean stability, flow, MQ, VMA, VIM, and VFA were 1123.7 kg, 3.07 mm, 366.41 kg/mm, 16.25%, 3.76%, and 76.83%, respectively. The separate verification series at 5.9% produced stability of 1356.13 ± 36.59 kg, flow of 3.16 ± 0.05 mm, MQ of 429.56 ± 4.72 kg/mm, VMA of 16.49 ± 0.04%, VIM of 4.31 ± 0.04%, and VFA of 73.89 ± 0.21% after recalculation with the control Gsb of 2.589. The specimen-level values for the two experimental series are reported in Table 5. The values at 6.0 and 5.9% came from different experimental series: the 6.0% specimens belonged to the exploratory OBC stage, whereas the 5.9% control specimens were newly prepared and tested together with the replacement mixtures. Each mean was based on three independent batches. The difference in stability should therefore not be attributed to the 0.1% difference in binder content alone, as between-series and between-batch variability may also have contributed.
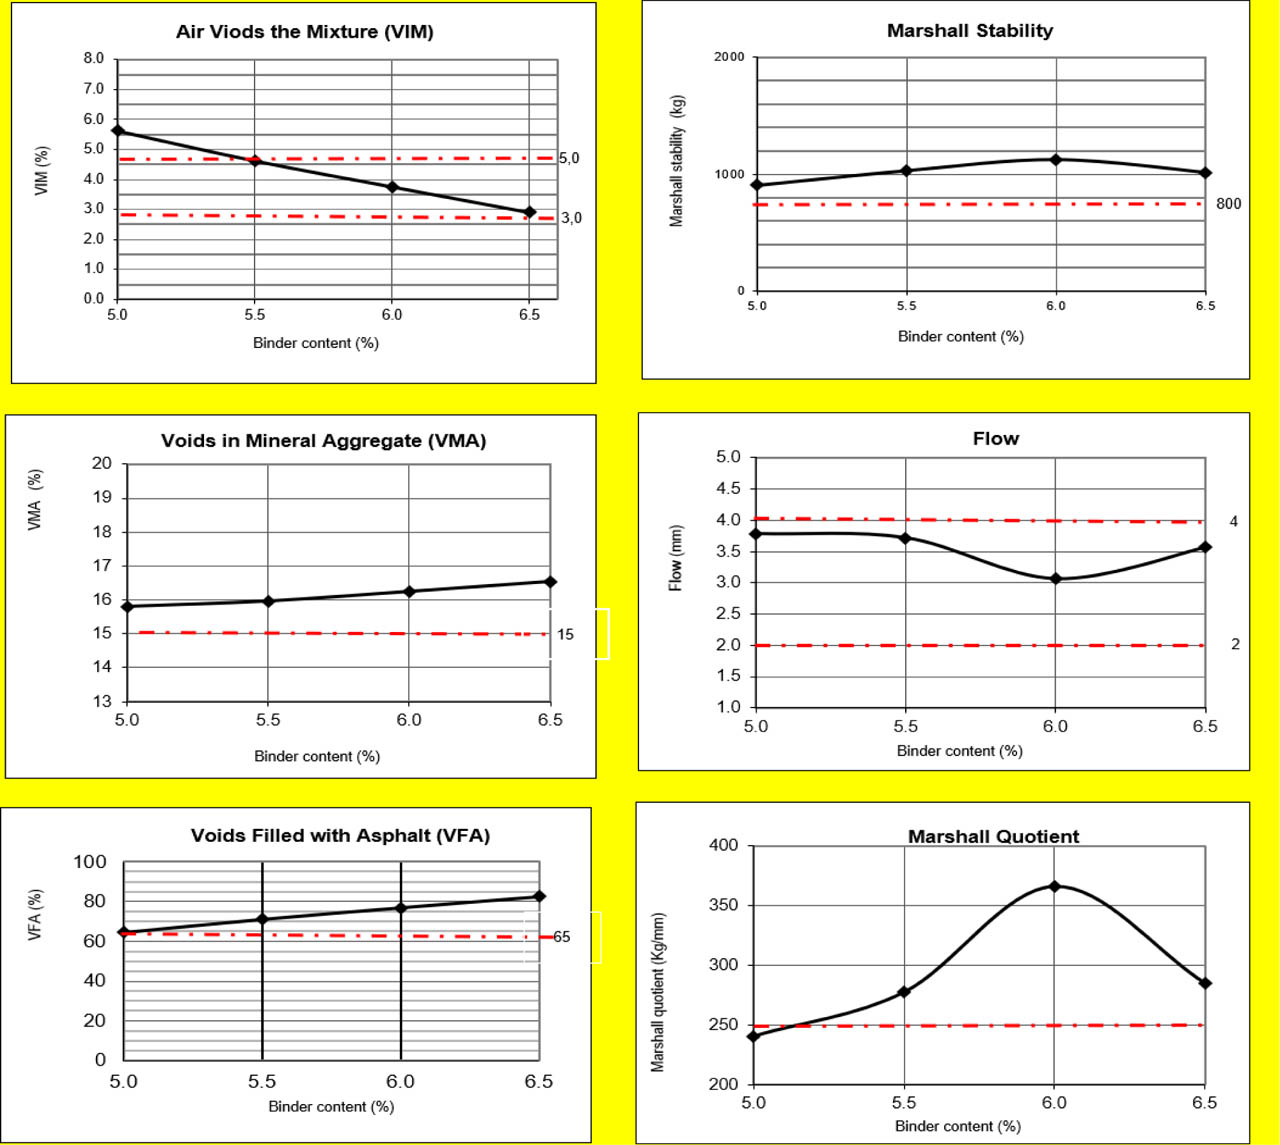
Figure 5:
Marshall indicator curves used to determine the optimum binder content (binder content 5.0–6.5%)
Table 4:
Recalculated combined gradations and the adopted AC-WC specification envelope
| Sieve size [mm] | Passing, 0% [%] | Passing, 5% [%] | Passing, 10% [%] | Passing, 15% [%] | Passing, 20% [%] | Lower limit [%] | Upper limit [%] |
|---|---|---|---|---|---|---|---|
| 4.750 | 61.87 | 62.26 | 62.65 | 63.04 | 63.43 | 53 | 69 |
| 2.360 | 46.56 | 46.95 | 47.34 | 47.73 | 48.12 | 33 | 53 |
| 1.180 | 34.89 | 35.54 | 36.18 | 36.83 | 37.47 | 21 | 40 |
| 0.600 | 27.46 | 27.45 | 27.44 | 27.43 | 27.41 | 14 | 30 |
| 0.300 | 15.77 | 15.55 | 15.33 | 15.11 | 14.89 | 9 | 22 |
| 0.150 | 7.91 | 7.61 | 7.31 | 7.01 | 6.71 | 6 | 15 |
| 0.075 | 5.95 | 5.67 | 5.39 | 5.10 | 4.82 | 4 | 9 |
Table 5:
Specimen-level data from separate batches at binder contents of 5.9 and 6.0%
| Binder content [%] | Specimen | Gmb | Gmm | VIM [%] | VMA [%] | VFA [%] | Stability [kg] / Flow [mm] / MQ [kg/mm] |
|---|---|---|---|---|---|---|---|
| 5.9 | 1 | 2.299 | 2.401 | 4.26 | 16.45 | 74.13 | 1351.3 / 3.15 / 428.98 |
| 5.9 | 2 | 2.297 | 2.401 | 4.32 | 16.51 | 73.80 | 1322.2 / 3.11 / 425.15 |
| 5.9 | 3 | 2.297 | 2.401 | 4.34 | 16.52 | 73.75 | 1394.9 / 3.21 / 434.54 |
| 5.9 | Mean | 2.298 | 2.401 | 4.31 | 16.49 | 73.89 | 1356.1 / 3.16 / 429.61 |
| 6.0 | 1 | 2.306 | 2.397 | 3.79 | 16.27 | 76.69 | 1060.7 / 3.10 / 342.16 |
| 6.0 | 2 | 2.307 | 2.397 | 3.77 | 16.25 | 76.81 | 1176.9 / 3.05 / 385.88 |
| 6.0 | 3 | 2.308 | 2.397 | 3.73 | 16.22 | 77.00 | 1133.3 / 3.05 / 371.59 |
| 6.0 | Mean | 2.307 | 2.397 | 3.76 | 16.25 | 76.83 | 1123.7 / 3.07 / 366.41 |
3.2. Mechanical Response to River-Sand Replacement
The mechanical responses are compared in Figure 6. The addition of Kampar River sand changed the mechanical response of the mixtures. Compared with the control, a 5% replacement of the fine-aggregate fraction increased stability from 1356.13 ± 36.59 to 1951.87 ± 58.71 kg, an increase of 43.9%, and raised MQ from 429.56 ± 4.72 to 626.30 ± 20.38 kg/mm, an increase of 45.8%. At 10% replacement, stability was 1753.30 ± 160.07 kg and MQ was 508.31 ± 47.59 kg/mm, with greater variability among replicates than at 5%. The highest stability, 2063.27 ± 38.48 kg, occurred at 15% replacement, before decreasing to 1869.53 ± 183.95 kg at 20%. Flow rose from 3.12 ± 0.02 mm at 5% replacement to 3.84 ± 0.03 mm at 20%, although all measured values remained within the adopted range of 2–4 mm.
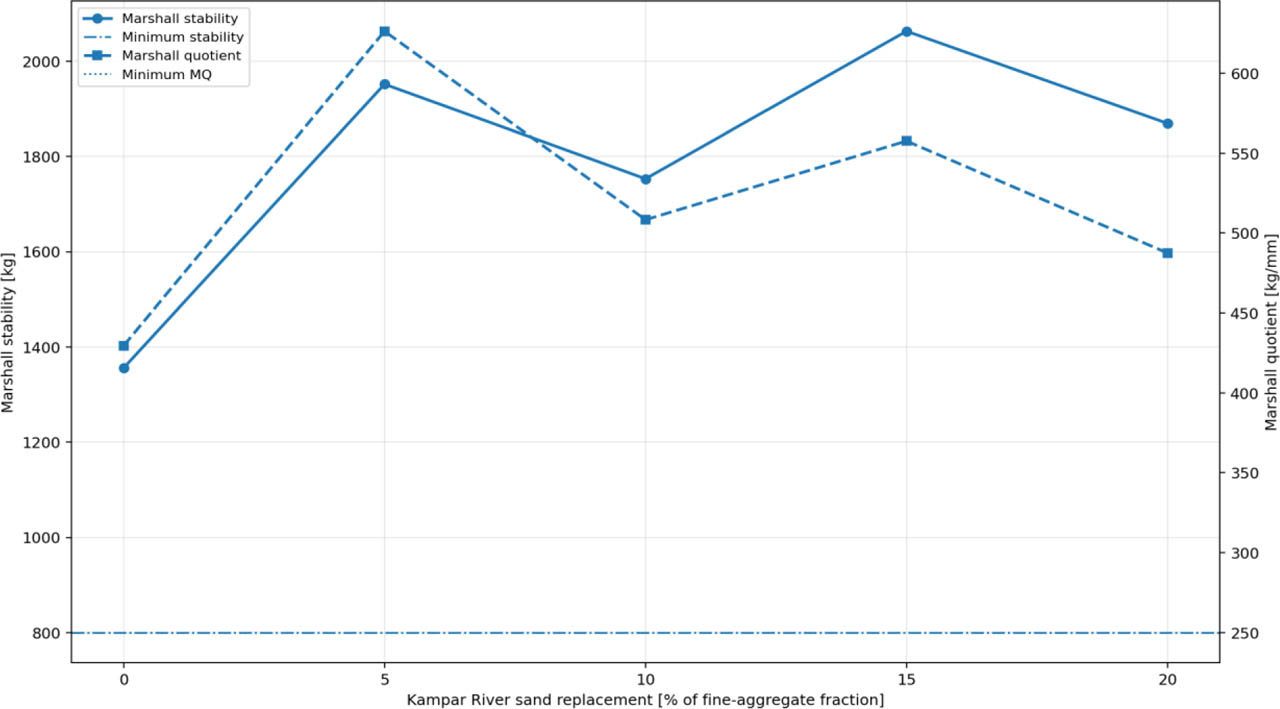
Figure 6:
Effect of river-sand replacement on mean Marshall stability and Marshall quotient
3.3. Volumetric Response and Specification Compliance
Figure 7 shows the volumetric responses relative to the adopted specification limits, while Table 6 summarizes the complete Marshall results. Using the composition-specific Gsb values, the recalculated mean VMA values at 0, 5, 10, 15, and 20% replacement were 16.49 ± 0.04, 15.91 ± 0.07, 15.60 ± 0.32, 14.42 ± 0.03, and 14.21 ± 0.04%, respectively. Mean VIM at the same replacement levels was 4.31 ± 0.04, 3.68 ± 0.08, 3.40 ± 0.36, 2.08 ± 0.03, and 1.92 ± 0.04%, while VFA was 73.89 ± 0.21, 76.88 ± 0.42, 78.24 ± 1.87, 85.55 ± 0.20, and 86.50 ± 0.27%. The control, 5%, and 10% mixtures met all six criteria considered in this study. Although the 15 and 20% mixtures met the requirements for stability, flow, MQ, and VFA, both fell below the minimum VMA of 15% and outside the specified VIM range of 3–5%.
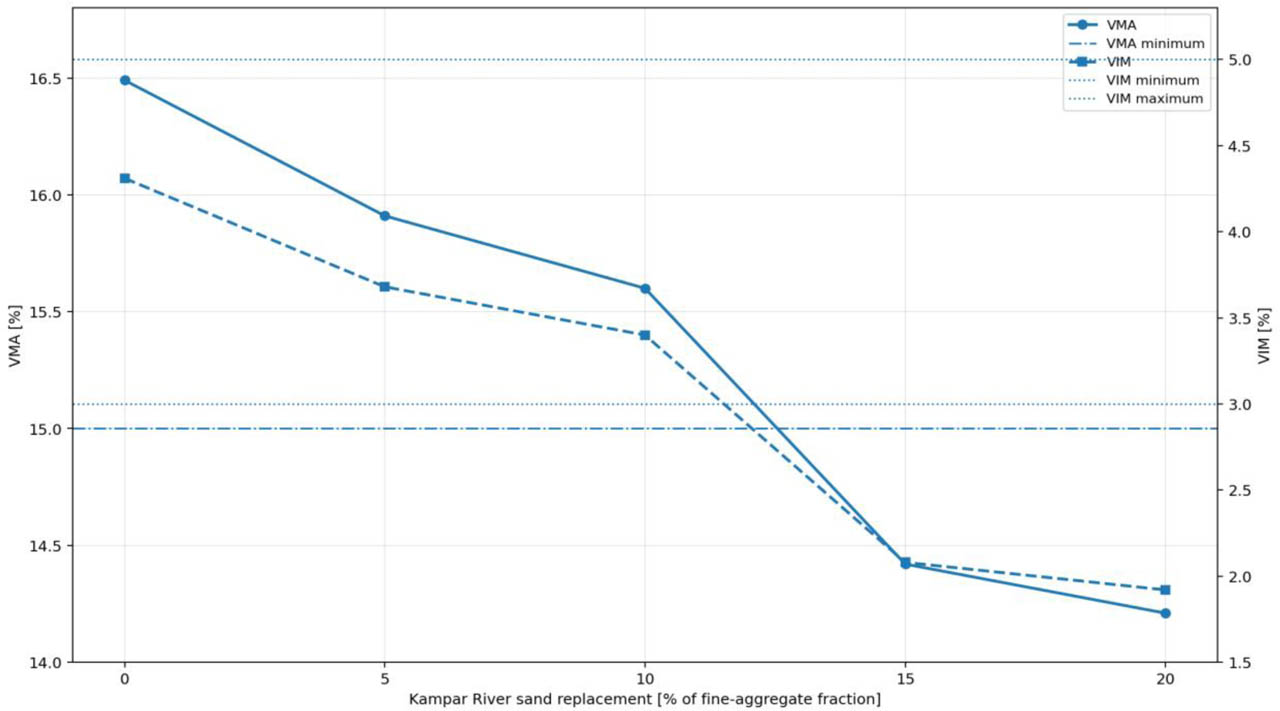
Figure 7:
Mean VMA and VIM responses relative to the adopted specification limits
Table 6:
Marshall results at 5.9% binder content, reported as the mean ± standard deviation of three specimens
| Replacement [% of fine fraction] | Gmm* | Gsb | Gmb | Stability [kg] | Flow [mm] | MQ [kg/mm] | VMA [%] | VFA [%] | VIM [%] | Pbe [%] ** |
|---|---|---|---|---|---|---|---|---|---|---|
| 0 | 2.401 | 2.589 | 2.298 ± 0.001 | 1356.13 ± 36.59 | 3.16 ± 0.05 | 429.56 ± 4.72 | 16.49 ± 0.04 | 73.89 ± 0.21 | 4.31 ± 0.04 | 5.462 |
| 5 | 2.401 | 2.588 | 2.313 ± 0.002 | 1951.87 ± 58.71 | 3.12 ± 0.02 | 626.30 ± 20.38 | 15.91 ± 0.07 | 76.88 ± 0.42 | 3.68 ± 0.08 | 5.448 |
| 10 | 2.401 | 2.586 | 2.319 ± 0.009 | 1753.30 ± 160.07 | 3.45 ± 0.04 | 508.31 ± 47.59 | 15.60 ± 0.32 | 78.24 ± 1.87 | 3.40 ± 0.36 | 5.419 |
| 15 | 2.401 | 2.585 | 2.351 ± 0.001 | 2063.27 ± 38.48 | 3.70 ± 0.01 | 557.62 ± 8.97 | 14.42 ± 0.03 | 85.55 ± 0.20 | 2.08 ± 0.03 | 5.404 |
| 20 | 2.401 | 2.583 | 2.355 ± 0.001 | 1869.53 ± 183.95 | 3.84 ± 0.03 | 487.49 ± 51.01 | 14.21 ± 0.04 | 86.50 ± 0.27 | 1.92 ± 0.04 | 5.375 |
| Specification | - | - | - | ≥ 800 | 2–4 | ≥ 250 | ≥ 15 | ≥ 65 | 3–5 | - |
Table 7 provides the specimen-level bulk specific gravity (Gmb), theoretical maximum specific gravity (Gmm), and recalculated volumetric values for the replacement stage. The same Gmm value is shown for all mixtures because the laboratory appendix reported Gmm = 2.401 for every composition; this point is retained as a limitation and should be verified through composition-specific Gmm testing.
Table 7:
Specimen-level Gmb and Gmm data for the replacement stage at 5.9% binder content
| Replacement [% fine fraction] | Specimen | Gsb | Gmb | Gmm | VIM [%] | VMA [%] | VFA [%] |
|---|---|---|---|---|---|---|---|
| 0 | 1 | 2.589 | 2.299 | 2.401 | 4.25 | 16.46 | 74.21 |
| 0 | 2 | 2.589 | 2.297 | 2.401 | 4.31 | 16.52 | 73.89 |
| 0 | 3 | 2.589 | 2.297 | 2.401 | 4.33 | 16.53 | 73.83 |
| 5 | 1 | 2.588 | 2.312 | 2.401 | 3.70 | 15.99 | 76.81 |
| 5 | 2 | 2.588 | 2.315 | 2.401 | 3.58 | 15.88 | 77.59 |
| 5 | 3 | 2.588 | 2.311 | 2.401 | 3.74 | 16.02 | 76.59 |
| 10 | 1 | 2.586 | 2.309 | 2.401 | 3.81 | 16.08 | 76.32 |
| 10 | 2 | 2.586 | 2.325 | 2.401 | 3.16 | 15.51 | 79.63 |
| 10 | 3 | 2.586 | 2.324 | 2.401 | 3.20 | 15.55 | 79.44 |
| 15 | 1 | 2.585 | 2.350 | 2.401 | 2.11 | 14.59 | 85.57 |
| 15 | 2 | 2.585 | 2.351 | 2.401 | 2.07 | 14.57 | 85.77 |
| 15 | 3 | 2.585 | 2.352 | 2.401 | 2.04 | 14.54 | 85.97 |
| 20 | 1 | 2.583 | 2.354 | 2.401 | 1.95 | 14.46 | 86.50 |
| 20 | 2 | 2.583 | 2.356 | 2.401 | 1.87 | 14.39 | 87.03 |
| 20 | 3 | 2.583 | 2.355 | 2.401 | 1.90 | 14.42 | 86.79 |
* Note. VIM, VMA, and VFA were recalculated using the composition-specific Gsb values, specimen-level Gmb values, and the Gmm value reported in the laboratory appendix. Because composition-specific Gmm values were not available, the table supports transparency of the current calculation basis but does not replace the need for future Gmm verification.
Table 8:
Compact pass/fail summary for the adopted Marshall and volumetric criteria
| Replacement [% fine fraction] | Stability ≥ 800 kg | Flow 2–4 mm | MQ ≥ 250 kg/mm | VMA ≥ 15% | VFA ≥ 65% | VIM 3–5% | Overall |
|---|---|---|---|---|---|---|---|
| 0 | Pass | Pass | Pass | Pass | Pass | Pass | Pass |
| 5 | Pass | Pass | Pass | Pass | Pass | Pass | Pass |
| 10 | Pass | Pass | Pass | Pass | Pass | Pass | Pass |
| 15 | Pass | Pass | Pass | Fail | Pass | Fail | Fail |
| 20 | Pass | Pass | Pass | Fail | Pass | Fail | Fail |
* Note. Pass/fail status was assigned from the mean values in Table 6 and the adopted limits used in this study. The 15 and 20% mixtures failed overall because their VMA and VIM values were below the specified limits, even though their mechanical indicators satisfied the adopted thresholds.
3.4. Statistical Analysis
The one-way ANOVA identified a statistically significant effect of replacement level on every response evaluated in Table 9. With df1 = 4 and df2 = 10, all p-values were below 0.001. These results indicate only that at least one group differed from the others. Because each group contained only three observations, the engineering interpretation placed greater weight on response magnitude, standard deviation, and compliance with the specification limits.
Table 9:
Table caption, the numbering is automatic, use “Update Field”
| Response | df1 | df2 | F | p | Eta-squared |
|---|---|---|---|---|---|
| Gmb [-] | 4 | 10 | 111.949 | < 0.001 | 0.978 |
| Stability [kg] | 4 | 10 | 16.911 | < 0.001 | 0.871 |
| Flow [mm] | 4 | 10 | 319.646 | < 0.001 | 0.992 |
| MQ [kg/mm] | 4 | 10 | 15.372 | < 0.001 | 0.860 |
| VMA [%] | 4 | 10 | 131.026 | < 0.001 | 0.981 |
| VFA [%] | 4 | 10 | 120.855 | < 0.001 | 0.980 |
| VIM | 4 | 10 | 111.949 | < 0.001 | 0.978 |
* Note. Eta-squared represents the proportion of total variation associated with replacement level. The ANOVA for Gmb, VMA, VFA, and VIM was recalculated from specimen-level mass data using the composition-specific Gsb values. The large effect sizes should not be interpreted as overcoming the limitations of the small number of replicates or the need to verify Gmm for each composition.
4. Discussion
4.1. Interpretation of Results
The results show that Kampar River sand can serve as a partial replacement for stone dust in AC-WC, but only within a limited range. After recalculation with composition-specific Gsb, the mixtures containing 5 and 10% river sand in the fine-aggregate fraction met all adopted criteria, whereas the 15 and 20% mixtures failed the VMA and VIM requirements. The improvement in mechanical response at low replacement levels was not monotonic and should be considered together with the volumetric changes. At 5% replacement, both stability and MQ increased with relatively small standard deviations. The 10% mixture also complied with the specifications, although its results were more variable. The initial improvement may reflect a more favorable arrangement of particles and better filling of interparticle spaces. This explanation remains tentative because fine aggregate angularity, surface texture, uncompacted void content, and packing density were not measured directly. Previous studies of alternative fine aggregates and fillers similarly indicate that mixture response depends strongly on the source, shape, gradation, and proportion of the modified fine fraction (Kamran et al., 2023; Khan et al., 2023a, 2023b).
As the river-sand content increased, VMA and VIM decreased while VFA increased. This pattern cannot be explained by over-densification or binder absorption alone. The composition-specific Gsb declined from 2.589 to 2.583, while Gmb increased from 2.298 to 2.355; together, these changes directly reduced VMA. The derived calculations also showed that Pba increased from 0.465 to 0.558%, whereas Pbe decreased from 5.462 to 5.375%, a change of only 0.087 percentage points. This modest reduction in Pbe may have contributed to a thinner binder film, but it does not by itself account for the marked decrease in VMA and VIM at 15 and 20% replacement. The higher packing density indicated by Gmb is likely to have had a stronger influence. At these replacement levels, the high VFA values do not demonstrate satisfactory performance because VMA and VIM were simultaneously below their limits. Since the same Gmm value of 2.401 was reported for all compositions, the respective contributions of absorption and aggregate packing should be confirmed by measuring composition-specific Gmm, packing characteristics, and binder-film thickness.
To avoid relying on an undefined optimization label, the candidates were evaluated in three steps. First, each mixture had to meet the adopted limits for stability, flow, MQ, VMA, VFA, and VIM. Second, stability and MQ were compared among the compliant mixtures. Third, the margins of VMA and VIM above their lower specification limits were considered as safeguards against an overly dense mixture. Among the compliant mixtures, the 5% replacement had the highest stability and MQ. Its VMA was 15.91%, or 0.91 percentage points above the minimum, and its VIM was 3.68%, or 0.68 percentage points above the lower limit. The 10% mixture also met all requirements, but it had smaller volumetric margins, with VMA of 15.60% and VIM of 3.40%, as well as larger standard deviations for stability and MQ. On this basis, the 5% mixture was selected as the primary candidate for further testing, while 10% was the highest replacement level that passed the preliminary screening.
4.2. Performance-oriented Implications
The improvement observed in the Marshall results should not be taken to mean that pavement performance will continue to improve as more river sand is added. Marshall stability is an empirical measure obtained under monotonic loading; it does not directly represent resistance to rutting, fatigue cracking, moisture damage, or long-term aging. Mixture behavior may also be affected by binder chemistry and modification (Porto et al., 2019). The present results are limited to one source of sand, one binder grade, and one aggregate system. Before field use is considered, the 5 and 10% mixtures should be examined for moisture susceptibility, indirect tensile strength, wheel-tracking or repeated-load deformation, and cracking resistance.
This need for performance testing is supported by earlier studies. Albayati and Abdulsattar (2020) found that natural-sand content was related to moisture susceptibility, permanent deformation, and fatigue response, confirming that Marshall stability alone is not sufficient to demonstrate improved pavement performance. Alsheyab et al. (2024) assessed natural river sand using IDEAL-CT, DCT, flow number, and tensile strength ratio tests, illustrating the value of linking volumetric properties with performance-based indicators. Under a balanced mix design approach, mixtures that satisfy basic volumetric requirements must still be checked against several forms of distress, including rutting, cracking, aging, fatigue, and moisture susceptibility (Li et al., 2023). Moisture susceptibility may be evaluated using AASHTO T 283, while AASHTO T 324 Hamburg wheel-track testing can be used to assess rutting and moisture-related damage under repeated wheel loading in water (American Association of State Highway and Transportation Officials, 2022, 2023). At a minimum, these tests should be completed before a field recommendation is made. The acceptance targets adopted for pre-implementation screening are a tensile strength ratio (TSR) of not less than 80% under AASHTO T 283 and a Hamburg rut depth of not greater than 12.5 mm under AASHTO T 324. Limitations
4.3. Limitations
All specimens in the replacement stage were prepared at a total binder content of 5.9%. The composition-specific Gsb values made it possible to calculate Pba and Pbe for each mixture. Across the replacement range, Pba increased from 0.465% in the control to 0.558% at 20%, while Pbe decreased from 5.462 to 5.375%. The change in Pbe was small and was derived using the common Gmm value of 2.401 reported for all mixtures. Any interpretation of binder-film thickness therefore remains provisional until Gmm is measured for each composition and, preferably, film thickness is assessed directly.
Two issues concerning the consistency of the volumetric data remain unresolved. First, the component specific gravities recorded in the Marshall worksheets differ from the characterization results in Table 1. This difference is plausibly attributable to rounding in worksheet entries, tests performed on different dates, or aggregate lots that were not identical to those used for characterization, but the records are insufficient to identify a single cause. Second, although a separate Gsb value is available for each mixture, ranging from 2.589 to 2.583, the same Gmm value of 2.401 was reported at every river-sand level. This assumption may affect VIM, Gse, Pba, and Pbe in particular. The source data should therefore be reconciled, and Gmm should be determined for each composition before the results are used to support a final mixture design.
Fine aggregate angularity (FAA; AASHTO T 304/ASTM C1252), uncompacted void content, surface texture, and packing density were not measured directly. The observed mechanical and volumetric changes therefore cannot be assigned conclusively to gradation, particle shape, absorption, or compaction as separate mechanisms.
Each condition was represented by only three specimens, although every specimen was prepared from an independent batch. The specimen-level data allowed standard deviations to be reported and an exploratory ANOVA to be performed, but the sample size was too small for broad generalization or for robust assessment of distributional assumptions. The relatively high variability in stability and MQ at 10 and 20% replacement also suggests that future testing should include more replicates and tighter control of between-batch preparation.
The testing program did not cover moisture susceptibility, wheel tracking, cracking resistance, fatigue, or aging. Future studies should determine a separate OBC for the control, 5%, and 10% mixtures; measure Gmm for each composition and confirm Pba and Pbe; increase the number of independent replicates; and evaluate FAA (AASHTO T 304/ASTM C1252), packing density, AASHTO T 283, and AASHTO T 324 before proposing field application.
5. Conclusion
The results indicate that Kampar River sand may be used as a partial replacement for stone dust in the tested ACWC mixture, provided that the replacement level remains limited. The main conclusions are summarized below:
The Marshall design curves gave mean VIM values of 4.63% at 5.5% binder and 3.76% at 6.0% binder. Interpolation at a target VIM of 4.0% produced a binder content of 5.86%, which was rounded to 5.9% and confirmed as the OBC.
The verification specimens at 5.9% OBC produced stability of 1356.13 ± 36.59 kg, flow of 3.16 ± 0.05 mm, MQ of 429.56 ± 4.72 kg/mm, VMA of 16.49 ± 0.04%, VIM of 4.31 ± 0.04%, and VFA of 73.89 ± 0.21%. The calculation audit gave Gse = 2.620, Pba = 0.465%, and Pbe = 5.462%.
A 5% replacement of the fine-aggregate fraction, equivalent to 3.05% of the total aggregate, provided the strongest combination of mechanical and volumetric properties under the adopted calculation basis. This mixture had stability of 1951.87 ± 58.71 kg, MQ of 626.30 ± 20.38 kg/mm, VMA of 15.91 ± 0.07%, and VIM of 3.68 ± 0.08%. The 10% mixture also met every criterion, but its VMA of 15.60 ± 0.32% and VIM of 3.40 ± 0.36% left smaller volumetric margins and its results showed greater variability.
Although the mixtures containing 15 and 20% river sand developed high stability, their VMA values were 14.42 ± 0.03 and 14.21 ± 0.04%, respectively, and their VIM values were 2.08 ± 0.03 and 1.92 ± 0.04%. Both mixtures therefore failed to meet the adopted volumetric requirements.
The findings for the 5 and 10% mixtures should be regarded as preliminary because each condition was represented by only three independent batches. Composition-specific Gsb values were used to obtain Pbe values ranging from 5.462 to 5.375%, but the same Gmm value of 2.401 was reported for all mixtures. Before field implementation, further work should determine Gmm and OBC for each relevant composition, increase replication, assess FAA (AASHTO T 304/ASTM C1252) and packing density, and conduct AASHTO T 283 testing with a target TSR ≥ 80% and AASHTO T 324 testing with a target rut depth ≤ 12.5 mm.
Acknowledgements
The authors are grateful to the Civil Engineering Laboratory, Faculty of Engineering, Universitas Abdurrab, for providing the facilities used in specimen preparation and testing. Financial support from the Institute for Research and Community Service (LPPM), Universitas Abdurrab, is also gratefully acknowledged.
Notes
[8] Contributed by Author Contributions
D.R.B.: conceptualization, methodology, investigation, formal analysis, visualization, and preparation of the original draft. R.T.: supervision, validation, review, and editing. N.E.D.: data curation, interpretation, review, and editing. Z.S.: investigation, resources, review, and editing. All authors reviewed and approved the final manuscript and accepted responsibility for the integrity of the work.
[9] Disclosure of Interest
The authors declare that they have no competing financial interests or personal relationships that could have influenced the work reported in this article.
[10] Data Availability Statement
Specimen-level data from the OBC determination and all replacement levels were used to calculate the means, standard deviations, and ANOVA results reported in this article. The original weighing sheets, Gmb-Gmm calculations, Marshall summaries, and composition-specific Gsb values are retained in the supporting research files. Pba and Pbe for the 0–20% mixtures were recalculated using Gse = 2.6196 and the Gsb value for each composition. Because Gmm was reported as 2.401 for all mixtures, composition-specific Gmm data are not yet available and remain necessary for final validation.