

1. Introduction
The SSPSW structure is a building system that exhibits good seismic performance. This structural system consists of frames and slit steel plates. The slit steel plates are uniformly arranged vertically within a certain frame, with the frames carrying vertical loads and the shear walls resisting lateral loads. The layout is shown in Figure 1. The shear wall consists of a steel plate partitioned into multiple vertical strips, known as flexural links, by the slits in it (Liang et al., 2023). In contrast to traditional steel plate shear walls, the slit steel plate doesn't generate a tension field. When subjected to horizontal seismic loads, these flexural links undergo bending deformation (Hitaka & Matsui, 2003). This load–bearing mechanism offers the advantage of preventing the structure from shaking due to the global shear buckling of the steel plate (Hao et al., 2023). Moreover, it facilitates easier modification of the shear wall's lateral stiffness, which is beneficial for adjusting the stiffness ratio between the shear wall and the boundary steel frame.
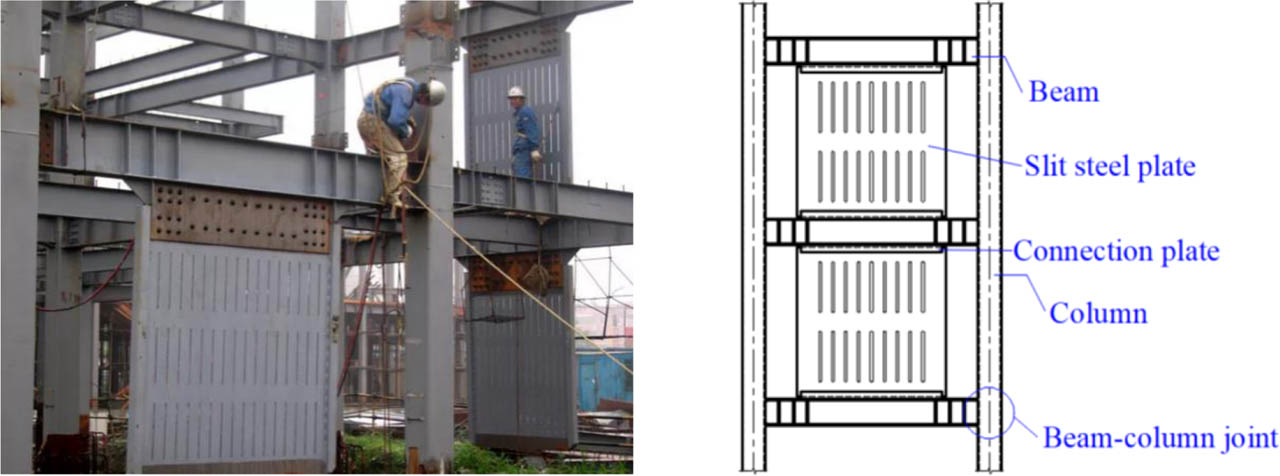
Figure 1:
Layout of slit steel plate shear walls
With the increasing service life of buildings with slit steel plate shear walls, there is a growing demand for structural retrofit. To enhance the shear capacity of existing steel plate shear walls, Azzawi et al. (2019) used prefabricated corrugated FRP components to strengthen shear steel plates, resulting in a ductile failure mode, with significantly improved shear stiffness and fatigue life. Kazem et al. (2018) strengthened steel plate shear walls with CFRP, which effectively enhanced structural stiffness and bearing capacity. Yu et al. (2023) proposed a corrugated FRP-steel sandwich shear wall, reducing excessive out-of-plane buckling deformation of traditional steel plate shear walls. However, there are few studies on the strengthening and repair technologies for existing slit steel plate shear wall structures.
Despite the proven effectiveness of CFRP in strengthening steel structures, the lateral-torsional buckling of flexural links with relatively large width-to-thickness ratios – a critical instability mode that significantly impairs the performance of slit steel plate shear walls – has received a little systematic attention. This paper investigates the seismic behaviour of a CFRP-strengthened slit steel plate shear wall, with a particular focus on the out-of-plane stiffness and buckling resistance of such slender flexural links. Both experimental tests and finite element analyses are conducted, and a theoretical model is proposed to predict the critical buckling load, which is validated over a range of aspect ratios and width-to-thickness ratios. The outcomes not only provide a practical retrofitting solution for existing slit steel plate shear walls but also offer new insights into the lateral-torsional buckling behaviour of CFRP-steel composite flexural members, thereby addressing a clear research gap and contributing to the broader application of CFRP in seismic strengthening.
2. Methodology
2.1. Research Design
To investigate the shear properties and stability of a slit steel plate that is strengthened with FRP, two test specimens with a scale of 1:4 was designed. The SSP (slit steel plate) specimen was a steel plate specimen that features five vertical slits arranged within the plate. The SCP (slit composite plate) specimen was a slit steel plate specimen that had been strengthened with CFRP, maintaining the same dimensions as the SSP specimen. For the SCP specimen, four layers of unidirectional CFRP cloth were laid on one side of the steel plate. The carbon fibres were arranged horizontally to facilitate construction. Once the epoxy resin had fully cured, the thickness of a single layer of CFRP was measured to be 0.7 mm, resulting in a total thickness of 2.4 mm for the four layers combined. The detailed dimensions and configurations of the specimens are illustrated in Figure 2.
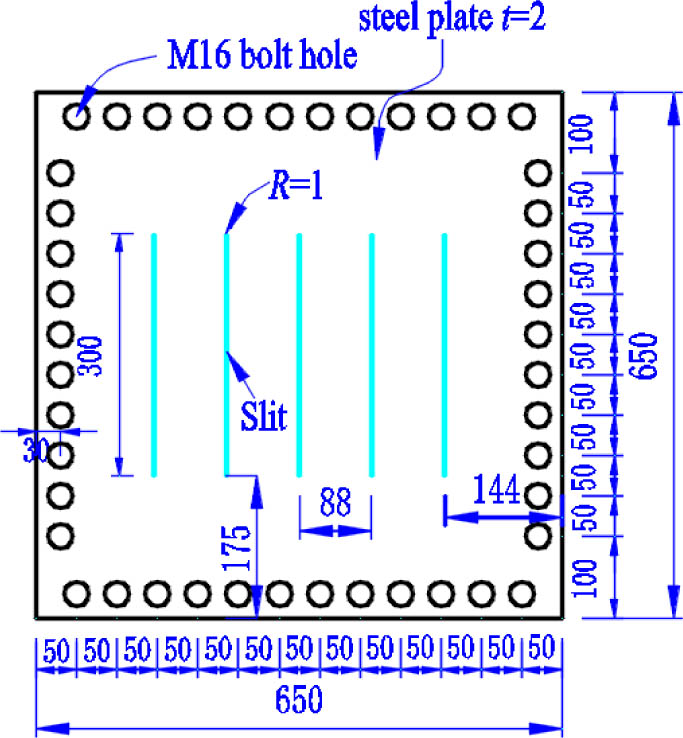
Figure 2:
Dimensions of specimens
2.2. Materials and Procedures
The properties of the materials used in the fabrication of the specimens were tested. The steel plates were made of Q235 steel. Their mechanical properties were tested according to GB/T 228.1-2021 (Standards Press of China, 2021). The main performance indicators for steel are listed in Table 1. The uniaxial tensile properties of the epoxy resin (matrix) were also tested. The test complied with the provisions of ASTM D638-22 (ASTM International, 2013). The stress–strain curves and performance indexes of the epoxy resin are as follows.
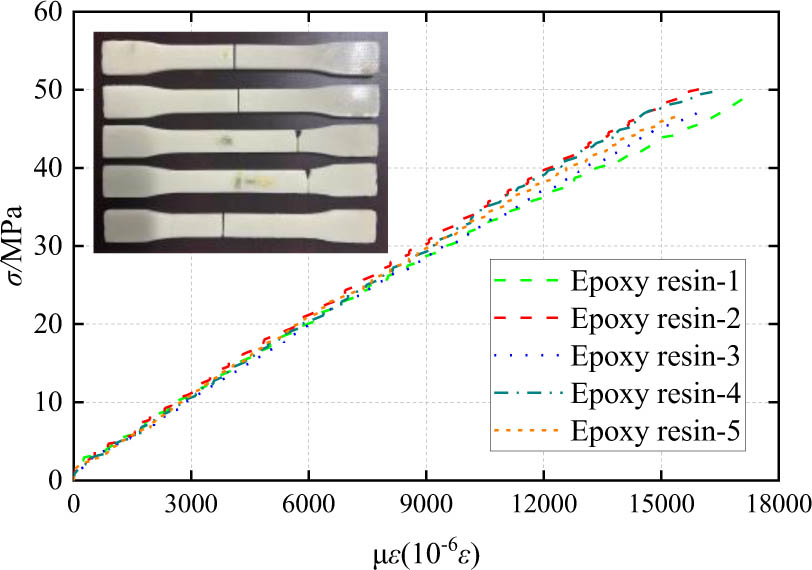
Figure 3:
Tensile test of epoxy
Table 1:
Material properties
| Material | Elastic modulus [GPa] | Yield stress [MPa] | Yield strain [%] | Ultimate stress [MPa] | Elongation [%] |
|---|---|---|---|---|---|
| Steel | 206 | 312 | 0.026 | 423 | 0.34 |
| Epoxy resin | 3.2 | 49 | 0.016 |
The tensile properties of the carbon fibre in both longitudinal and transverse directions were tested according to GB/T 3354-2014 (Standards Press of China, 2014). The thickness of a single layer of carbon fibre was measured to be 0.167 mm. The shear modulus GF of the CFRP is 4100 MPa and the Poisson's ratio is 0.36. The primary performance parameters of the CFRP are listed in Table 2.
2.3. Data Collection
The horizontal load was applied to the pin connection situated on the left side of the top beam. The electro-hydraulic servo actuator utilized in the experiment had a load capacity of 500 kN and a stroke of 100 mm. To prevent the out-of-plane deformation of the specimen, lateral supports were set on both sides of the top beam (Meng et al., 2024), and an out-of-plane displacement meter was set up to monitor the deformation that might occur. LVDTs were arranged on top of both columns to measure the lateral displacement of the specimen. The lateral displacement of the specimen was calculated as the average of the lateral displacements measured by the LVDTs on the left and right columns (Du et al., 2024). The bottom beam of the specimen was fixed to the self-balancing loading frame by M16 bolts, providing a strong and secure connection. The test setup is as shown in Figure 4.
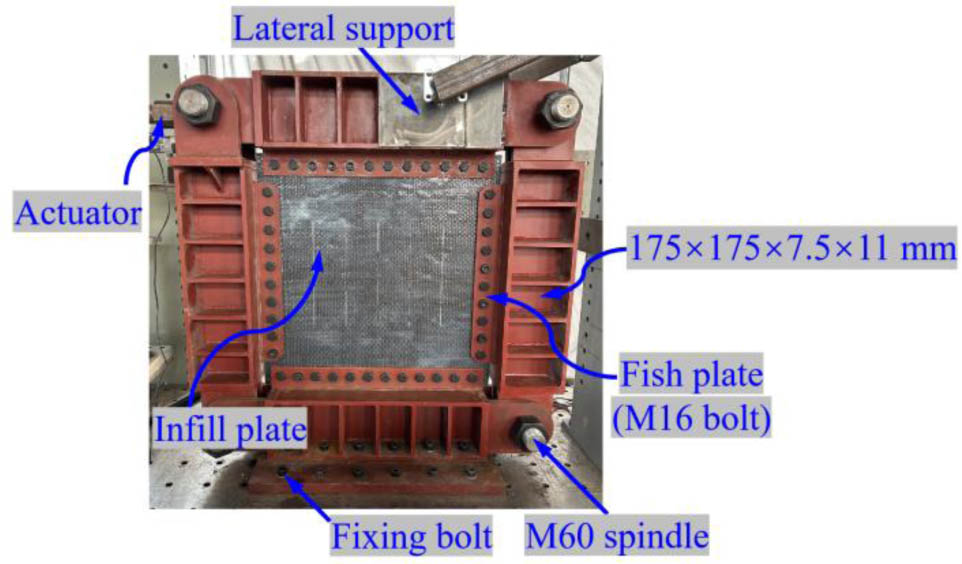
Figure 4:
Loading device
A horizontal low–cycle reciprocating load was applied to the specimen. Each load level was applied once before the predicted yield load was reached, and then each load level was cycled three times. The increments of each load level before and after yielding were 2 mm and 0.5Δy,pred respectively (China Architecture & Building Press, 2020). Δy,pred is the yield lateral displacement predicted based on finite element simulation and the pre-yield loading stage. The drift ratio was defined as the ratio of the horizontal displacement of the specimen to the height of the specimen.
3. Results
3.1. Phenomenon of SSP
When the drift ratio reached 1% (±8 mm), the slit steel plate shear wall exhibited global shear buckling. As the lateral displacement gradually increased, the out-of-plane deformation of the infill plate became increasingly larger (Figure 5 (a)), accompanied by the sound of cracking of the steel plate. At a drift ratio of 2% (±16 mm), bending deformation occurred at the corners of the steel plate (Figure 5 (b)). As the drift ratio increased to 3% (±24 mm), the damage at the corners of the plate intensified, and torsional buckling occurred within the flexural links (Figure 5 (c)). At this load level, cracks started to form at the ends of the slits. The cracks in the steel plate and the torsional deformation of the flexural link are shown in Figure 5 (d). When the drift ratio reached 7% (±56 mm), the steel plate was destroyed. The ends of the flexural links fully yielded, and the corners of the steel plate were severely torn apart (Figure 5 (e)).
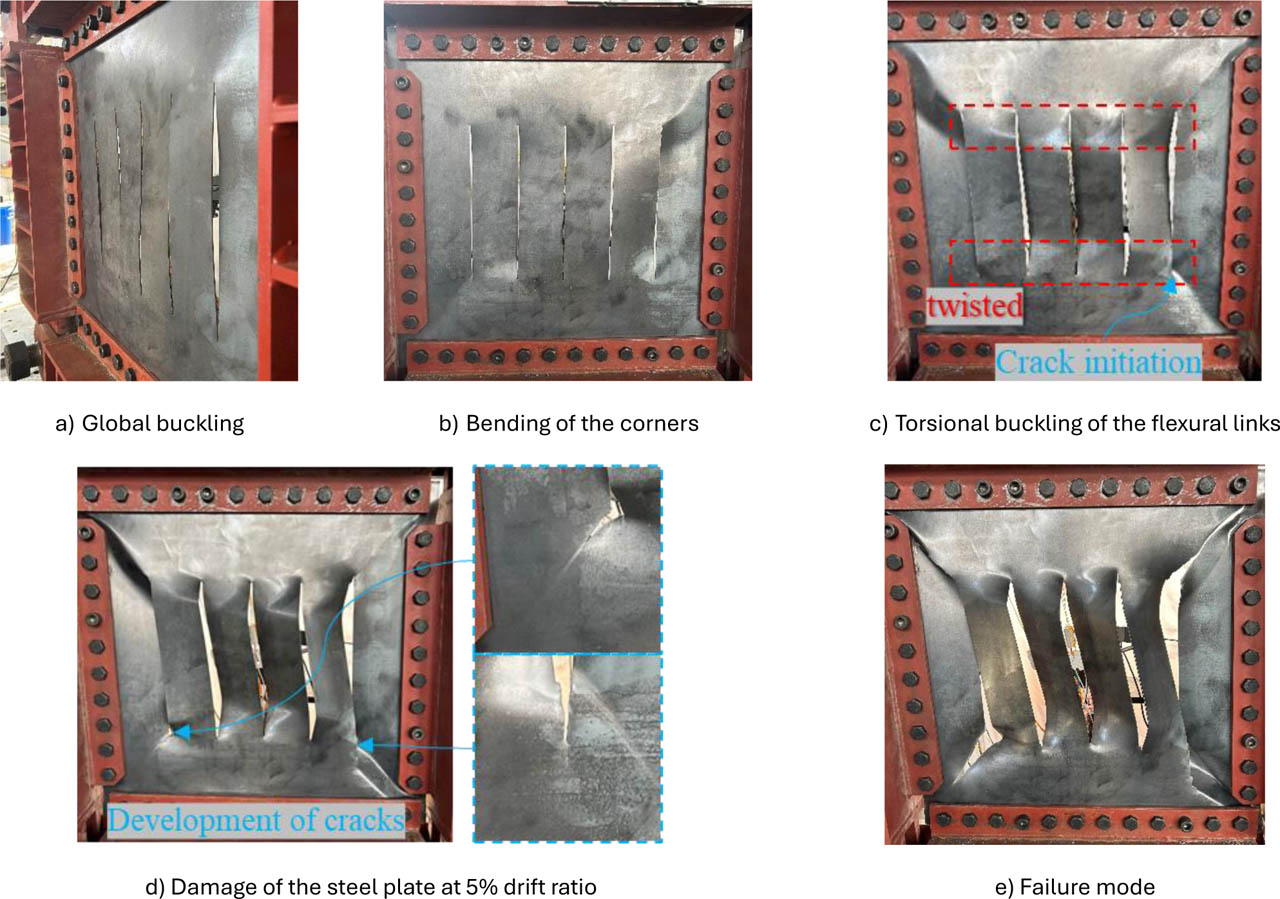
Figure 5:
Phenomenon of SSP
3.2. Phenomenon of SCP
In the SCP specimen, the slit steel plate was strengthened by bonding CFRP onto one side of the plate. The composite plate, which was composed of the CFRP and the steel plate, exhibited global shear buckling at a drift ratio of 1.5% (±12 mm) (Figure 6(a)). When the drift ratio reached 2% (±16 mm), horizontal cracks appeared in the CFRP at the ends of the slits. Signs of debonding were also observed within the flexural links. As the drift ratio increased to 3% (±24 mm), the CFRP strengthened flexural links began to twist (Figure 6(b)), and the CFRP exhibited notable debonding and fracture (Figure 6(c)). At this load level, the specimen reached its maximum load–bearing capacity. As loading continued, the FRP on the flexural links debonded severely (Figure 6(d)). Simultaneously, the steel plate also developed cracks at the slit ends. It was found that the cracking of the steel plate after FRP reinforcement was significantly reduced, demonstrating the effectiveness of the CFRP reinforcement in mitigating damage (Figure 6(e)). When the drift ratio reached 7% (±56 mm), the bearing capacity of the specimen dropped to 85% of its maximum bearing capacity. The test was terminated.
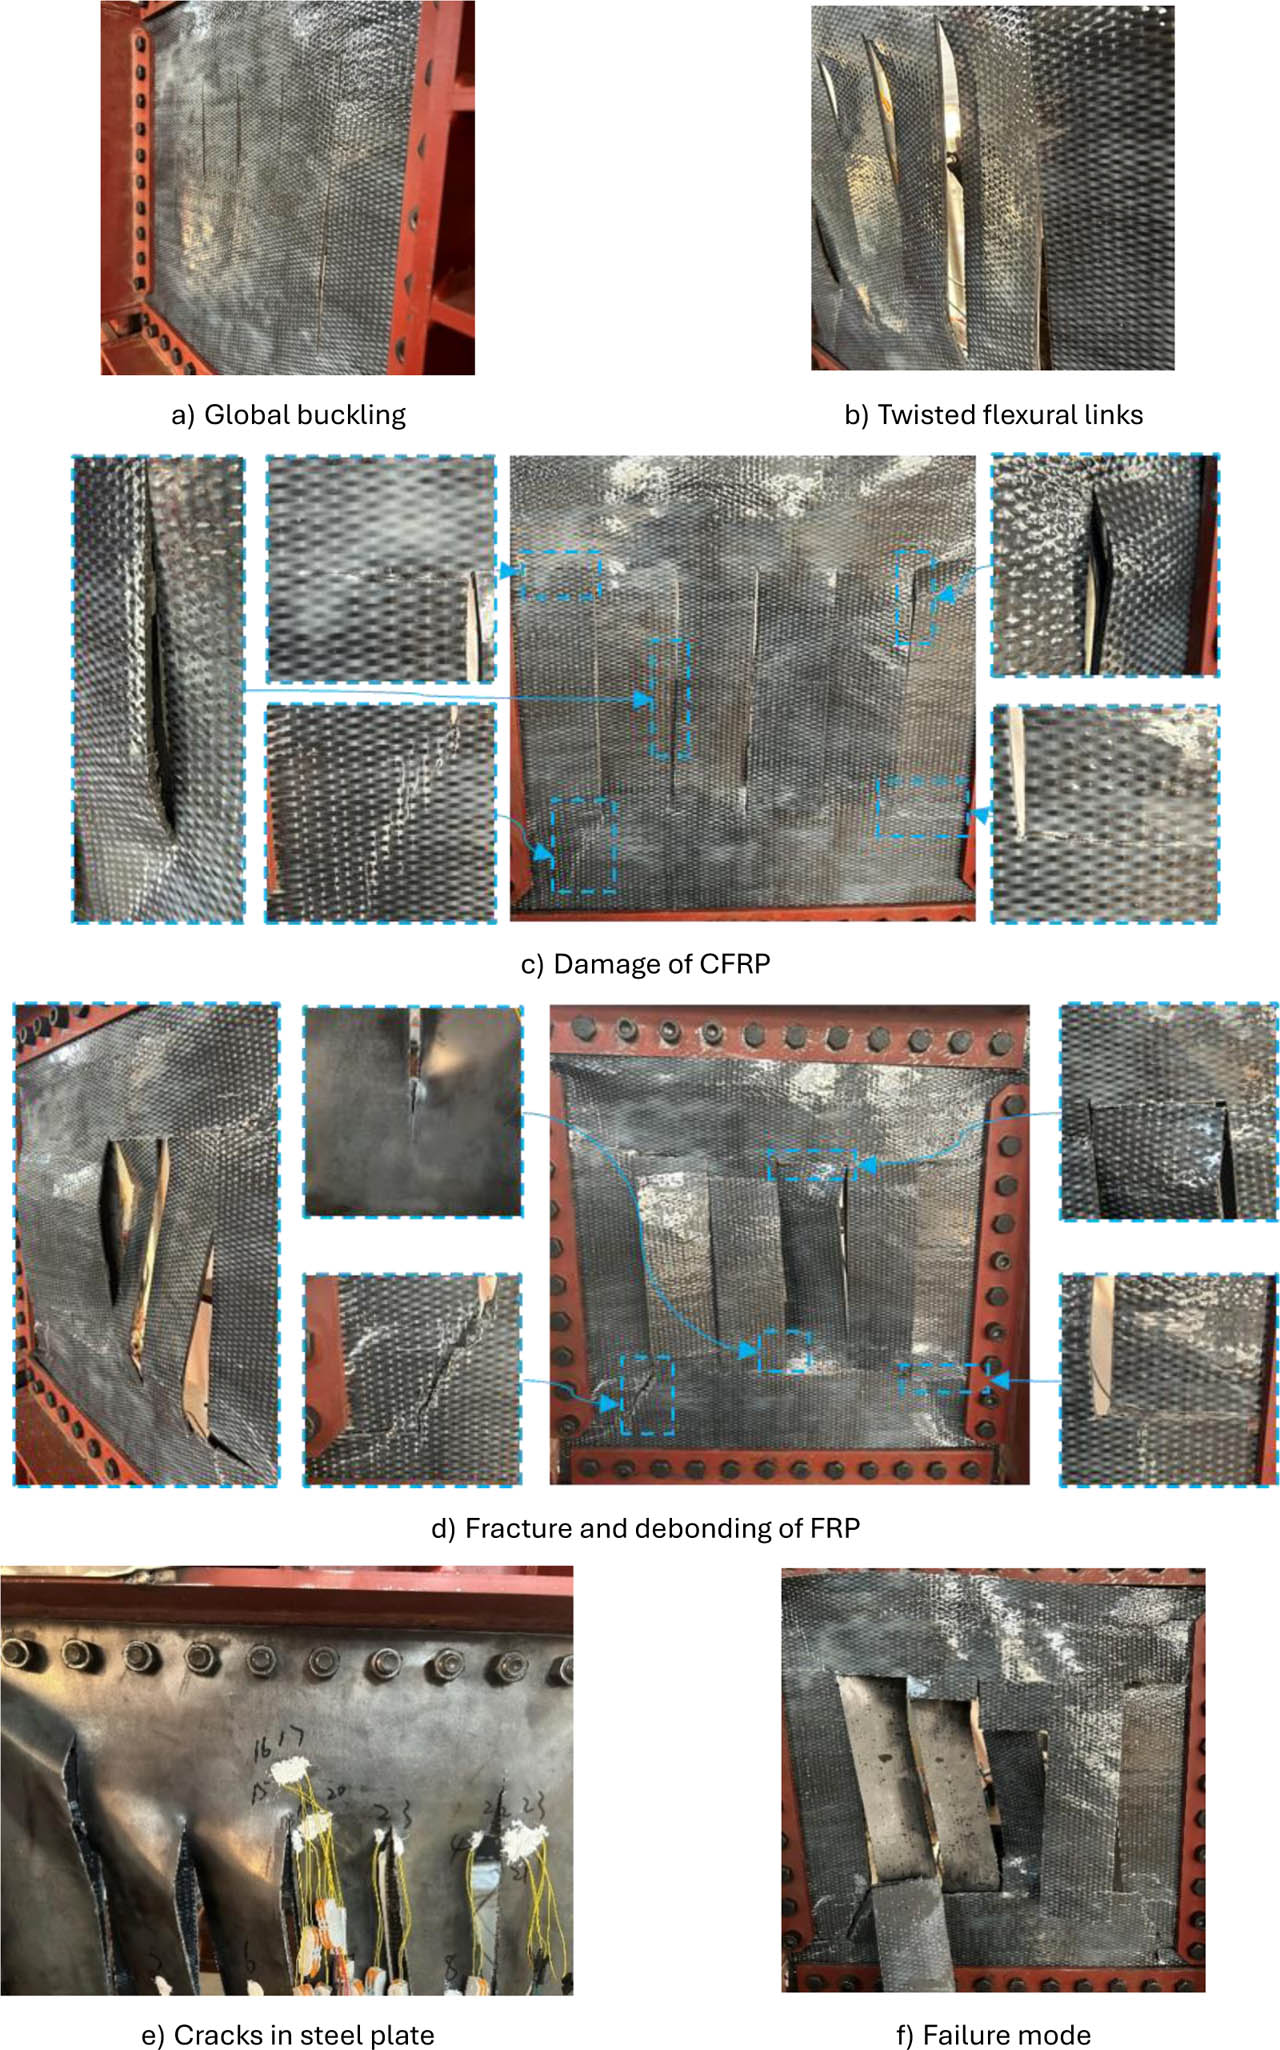
Figure 6:
Phenomenon of SCP
4. Discussion
4.1. Hysteretic Curves
Figure 7 compares the hysteretic curves of the SSP and SCP specimens. Both exhibited a noticeable pinch phenomenon, which was relatively slight when the drift ratio was below 4% but became increasingly pronounced beyond 4%. At higher drift ratios, significant bending and torsional deformations occurred within the flexural links, and the pinch phenomenon was attributed to lateral-torsional buckling of these links. As shown in Figure 7 (a), typical hysteretic loops of both specimens display an inverse S-shape (Standards Press of China, 2024), indicating that FRP strengthening has little effect on the energy dissipation capacity of slit steel plate shear walls. Figure 7 (b) shows that the SCP specimen had a higher bearing capacity than the SSP specimen, with the most notable difference at a drift ratio of 3%. This difference gradually diminished as the drift ratio increased further, due to CFRP damage.
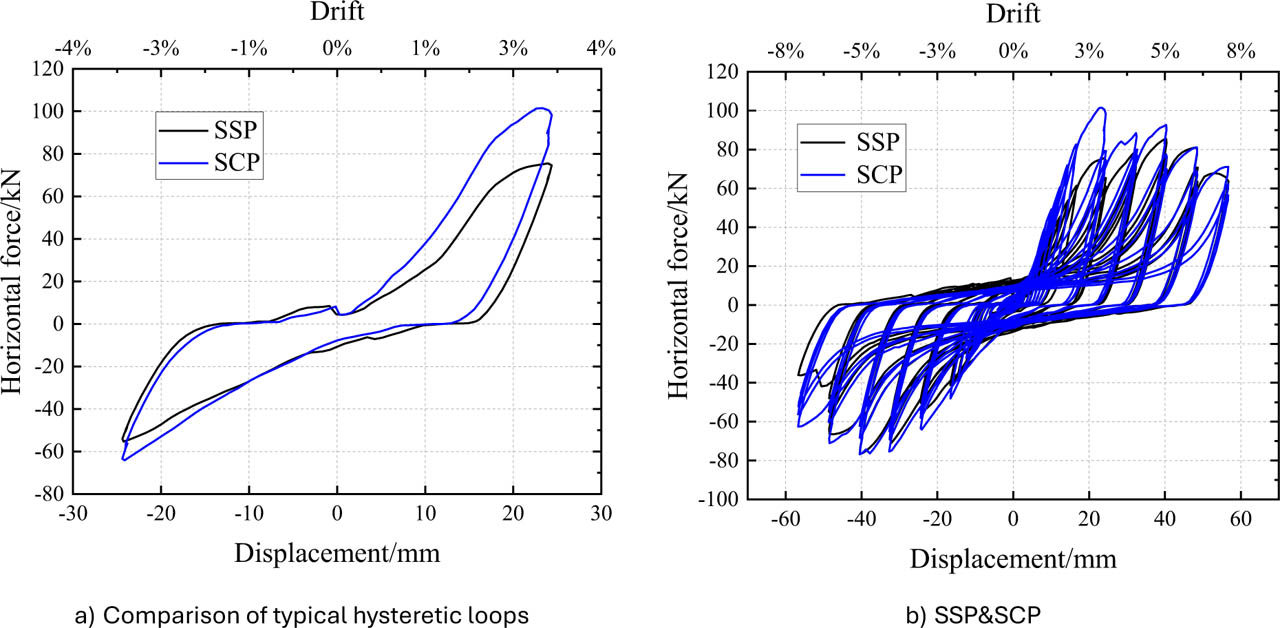
Figure 7:
Hysteretic curves of SSP and SCP
4.2. Skeleton Curves
Figure 8 compares the skeleton curves of the SSP and SCP specimens. At drift ratios below 1.25%, the two curves nearly overlapped, indicating negligible FRP effect on elastic shear stiffness. Beyond 1.25%, their behaviours diverged: the SCP specimen's strength increased rapidly. Damage in SSP stemmed from bending-torsion of flexural links, whereas SCP damage was dominated by overall buckling. The four-layer FRP effectively restrained local buckling of the flexural links, enhancing strength in the elastic-plastic stage. At a 3% drift ratio, the SCP specimen's strength was 34% higher than that of SSP. As loading continued, FRP fracture and debonding caused a rapid strength drop in SCP, yet its strength remained 19% above SSP. Overall, CFRP collaborated well with the slit steel plate shear wall, restraining out-of-plane deformation and increasing structural strength.
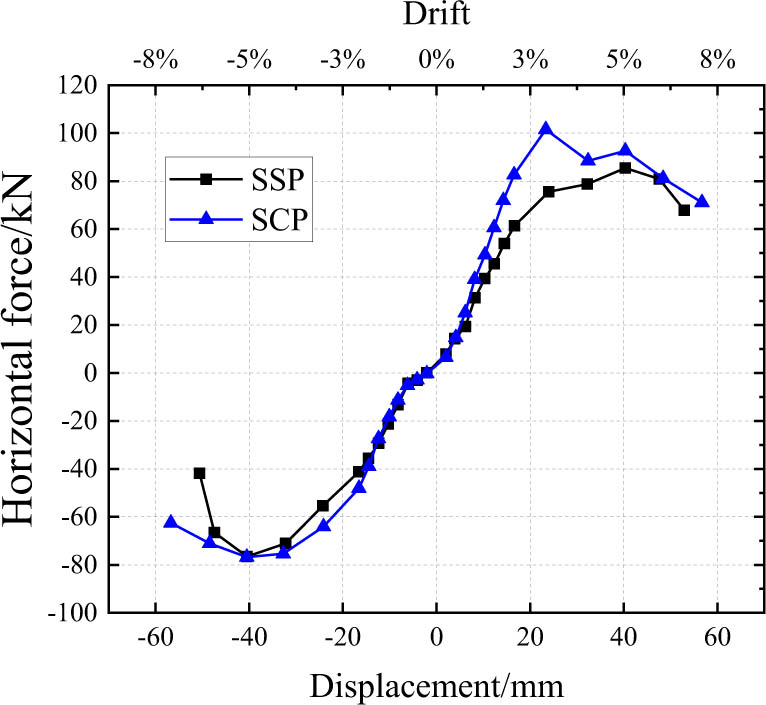
Figure 8:
Skeleton curves
The characteristic values are listed in Table 3. The yield strength was determined by using the geometric method (China Architecture & Building Press, 2015). The yield strength of the SCP specimen, which was strengthened by CFRP, was increased by 23.7%. The ultimate strength of the SCP specimen was increased by 18.8% compared to that of the SSP specimen. The CFRP was partly damaged at this loading stage. Once the ultimate strength was reached, the FRP began to fracture and underwent severe debonding, resulting in a reduction in its strengthening effect. Notably, it was found that the ductility of the SCP specimen was not reduced by the FRP reinforcement, which had a good influence on the performance of the strengthened structure (He & Khadka, 2020).
4.3. Stiffness Degradation
The stiffness degradation is shown in Figure 9. When the drift ratio was less than 4%, the stiffness of the CSP specimen was greater. The stiffness of the SCP specimen was increased by 22% compared to that of the SSP specimen. During the elastic-plastic phase, it was evident that the FRP exerted a noticeable strengthening effect on the slit steel plate shear wall, thereby contributing to the increased stiffness. As the lateral displacement continued to increase, the improvement in stiffness gradually diminished due to the damage to the FRP.
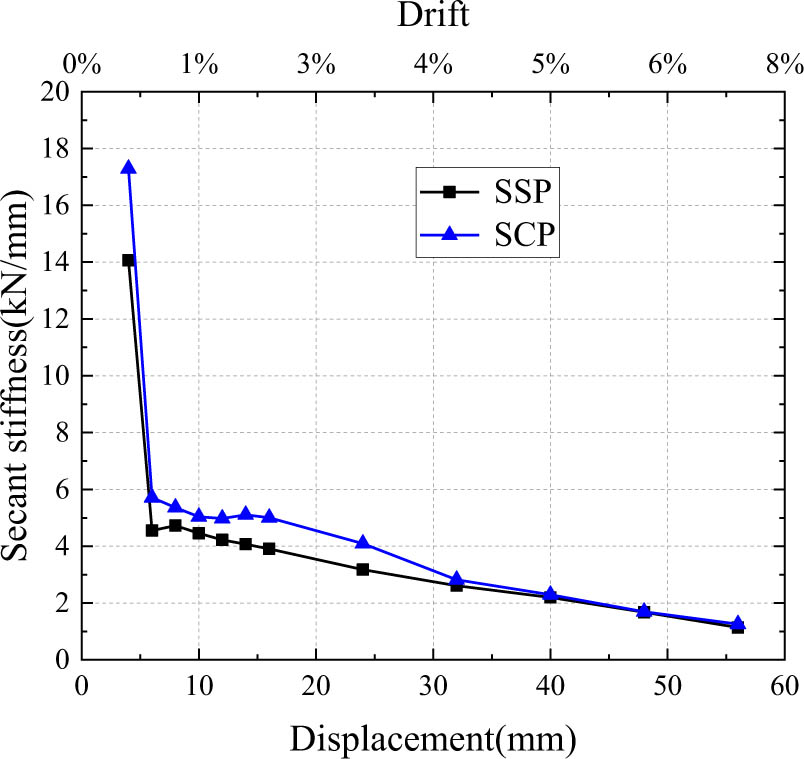
Figure 9:
Secant stiffness
4.4. Energy Dissipation
The cumulative energy dissipation capacity and the dissipative energy coefficient E of the specimens are shown in Fig. 10 and Figure 11, respectively. E can be obtained from the following equation (China Architecture & Building Press, 2015):
Where:
S(ABC+CDA) - the area of the hysteresis loop,
S(OBE+ODF) - the area of the triangle enclosed by the peak load point and axes.
The cumulative energy dissipation capacity of the SCP specimen was slightly higher than that of the SSP specimen. And the dissipative energy coefficient E, which reflects the energy consumption efficiency of the structure, was found to be lower for the SCP specimen. The main reason for the decrease in the dissipative energy coefficient E is that FRP is an elastic material. Although FRP can increase both the bearing capacity and stiffness of the structure, it did not effectively dissipate the energy of reciprocating loads.
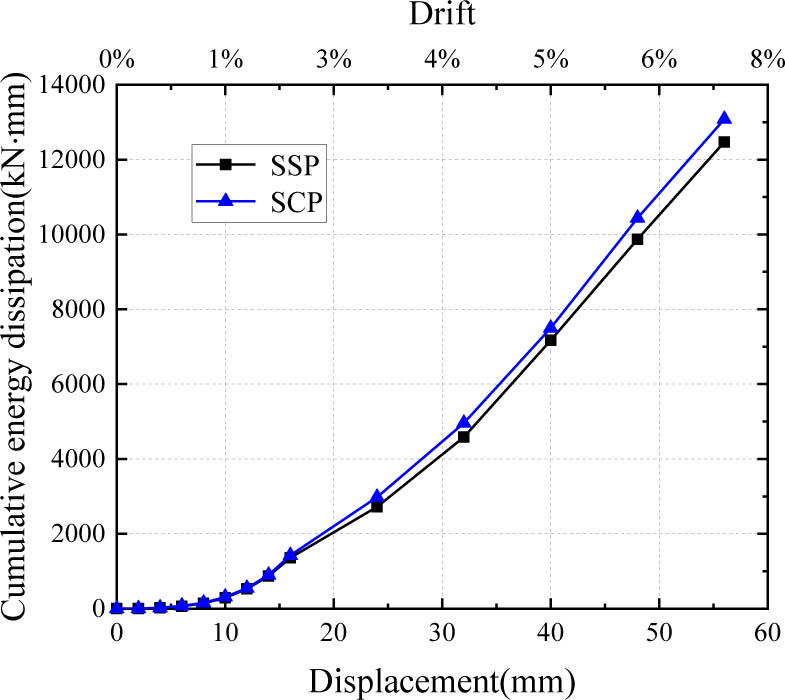
Figure 10:
Cumulative energy dissipation
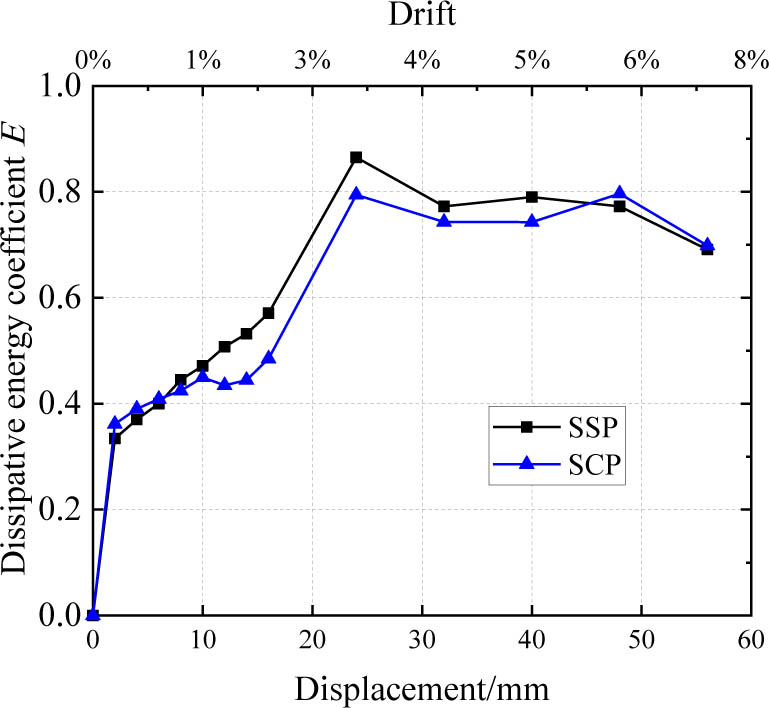
Figure 11:
Dissipative energy coefficient E
5. Analysis of Lateral-torsional Buckling
5.1. Experimental Analysis
The buckling of flexural links exerts a significant influence on the performance of slit steel plate shear walls. Once the lateral-torsional buckling occurred within the flexural link, the deformation mode of the flexural link will change from in-plane bending to out-plane torsion. This characteristic leads not only to a reduction in the stiffness of the slit steel plate shear wall but it also prevents the full utilization of the plastic hinge in the flexural link (Seddighi et al., 2022).
To investigate the buckling behaviour of the flexural link, the strain of the flexural link was measured during the loading test. As shown in Figure 12, the readings from strain gauges G1, G2, G5, G6 were monitored as an indicator for determining the torsional buckling of the flexural link. The flexural link was characterized by bending deformation before buckling. Therefore, the strains on the left and right sides of the plate were antisymmetric. After buckling, the flexural link underwent out-plane bending (Figure 13). As a result, the strains that were previously antisymmetric no longer maintained this pattern (Azzawi et al., 2020).
The strains are depicted in Figure 14. For the SSP specimen, the steel flexural link buckled under a lateral load of 2.9 kN. And for the SCP specimen, the CFRP-steel flexural link buckled under a lateral load of 7.3 kN. The critical buckling load of the flexural link was increased by 151.7%. The reinforcement provided by the CFRP had a profound effect on improving the structural performance.
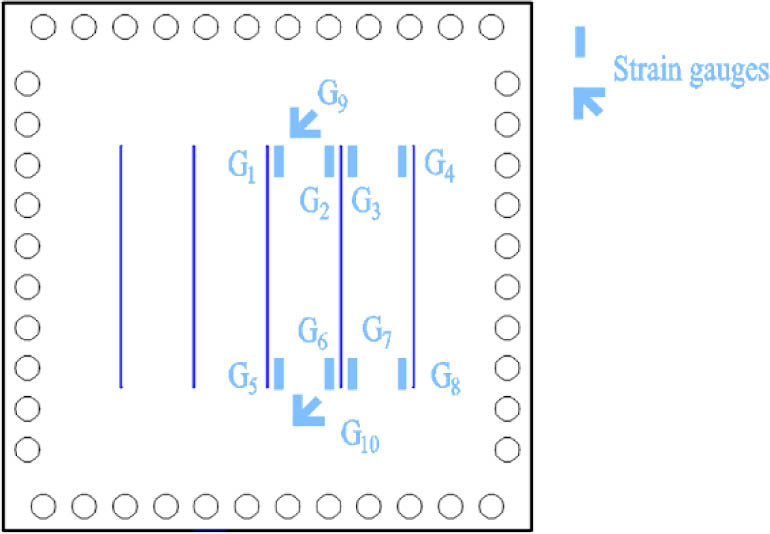
Figure 12:
Arrangement of strain gauges
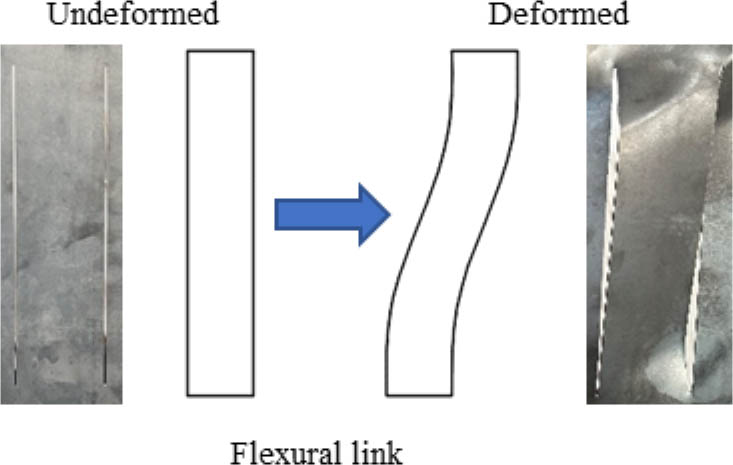
Figure 13:
Buckling mode of flexural link
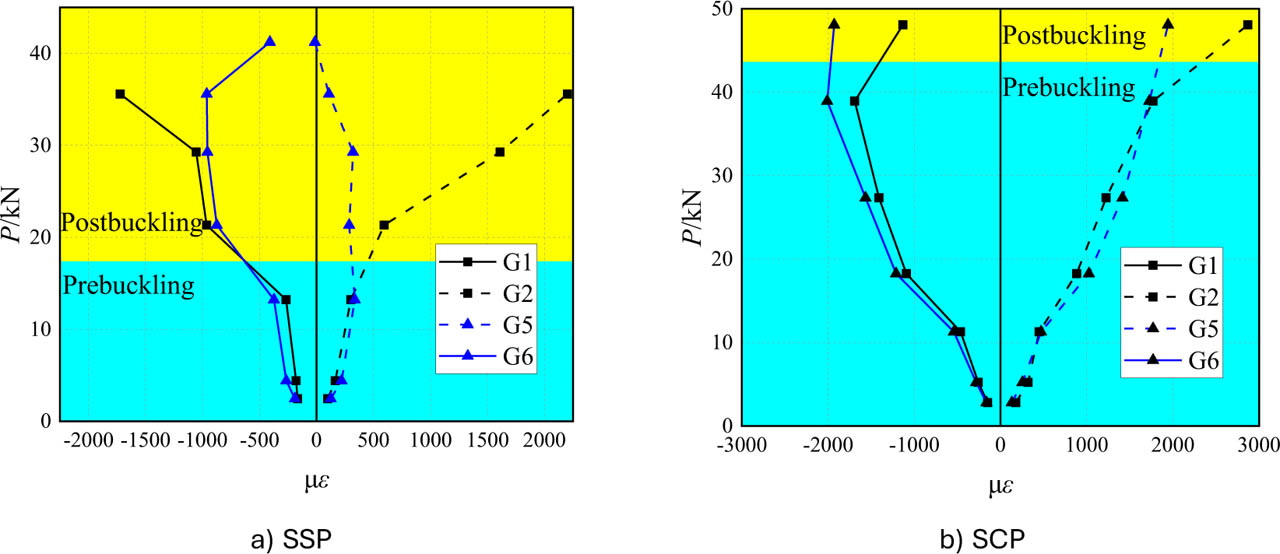
Figure 14:
Strain in flexural link
5.2. Theoretical Analysis
In the design of slit steel plate shear walls, it is important to determine the critical buckling load of the flexural link. It is assumed that the shear stress is uniformly distributed across the section of the slit steel plate (Hitaka & Matsui, 2003). The critical buckling load of the slit steel plate is equal to the sum of the shear loads borne by each individual flexural link. The lateral-torsional buckling strength of a slit steel plate can be calculated using the following equation:
Where:
n - the number of flexural links within the slit steel plate,
l - the length of each flexural link,
E - the Young's modulus of steel,
B - the flexural rigidity of the flexural link.
Where:
C - torsional rigidity of the flexural link, which can be estimated by C≈G×bt3/3,
b - width of the flexural link,
t - thickness of the flexural link,
G - the shear modulus of the steel.
For a slit steel plate shear wall strengthened with CFRP, the performance of its flexural link is determined by both the steel and the CFRP. Both the Young's modulus and the shear modulus of the flexural link need to incorporate with the properties of the FRP. For a laminate structure fabricated from steel and FRP, considering of the thickness and stacking sequence, the effective flexural modulus Ef can be calculated as follows (Gibson, 2016):
Where:
N - the number of layers of the laminate,
t - the total thickness of the laminate,
z - the distance from the mid–plane to the outer boundary of the of the jth layer,
Ex - the Young's modulus of the material in the jth layer along the vertical direction.
The shear modulus of the laminate can be approximated by applying the mixing law (Azzawi et al., 2020):
Where:
G12 - the shear modulus of the FRP–steel laminate,
GF - the shear moduli of CFRP, 6400 MPa,
Gs - the shear moduli of steel, 79230 MPa,
νF - the Poisson's ratio of FRP, 0.28,
νs - the Poisson's ratio of steel, 0.3.
Substituting Equation (4) and (5) into Equation (2), the critical lateral–torsional buckling strength of the FRP–steel laminate can be estimated.
5.3. Numerical Modelling
The finite element (FE) analysis software ABAQUS was used to establish the numerical model (Dassault Systèmes, 2001). The ends of the beams and columns were connected by “Hinge” command. The “Tie” command was used to connect the steel plate and the CFRP laminate. Displacement was applied to the middle of the top beam of the specimen so that the top beam would move along the U1 orientation. Constraints were applied so that the top beam was free to move in the U3 direction but could not move in the U2 direction or rotate. The interactions between the components are illustrated in Figure 14. The S4R element, which is a four–node shell element with linear shape function and reduced integral, was adopted for the simulation of the steel plate and the CFRP laminate.
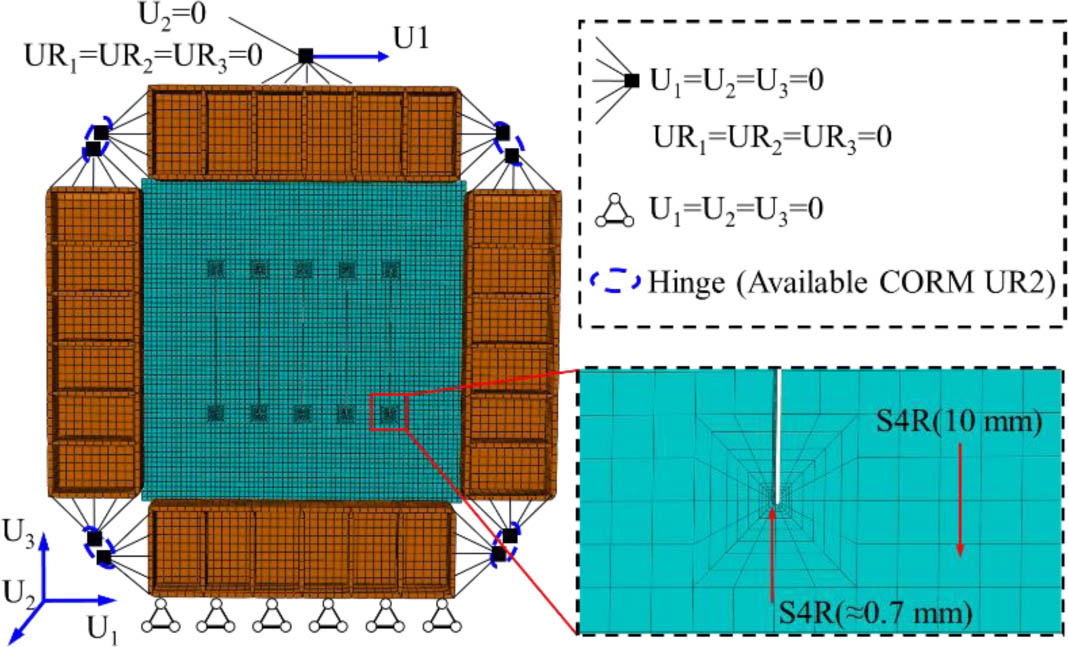
Figure 14:
Interactions and meshing
The main performance parameters of the material were determined from the test results. The constitutive model of steel adopts a bilinear model. The main mechanical properties of the steel (Q235) were determined from uniaxial tensile tests conducted according to GB/T 228.1–2021. The measured elastic modulus E was 206 GPa, the yield stress fy was 312 MPa, and the yield strain was approximately 0.026. To represent the steel behaviour in the finite element (FE) simulations, a bilinear elasto-plastic constitutive model was employed. In this model, the stress–strain relationship is idealized by two straight segments: an initial linear elastic portion up to yielding, governed by the elastic modulus E, followed by a perfectly plastic (or linear hardening) portion beyond yielding. For the infilled slit steel plate and CFRP laminate, the length of the plate is much greater than its thickness. The CFRP laminate is assumed to be in a plane stress condition. The stress–strain relation of the CFRP laminate can be express as Equation (6). The values of the main parameters of the constitutive model are given in Section 2.2.
The initiation and evolution of material damage in fibre-reinforced materials were also introduced in modelling. The damage initiation criterion for CFRP laminate is based on (Hashin, 1980) and is presented in Equation (7). The energy–controlled linear evolution criterion was adopted for damage evolution.
Where:
XT - the longitudinal tensile strength of unidirectional fibre-reinforced composite,
XC - the longitudinal compressive strength,
YT - the transverse tensile strength,
YC - the transverse compressive strength,
SL - the longitudinal shear strength,
ST - the transverse shear strength,
α - a coefficient that determines the contribution of the shear stress to the fibre tensile initiation criterion.
To investigate the accuracy of this modelling approach, models for SSP and SCP specimen were established. The hysteretic curves are compared and shown in Figure 15. The hysteretic curves obtained from the experiment and FE analysis show the same pinch phenomenon, indicating that the FE model accurately reflects the energy dissipation performance of the specimen. The results of the numerical analysis are of high accuracy.
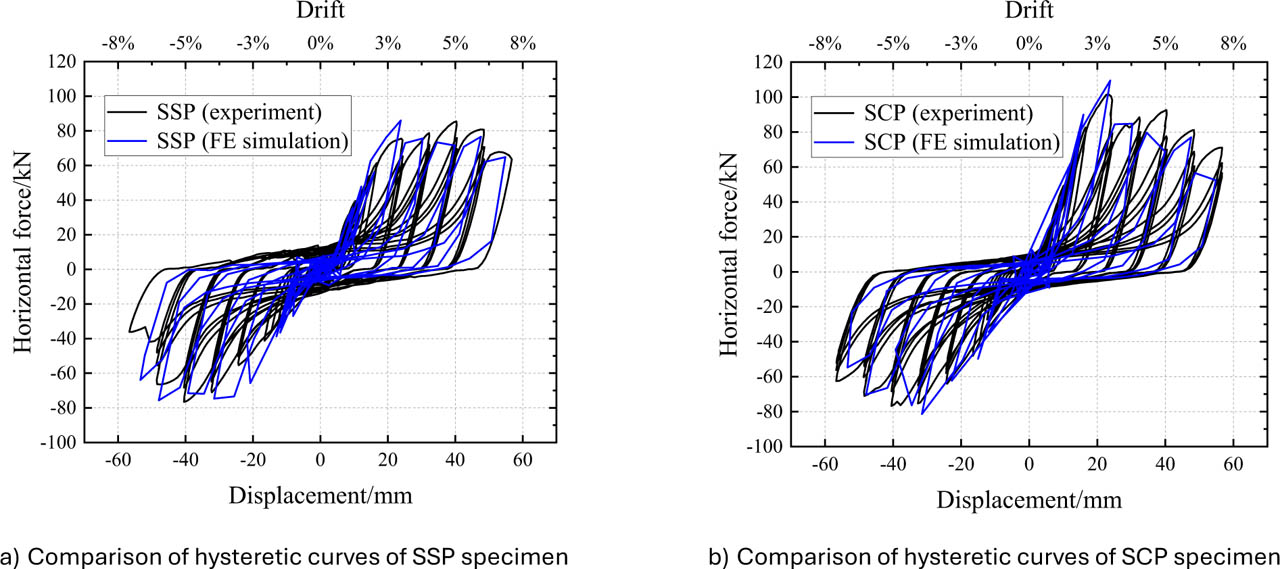
Figure 15:
Comparison of test and finite element analysis results
To assess the accuracy of the calculation approach for the critical buckling load of the FRP–steel strip, numerical analysis models were established. The “Tie” command was used to connect the steel plate and the CFRP laminate (Hashin, 1980). Displacement was applied to the top of the strip so that the top of the strip would move along the U1 orientation. Constraints were applied so that the top of the strip was free to move in the U3 direction but could not move in the U2 direction or rotate. The S4R element, which is a four-node shell element with linear shape function and reduced integral, was adopted for the simulation of the steel plate and the CFRP laminate. The length of the grid was 5 mm. The buckling behaviour of the plate was simulated by applying linear perturbation analysis. The boundary conditions of the flexural link in the numerical model are illustrated in Figure 16.
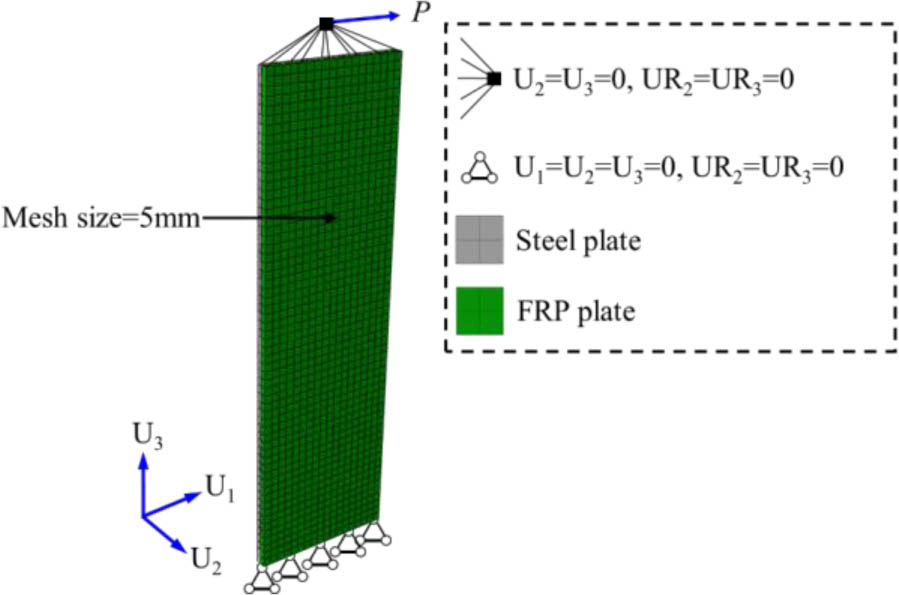
Figure 16:
Boundary conditions
The critical buckling loads of the flexural link obtained from the test and the finite element (FE) analysis are listed in Table 4. The deviation between the FE analysis results and the test results is relatively small. This indicates the reliability of the FE model in predicting the critical buckling load of the flexural link.
5.4. Numerical Analysis
To further investigate the accuracy of this theoretical method, an FE analysis was carried out. The FE model analysis allows a comprehensive study of how different geometric and reinforcement factors affect the lateral torsional buckling behaviour of the plates. The lateral–torsional buckling behaviour of plates with different aspect ratios and height–to–thickness ratios was investigated. The main parameters of the FE model are presented in Table 5. The SPAR models are steel plates with different aspect ratios, while the SPWT models are steel plates with different height–to–thickness ratios. Additionally, the CSPA2 and CSPW2 models are steel plates strengthened with 2 layers of CFRP. Each layer of CFRP has a thickness of 0.7 mm.
Table 5:
Main parameters of the numerical models
| Model | Type of plates | Width [mm] | Aspect ratio [α] | Width-to-thickness ratio of steel plate [η] |
|---|---|---|---|---|
| SPARs | Steel plate | 90 | 4, 5, 6, 7 | 15 (tsteel=6 mm) |
| SPWTs | Steel plate | 90 | 5 (height =450 mm) | 10, 11, 12, 13……20 |
| CSPA2s | CFRP (2 layers)–steel plate | 90 | 4, 5, 6, 7 | 15 (tsteel=6 mm; tFRP=0.7×2 mm) |
| CSPW2s | CFRP (2 layers)–steel plate | 90 | 5 (height =450 mm) | 10, 11, 12, 13……20 |
The typical buckling modes of the plates are shown in Figure 17. When subjected to in-plane horizontal loads, the plates with different aspect ratios all exhibited a lateral-torsional buckling mode. In this mode, the top and bottom ends of the plates rotated in the same direction. This finding is in good agreement with the experimental results.
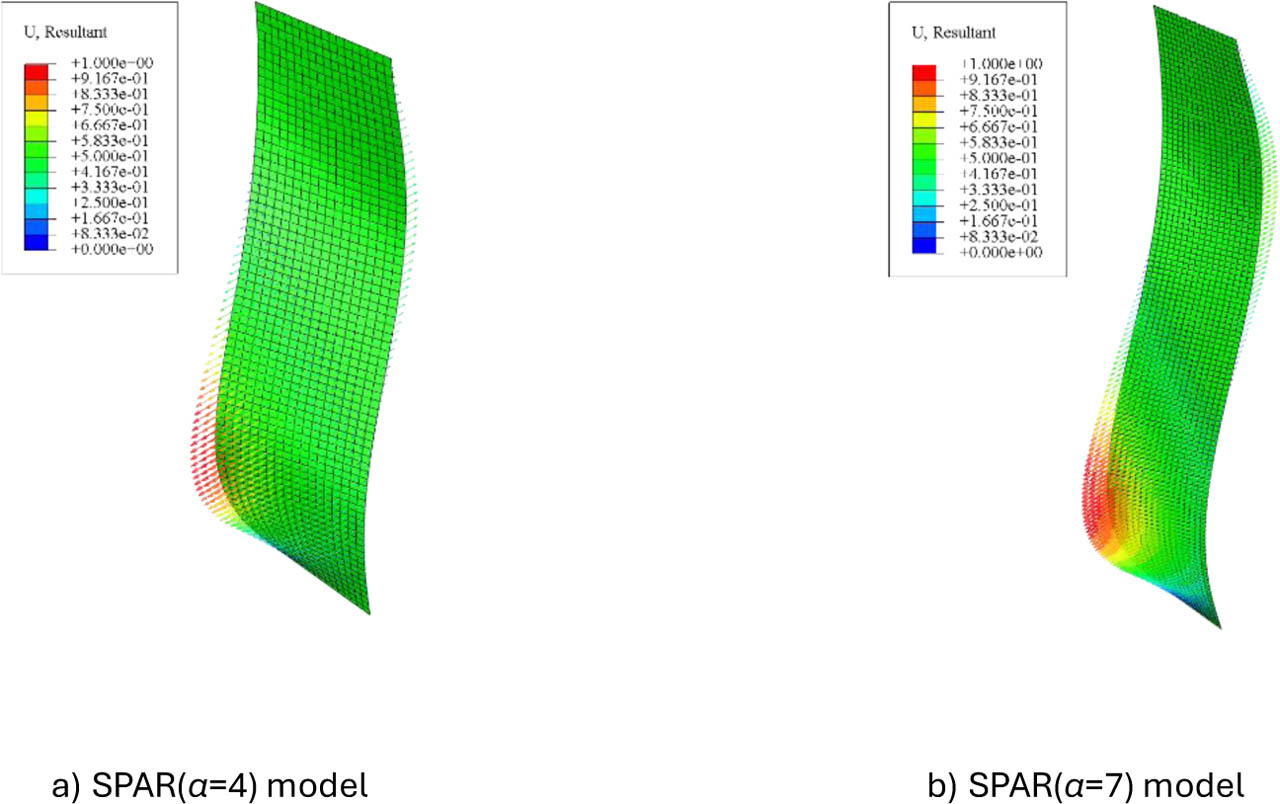
Figure 17:
Typical buckling modes
The critical buckling strengths of the SPAR and SPWT models are shown in Figure 18. As the width–to–thickness ratio and aspect ratio are varied, this theoretical calculation method can accurately predict the critical buckling load of the steel plate. The deviation between the theoretical results and the FE results was less than 10%. Notably, the theoretical results are slightly lower than the FE analysis results. This indicates that using this theoretical calculation method in the design process is a conservative and safe approach.
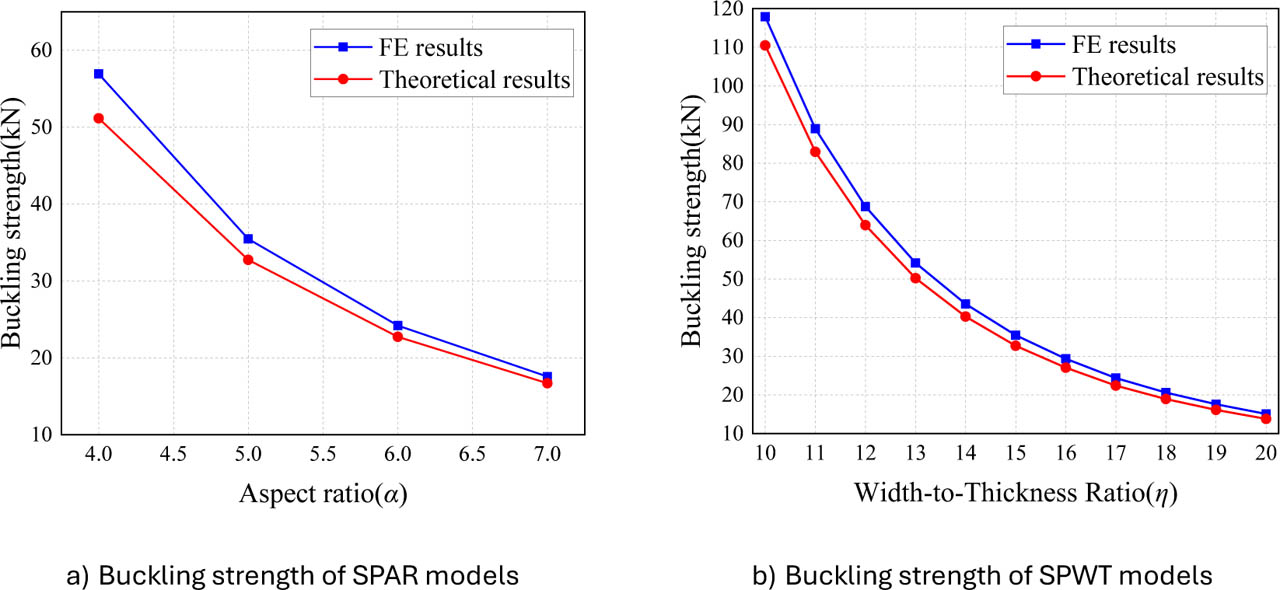
Figure 18:
Buckling strength of steel plates
For the CSPA2 and CSPW2 models (Figure 19), the maximum deviation between the theoretical and FE results was found to be less than 12%, indicating that the theoretical method maintained a high level of accuracy. The theoretical approach proposed in this paper is effective for CFRP-reinforced slit steel plate shear walls. When the CFRP-reinforced steel plates were set with different aspect ratios, the critical buckling strengths obtained from the theoretical calculation method were lower than the critical buckling strengths obtained from the FE method. When the width-to-thickness ratio of the flexural link was less than 12, the theoretical results were slightly higher than the FE results. These insights into the theoretical method under different geometric conditions offer guidance for its practical application in the design and analysis of CFRP-reinforced structural components.
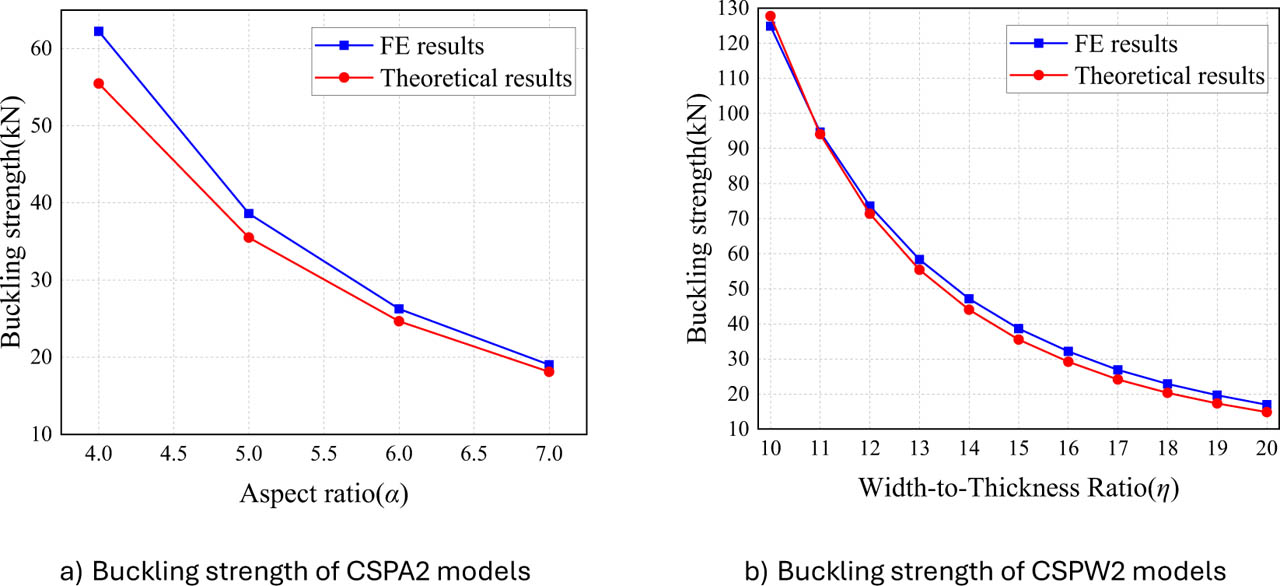
Figure 19:
Buckling strength of steel plates strengthened with CFRP
6. Conclusion
Experimental and FE analysis were carried out to investigate the load-bearing capacity and out-of-plane stiffness of slit steel plate shear walls strengthened with CFRP. The study provides guidance for the practical application of CFRP in the reinforcement of slit steel plate shear walls and provides some instructive conclusions concerning the lateral-torsional buckling of the CFRP-reinforced steel plates. The conclusions are as follows.
(1) When subjected to the horizontal reciprocating load, the crack development within the CFRP–reinforced slit steel plate was remarkably less extensive compared to that of the specimen without reinforcement. The CFRP underwent severe fracture damage, indicating that the mechanical properties of the CFRP were fully utilized. The CFRP effectively protected the steel plate.
(2) The test results showed that the stiffness of the slit steel plate shear wall strengthened with CFRP was increased by about 22% under the horizontal load. The ultimate strength was also increased by 18.8%. Notably, the energy dissipation capacity of the strengthened specimen remained relatively stable, showing minimal variation. This phenomenon can be primarily attributed to the fact that CFRP, being a linear elastic material, lacks the ability to efficiently absorb and dissipate energy during the loading process.
(3) The critical buckling load for lateral-torsional buckling of the flexural link strengthened with CFRP was increased by 151.4%. It was only when significant torsional deformation occurred within the flexural link that the CFRP exhibited debonding. This observation indicates the good cooperative performance between the CFRP and the flexural link. CFRP is highly effective in enhancing the out-of-plane stiffness of the flexural link. And it has high potential for improving the stability of steel structures.
(4) The theoretical method proposed in this study demonstrated high accuracy in predicting the critical buckling strength of CFRP-strengthened flexural links. As the aspect ratios and width-to-thickness ratios varied, the critical buckling strength of the CFRP-strengthened steel plates predicted by the theoretical method showed a maximum deviation of 12% from the actual value. Notably, the theoretical results were slightly lower than those of the FE analysis results, indicating that applying this theoretical calculation method in the design process is a conservative and safe approach.
This study has limitations: only one CFRP layup and steel grade were tested; quasi-static 1:4 scale tests lacked dynamic/full-scale validation and durability assessment. Future work should examine varied parameters, dynamic loading, and field validation. Practically, the CFRP method offers lightweight retrofitting, the theoretical model provides a conservative design tool, and the FE approach applies to similar composite structures.
Acknowledgements
This study is supported by the Scientific Research Fund of Institute of Engineering Mechanics, China Earthquake Administration (Grant No. 2023D42); the National Natural Science Foundation of China under Grant No. 52308207; and the Sichuan Science and Technology Program under Grant No. 2026NSFSC1293.
Notes
[1] Contributed by Author Contributions
Y.D. designed the study and supervised the project. M.Z. and N.W. conducted the experiments. T.L. performed the data analysis. W.B. contributed to manuscript writing. All authors critically reviewed and approved the final version of the manuscript and agreed to be accountable for all aspects of the work.