

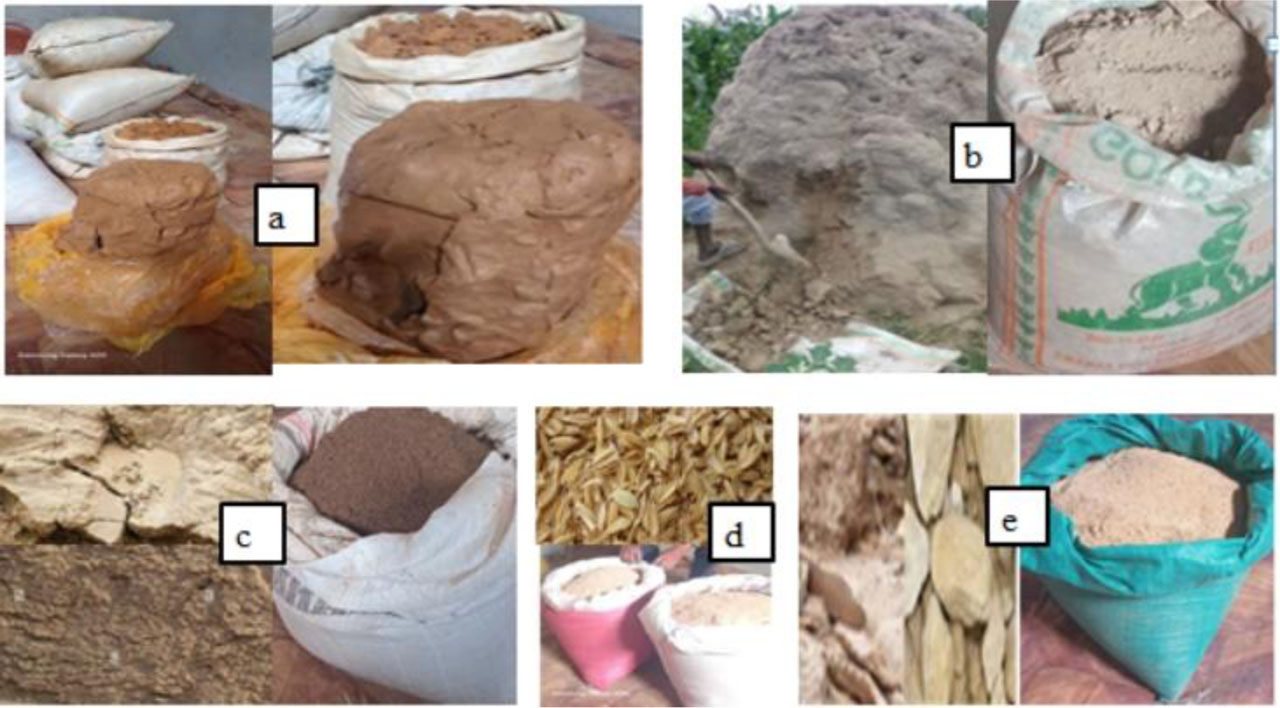
Figure 1:
Raw materials; (a) clay, (b) termite mound soil, (c) river sand (d) rice husk, and (e) lime
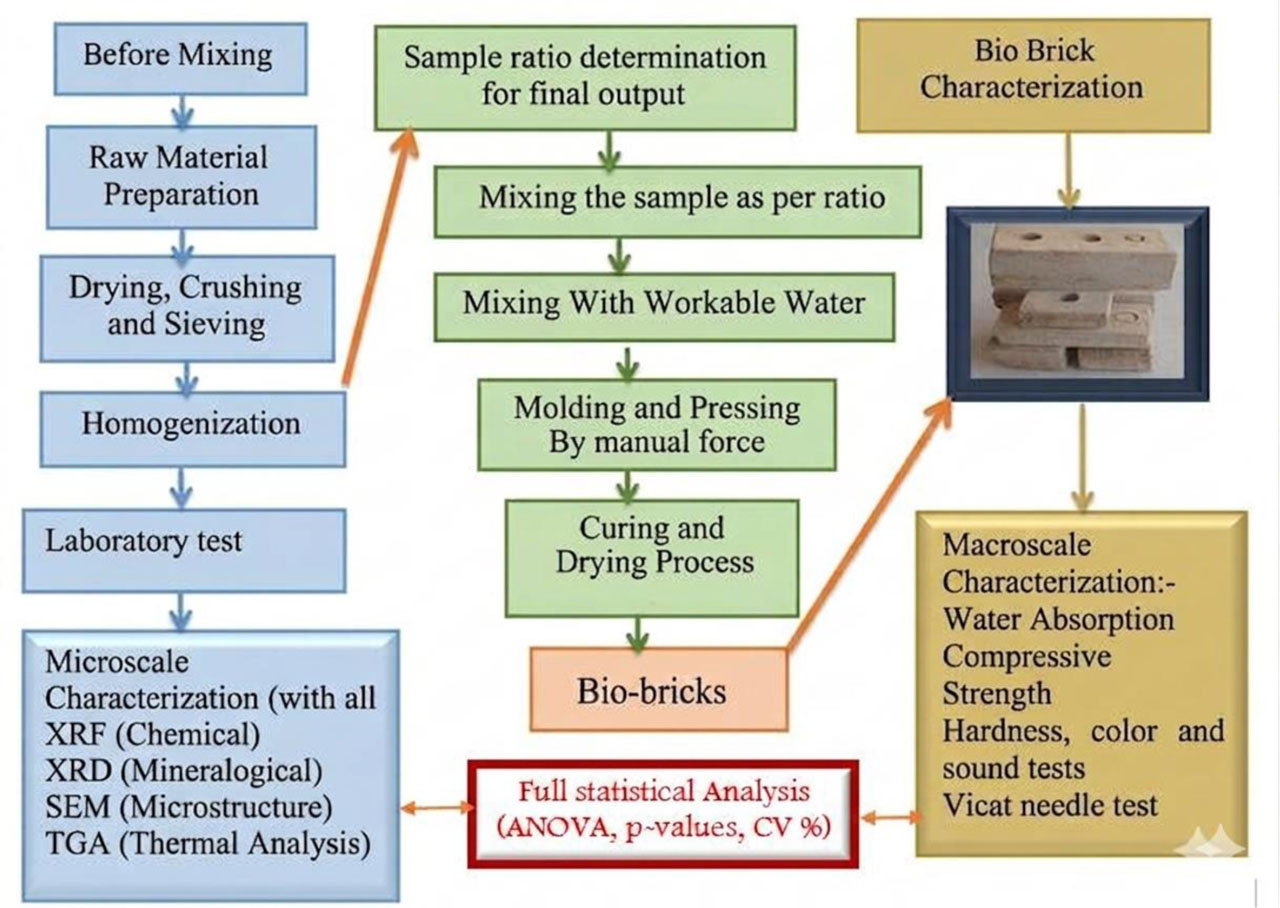
Figure 2:
General methodological process and characterization techniques
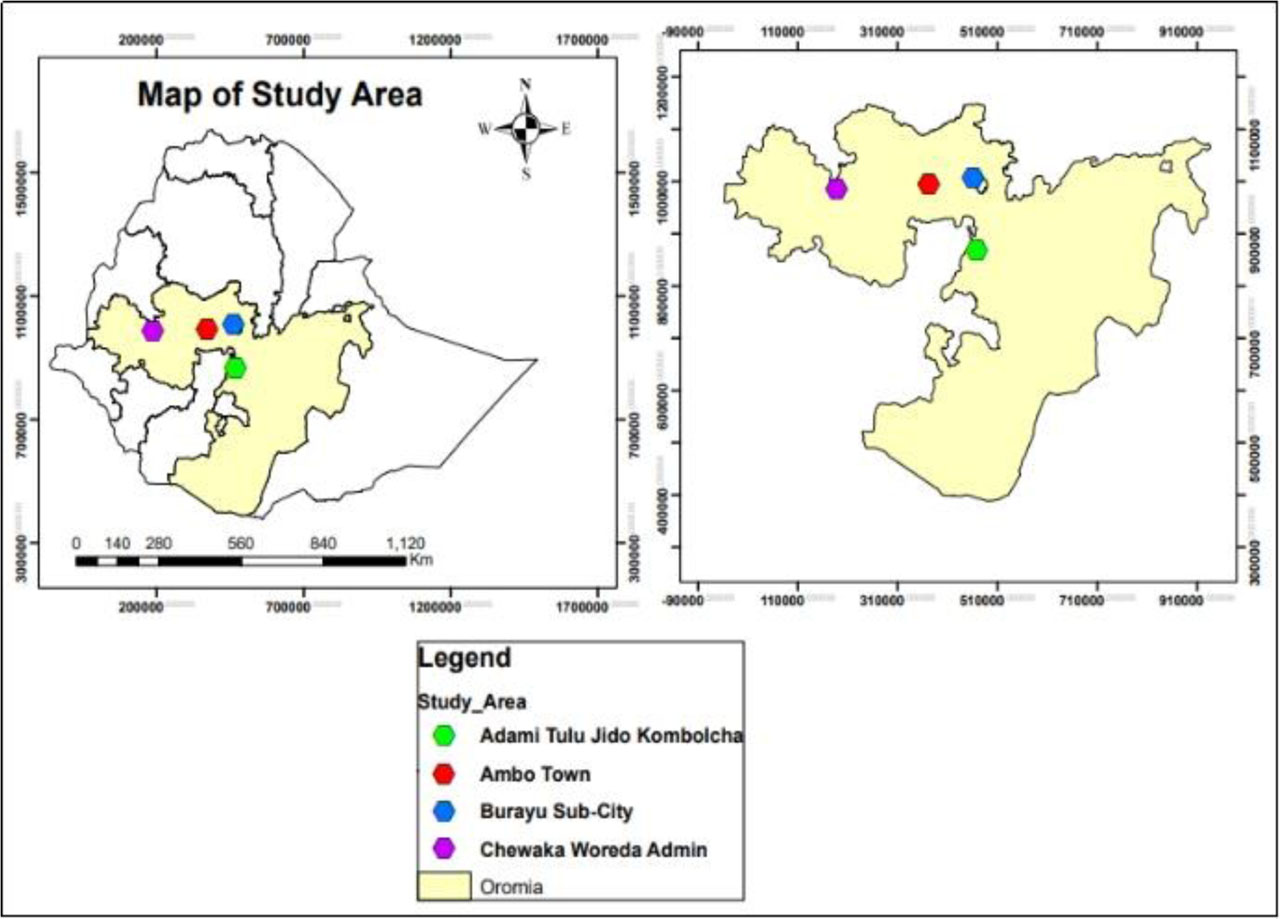
Figure 3:
Location Maps of the study area
Table 1:
Particle Size Distribution of Raw Materials Used for Sustainable Brick Production
| Material | Passing No. 200 Sieve (0.075 mm) [%] | Passing No. 270 Sieve (0.053 mm) [%] |
|---|---|---|
| Clay | 85 | 75 |
| Lime | 68 | 60 |
| Termite Mound Soil (TMS) | 65 | 52 |
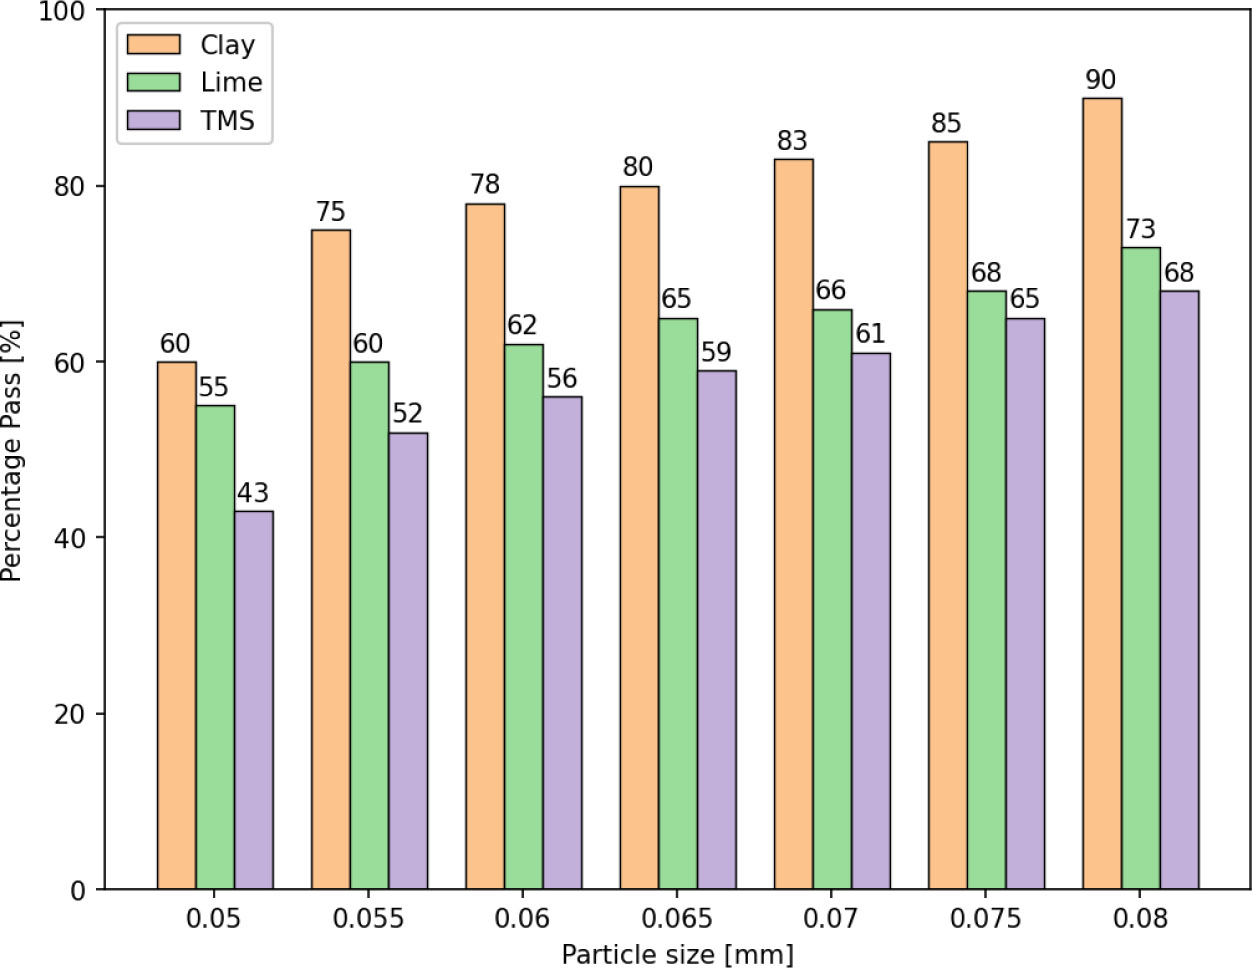
Figure 4:
Particle size distribution of clay, lime, and termite mound soil (TMS) showing the percentage passing at different sieve sizes
Table 2:
Effect of Lime and TMS on Curing Performance of Selected Brick Samples
| Sampe | Lime [%] | TMS [%] | 28-Day Compressive Strength [MPa] | Setting Time [h] |
|---|---|---|---|---|
| S1-1 | 0 | 20 | 5.00 | 39.8 |
| S1-5 | 20 | 0 | 5.20 | 28.5 |
| S2-3 | 18 | 0 | 7.15 | 25.4 |
| S2-4 | 0 | 18 | 5.70 | 35.3 |
| S2-1 (Optimum) | 12 | 6 | 7.56 | 24.0 |
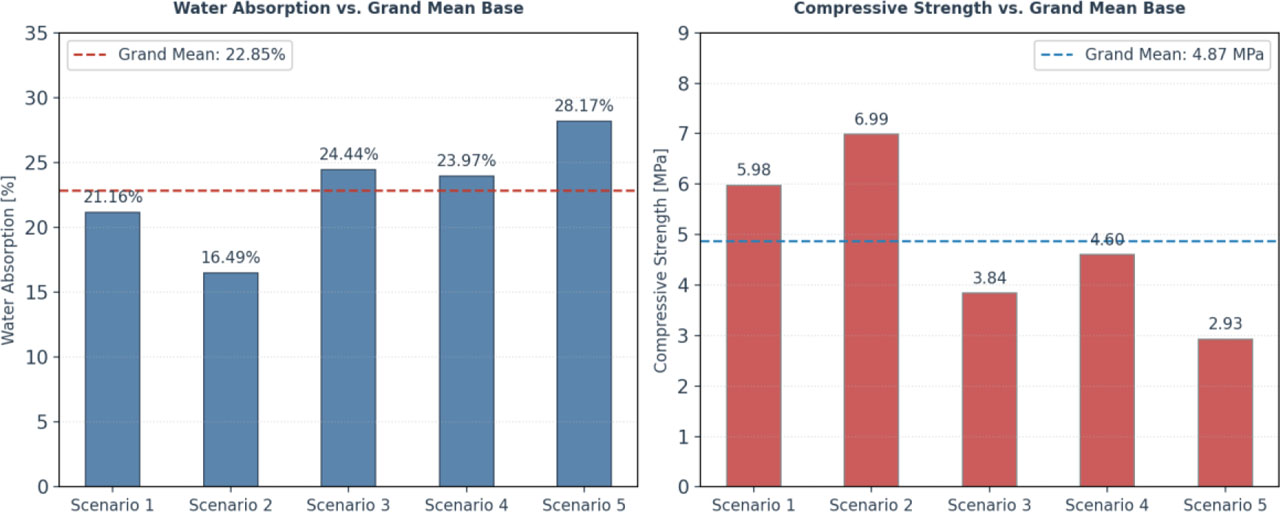
Figure 5:
Comparison of water absorption and compressive strength of the five bio-brick scenarios relative to the grand mean values
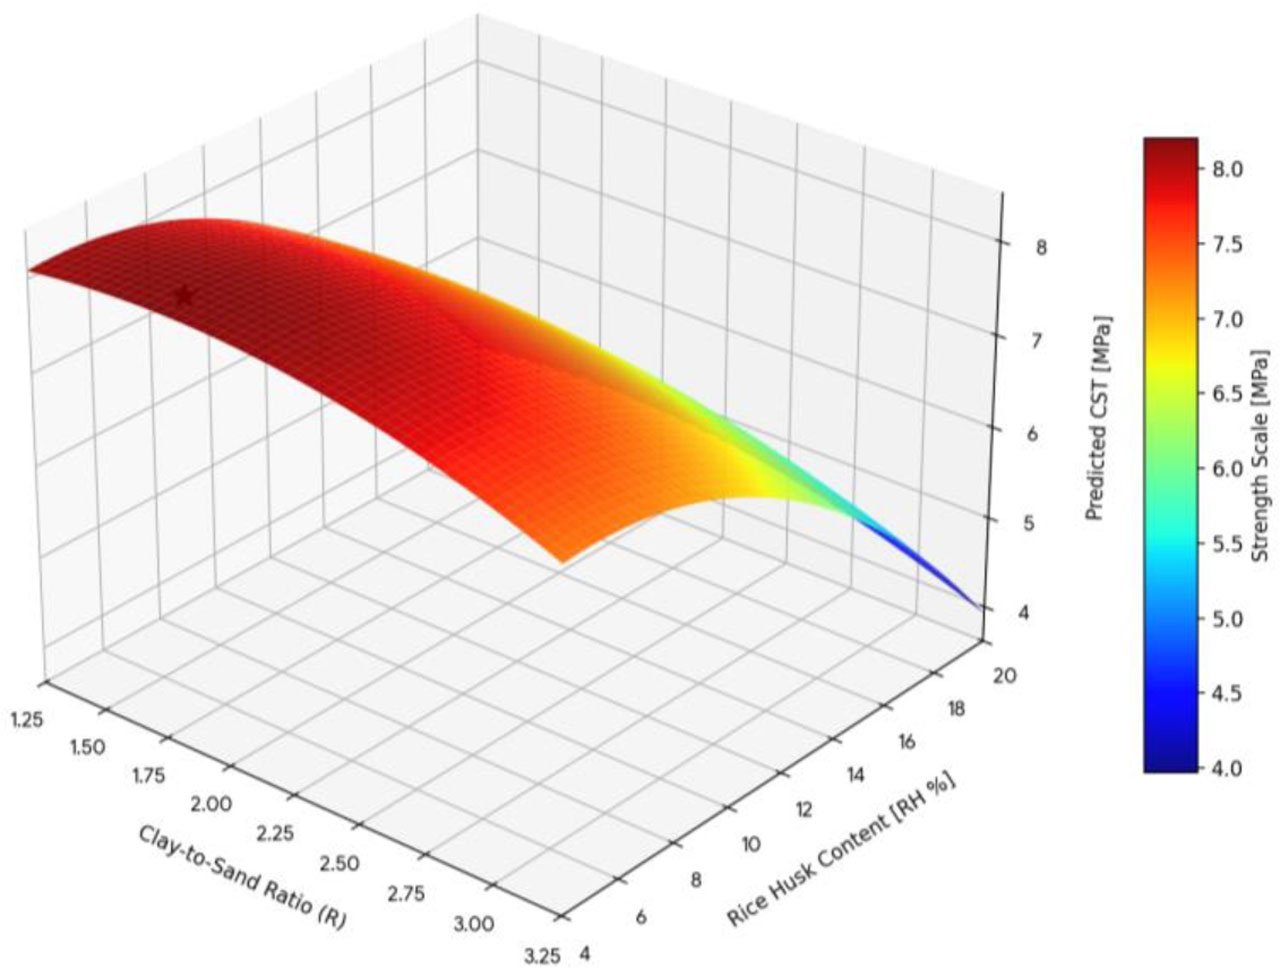
Figure 6:
Response surface plot showing the predicted compressive strength (CST) of bio-bricks as a function of the clay-to-sand ratio (R) and rice husk (RH) content
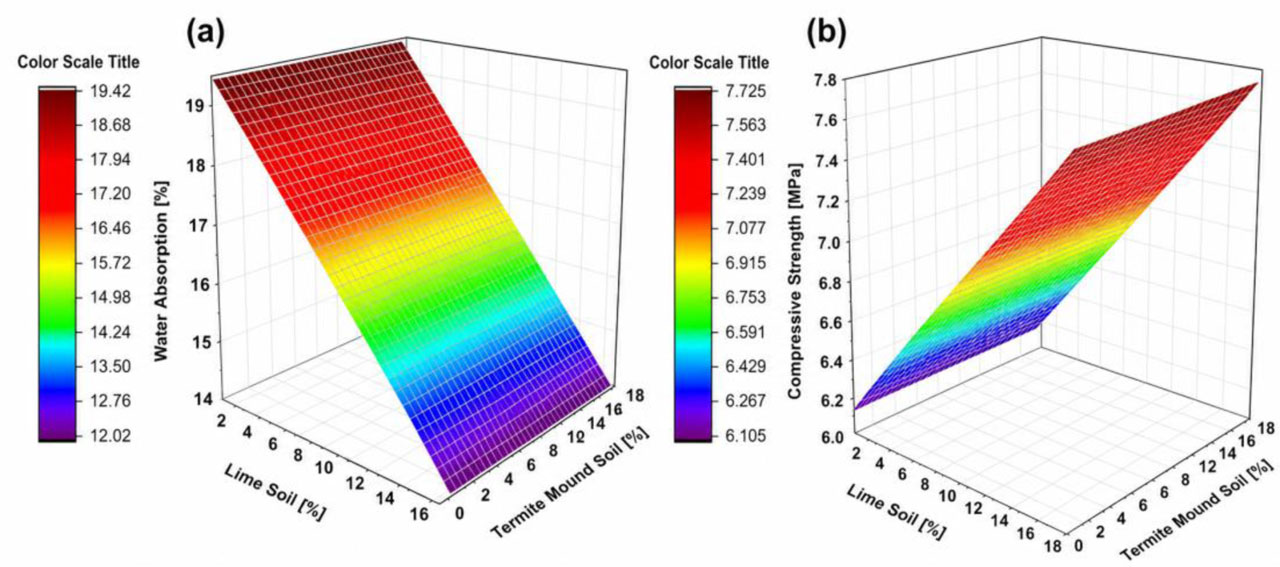
Figure 7:
Response surface plots showing the influence of lime and termite mound soil (TMS) contents on the performance of the developed bio-bricks: (a) predicted water absorption (%) and (b) predicted compressive strength (MPa)
Table 3:
Statistical assessment of the developed bio-bricks based on five scenarios with respect to water absorption and compressive strength with their means, standard deviations (SD), and coefficient of variation (CV). Scenario 2 proved to be the most efficient in terms of both minimum water absorption (16.49 ± 1.93%) and maximum compressive strength (6.99 ± 0.56 MPa)
| Structural Property | Evaluation Metric | Scenario 1 | Scenario 2 | Scenario 3 | Scenario 4 | Scenario 5 |
|---|---|---|---|---|---|---|
| Water Absorption (AVGWA) [%] | Column mean (Xj) | 21.16 | 16.49 | 24.44 | 23.97 | 28.17 |
| Standard Deviation (SD) [-] | 2.14 | 1.93 | 2.30 | 1.95 | 2.00 | |
| Relative Variation (CV) [%] | 10.11 | 11.71 | 9.40 | 8.12 | 7.10 | |
| Compressive Strength (AVGCST) [MPa] | Column Mean(Xj) | 0.98 | 6.99 | 3.84 | 4.60 | 2.93 |
| Standard Deviation (SD) [-] | 0.81 | 0.56 | 0.79 | 0.28 | 0.45 | |
| Relative Variation (CV) [%] | 13.61 | 7.99 | 20.61 | 5.99 | 15.44 |
Table 4:
Comprehensive overview of the mathematical fitness, significance testing, and regression diagnostics for the boundary models of water absorption and compressive strength
| Modeled Target Boundary Property | Model Fit (R2) [%] | Adjusted Fit (Rad) [%] | Predicted Fit (R2pre) [%] | Regression Error (S) [%] or [MPa] | Standard Regression ANOVA Status [-] | Maximum Standard Residual |
|---|---|---|---|---|---|---|
| Water Absorption (WA) | 65.38 | 61.20 | 56.40 | ± 1.201 | F = 12.35 P = 0.011 | +1.98 |
| Compressive Strength (CSt) | 71.53 | 67.46 | 62.36 | ±0.318 | F = 17.59 P = 0.004 | −2.36 |
Table 5:
Experimental matrix of the mixture design optimization under Scenario 2 and associated engineering response variables versus control traditional bricks
| Scenario | Experimental Variable | Response Variable | |||||
|---|---|---|---|---|---|---|---|
| Clay [%] | Sand [%] | Rice [%] | Lime [%] | Termite mound [%] | Water absorption [%] | Compression [MPa] | |
| Traditional Bricks | 100 | 0 | 0 | 0 | 0 | 18 | 6.5 |
| Scenario 2 | S2-1 | 45 | 22 | 12 | 6 | 14.15 | 7.56 |
| S2-2 | 45 | 22 | 8 | 10 | 16.7 | 6.9 | |
| S2-3 | 45 | 22 | 18 | 0 | 16 | 7.15 | |
| S2-4 | 45 | 22 | 0 | 18 | 21 | 5.7 | |
| S2-5 | 45 | 22 | 10 | 8 | 16.25 | 7.1 | |
| S2-6 | 45 | 22 | 14 | 4 | 15.32 | 7.4 | |
| S2-7 | 45 | 22 | 6 | 12 | 17 | 6.73 | |
| S2-8 | 45 | 22 | 13 | 5 | 15.12 | 7.45 | |
| S2-9 | 45 | 22 | 7 | 11 | 16.87 | 6.88 | |
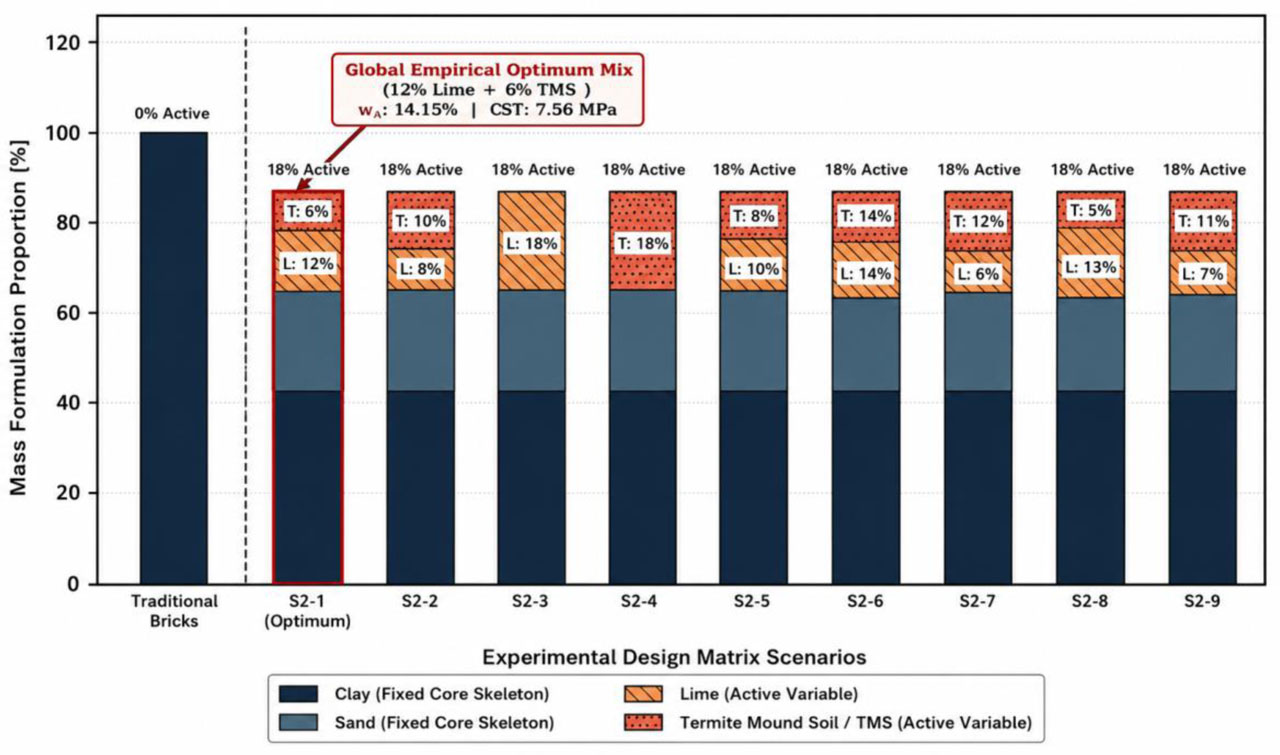
Figure 8:
Complete mass formulation proportion mapping alignment fixed core skeletal framework vs. Active variable stabilizer dosage
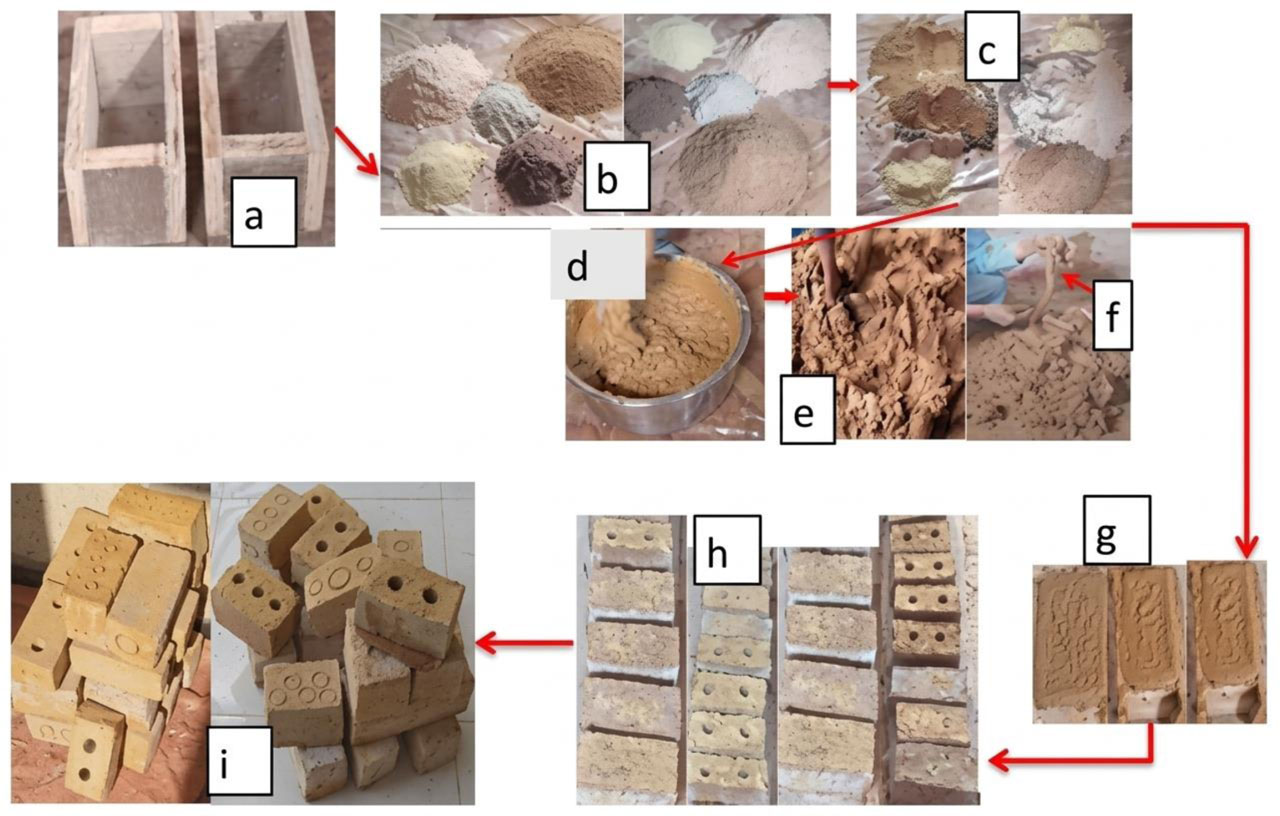
Figure 9:
Step-by-step bio-brick manufacturing, molding, and curing process. (a) Form working; (b) weighted mix ratio; (c) blending mix ratio; (d) hand-kneading; (e) foot-treading after fermentation period; (f) verification of blend plasticity and structural integrity; (g) molding; (h) demolding and 7-day ambient air curing; (i) direct solar curing process
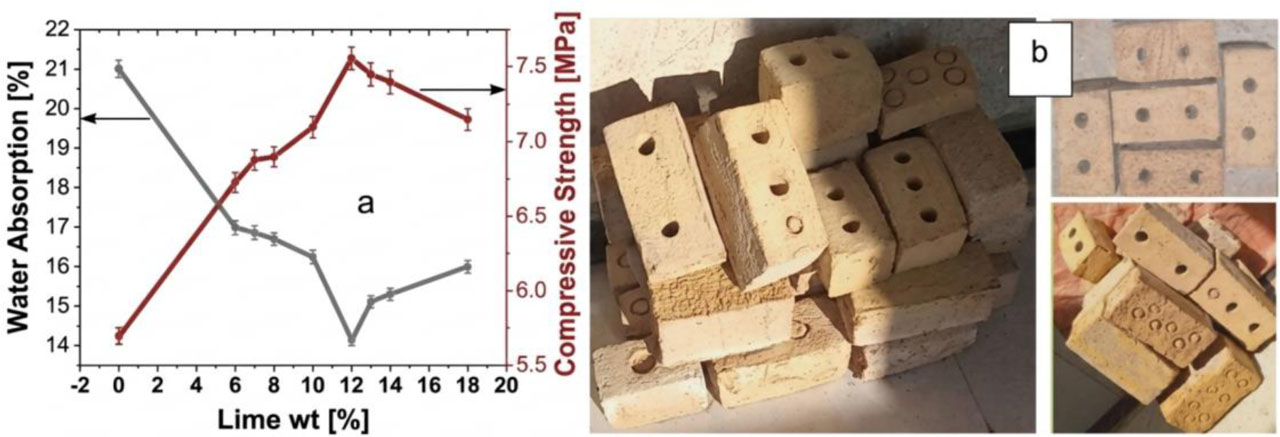
Figure 10:
Optimal mixture design and performance characteristics of optimized s2:1 bio-bricks
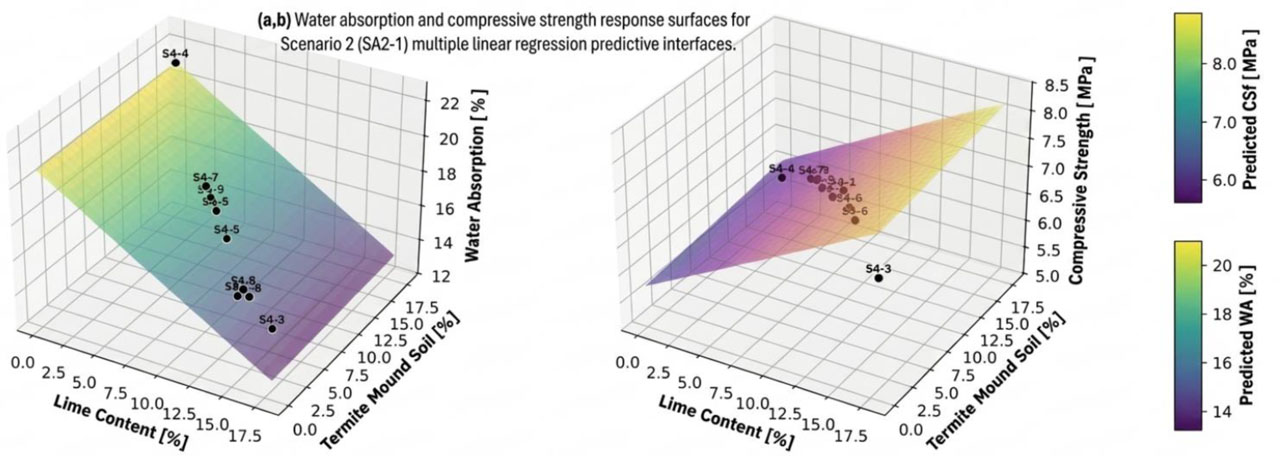
Figure 11:
Scenario 2 (SA2-1) Multiple linear Regression predictive interfaces for simultaneous behavior mapping of active variable additives against material engineering criteria: (a) Water absorption response surface (Model R2=65.38%, P=0.011) and (b) compressive strength response surface (Model R2=71.53%, P=0.004)
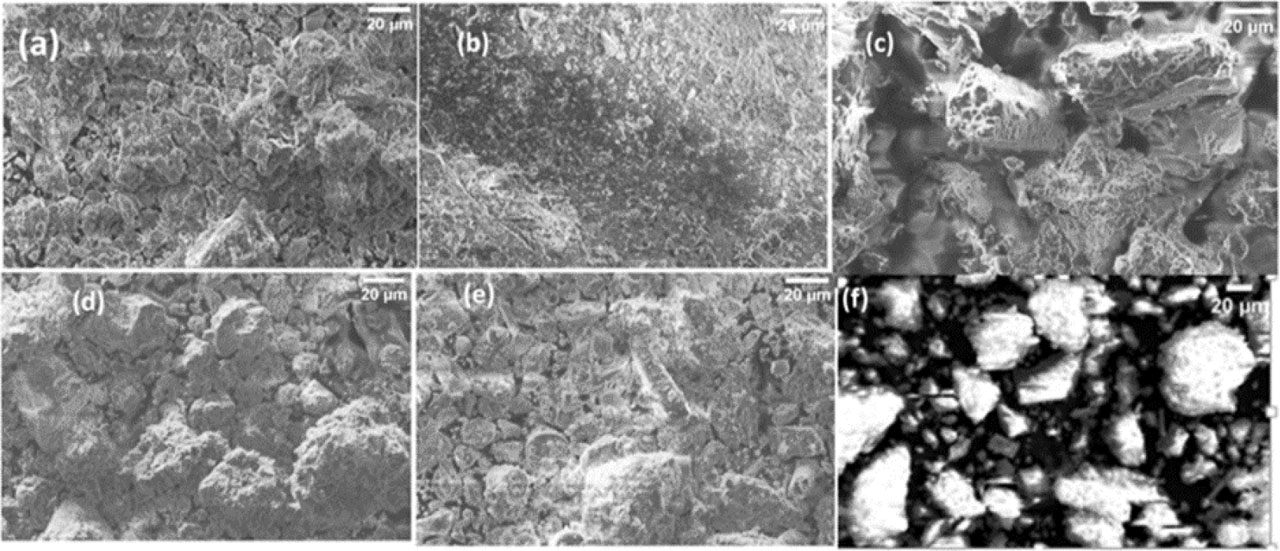
Figure 12:
Scanning electron microscopy (SEM) micrographs illustrating the microstructural morphology of raw materials and the final composite: (a) clay, (b) sand, (c) rice husk, (d) lime, (e) termite mound soil (TMS), and (f) the optimized blend mixture
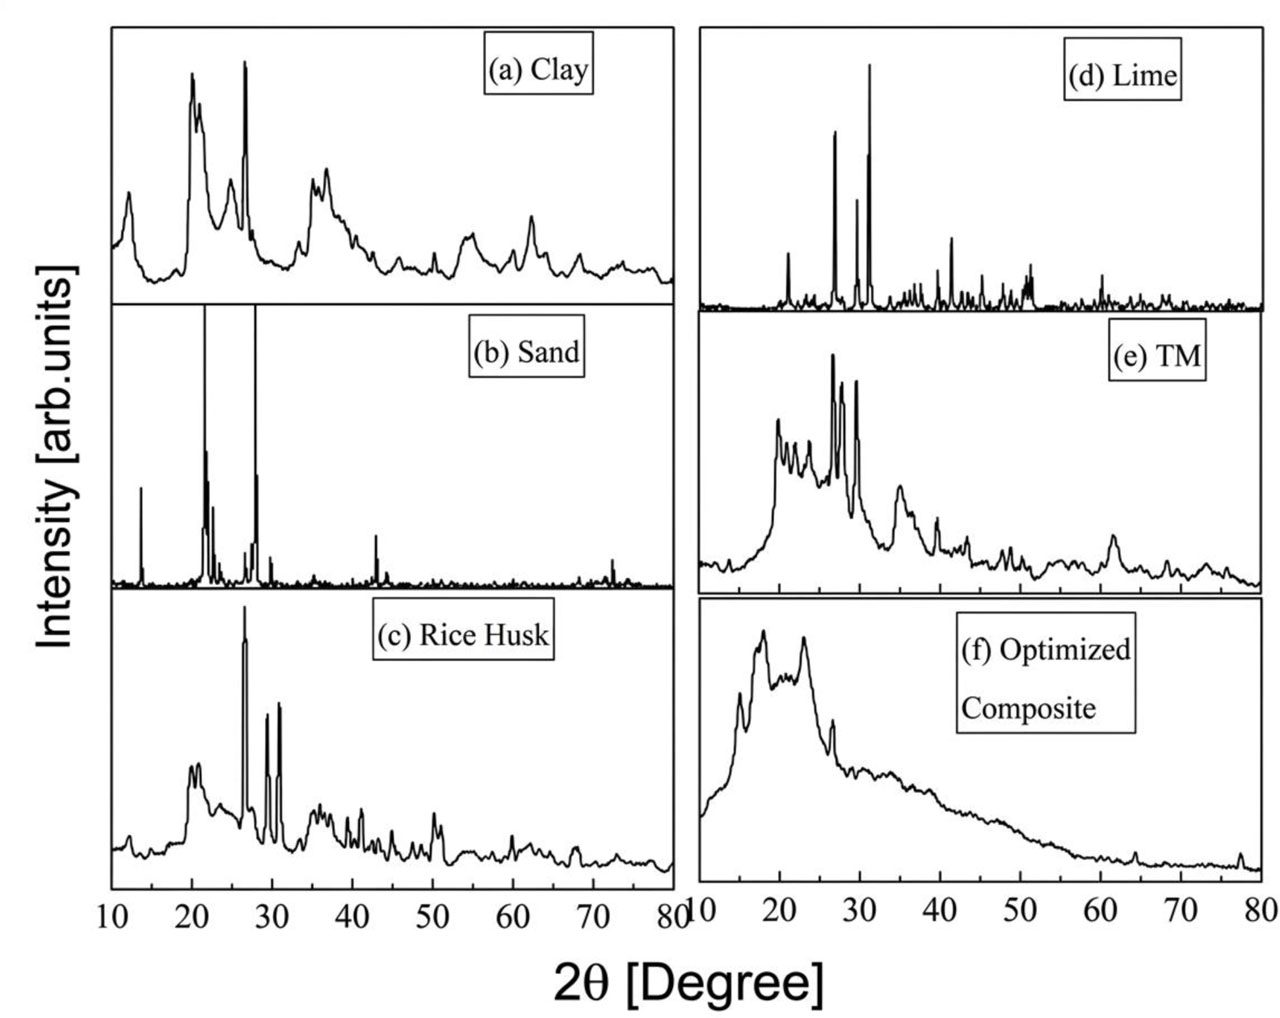
Figure 13:
XRD patterns of (a) clay, (b) sand, (c) rice husk, (d) lime, (e) termite mound soil (TMS), and (f) the optimized composite
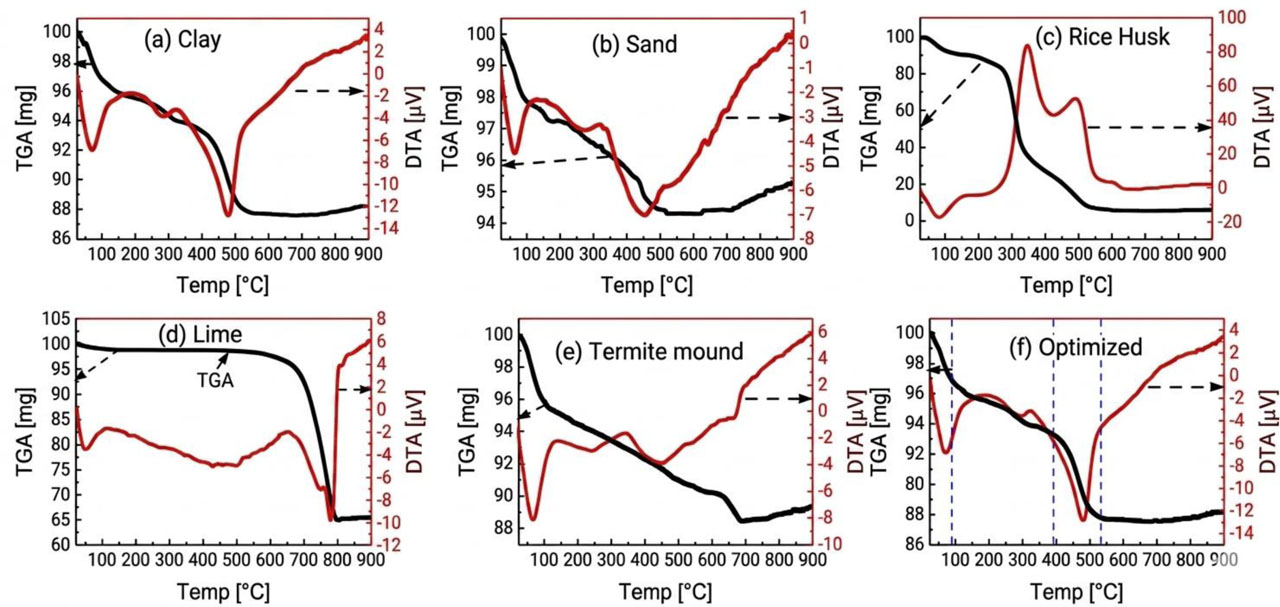
Figure 14:
(a) TGA for clay soil, (b) TGA for sand soil, (c), TGA for sun dried powder lime, (d) TGA for termite mound soil (e) TGA for sun dried powder rice husk and (f) TGA of optimized blend
Table 6:
Global warming potential (GWP) analysis of traditional bricks and Sustainable bricks
| Parameter | Traditional Bricks (GWP) | Sustainable-bricks (GWP) |
|---|---|---|
| Curing Method | Standardized solar curing | Kiln firing |
| Extraction & Preparation emission [kg CO2-eq] | 150 | 14 |
| Manufacturing emission [kg CO2-eq] | 450 | 0 |
| Transportation emission [kg CO2-eq] | 50 | 17.5 |
| End-of-Life biodegradability [kg CO2-eq] | 30 | 0 |
| Firing Temperature [°C] | 900–1100 | Not required |
| Total emission [kg CO2-eq] per [ton] | 680 | 31.5 |
| Carbon Reduction [%] | - | 95 |