

1. Introduction
The construction sector is responsible for a huge portion of global carbon emissions. Recent studies estimate that the building and construction industry is responsible for about 37% of global CO2 emissions from energy use (Report, 2024; Status & Report, 2023). Cement alone makes up around 7–8% of yearly CO2 output—a significant figure (Gbadeyan et al., 2023). The process of producing one ton of cement emits around 900 to 1000 kg of CO2 due to the energy required to burn limestone (Alshalif et al., 2021; Nath et al., 2018). Similarly, traditional fired clay bricks need to be heated at temperatures ranging from 900 to 1100°C, leading to the consumption of high amounts of energy and natural clay sources (Bhat et al., 2014; James et al., 2023; Malkanthi et al., 2020).
As a result, there’s a growing search for more eco-friendly construction methods and materials. The demand for sustainable materials is stronger than ever, however, bio-bricks still haven’t gained much traction. Many challenges remain, particularly regarding the manufacturing processes and ingredient compositions of bio-bricks. Currently, bio-bricks rely heavily on organic components, which often make them less durable under pressure and more prone to water absorption compared to traditional bricks. Another challenge is the lack of widely accepted standards for testing and performance evaluation. Unsurprisingly, this makes manufacturers and builder’s cautious. The urgent need for environmentally friendly building solutions has highlighted the promise of bio-bricks, but deficiencies in testing, production methods, and material selection continue to hinder their broad acceptance (Naveen et al., 2020; Rautray et al., 2023). The study acknowledges that merely adopting organic materials is not sufficient instead, it advocates for thorough testing procedures, targeted incorporation of inorganic elements like lime or termite mound soil, and the development of dependable standards. Further, there was a deficiency of comparative studies that evaluating bio-bricks with traditional bricks or other alternative construction materials, which raises enquire about their mechanical performance and sustainability (Manoharan & Umarani, 2022; Rautray et al., 2023). Addressing these key gaps is an important to optimize bio-bricks fabrication process and found their viability as eco-friendly construction materials. This study addresses those challenges and specifically examines bio-bricks produced in Ethiopia, using only locally sourced materials: clay, sand, termite mound soil, rice husk, and lime. The aim here is straightforward: find a way to create bio-bricks from these materials that are durable, resist absorbing water, and are affordable.
The challenge was to get them to match standard hollow concrete blocks. We’re changing our building methods by using bio-bricks, reducing cement use, and aiming for zero-carbon construction. This not only lessens our dependence on non-renewable resources, it also generates manufacturing jobs, strengthens local economies by sourcing materials regionally, and promotes more sustainable building practices.
2. Methodology
2.1. Research Design
The study employs a mixed-methods research design to evaluate and optimize the properties and performance of bio-bricks composed of clay, sand, lime, termite mound soil (TMS), and rice husk (RH). This design integrates both experimental and observational approaches to ensure comprehensive analysis. The experimental component utilizes a Design of Experiments (DOE) framework, specifically a 32 factorial design matrix, to systematically investigate the effects of varying proportions of lime and TMS on key mechanical properties such as compressive strength and moisture absorption. By controlling these variables across multiple experimental scenarios, the study aims to optimize material formulations with precision.
In parallel, observational methods are employed through advanced characterization techniques such as Thermogravimetric Analysis (TGA), Scanning Electron Microscopy (SEM), and X-Ray Diffraction (XRD). These techniques provide detailed insights into the structural, thermal, morphological, and crystalline properties of the materials without altering their composition. Furthermore, standardized testing methods—including moisture content was analyzed following ASTM D2216, while densities were determined using ASTM D7263 and ASTM D698 protocols. The specific gravity of both the individual materials and the composite bio-bricks was evaluated as per ASTM D854. Furthermore, Atterberg limits, including liquid limit, plastic limit, and plasticity index, were measured in accordance with ASTM D4318 standards (D2216-98, 2023a; Ferreira, Medeiros, et al., 2023; Soil & Rock, 2017; Suraneni et al., 2021).
The study also incorporated the Proctor test (ASTM D698), which provided critical data on maximum dry density (MDD) and optimum moisture content (OMC) (Rizal et al., 2022). These parameters were essential for verifying that the material blends conformed to strength requirements, ensuring their suitability for the intended applications. This comprehensive methodological approach underscores the rigor and precision employed in this study to achieve reliable and reproducible results (D2216-98, 2023a, 2023b; Ferreira, Medeiros, et al., 2023; Suraneni et al., 2021).
To ensure the reliability and robustness of the findings, a comprehensive analysis of variance (ANOVA) was conducted. This statistical analysis validates the results obtained from experimental and observational techniques, facilitating refinement of the material formulations. The combined use of DOE and laboratory testing, supported by ANOVA modeling, enhances both the performance and sustainability of the bio-bricks as innovative construction materials.
Mix design configuration focuses on establishing a fundamental understanding of how each individual constituent alters the final composite matrix. It provides the mathematical and analytical design required to model internal relationships, optimize raw material proportions, and guarantee targeted mechanical and physical properties. To establish a technical baseline, a control sample composed exclusively of 100% pure clay fired brick was tested as a reference representing traditional brick (TB). For the remaining formulations, statistical optimization of the biomaterial mixtures was executed using a formalized Design of Experiments (DOE) framework modeled with Response Surface Methodology (RSM). This analytical approach was highly effective for quantifying the exact physical impacts and multi-variable interactions of fixed baseline components and stabilizing additives on both compressive strength and moisture absorption metrics (Alshalif et al., 2021; Jaramillo et al., 2025). The experimental design adopted a 32 factorial design matrix tracking two independent additive variables—lime and termite mound soil (TMS)—across three distinct operational dosage levels: low, medium, and high. This variable configuration was systematically evaluated across 5 primary scenarios S1 to S5, executing exactly 9 experimental runs per scenario to yield a comprehensive matrix of 45 unique combinations. Within each distinct scenario, the primary baseline skeleton consisting of fixed ingredients—clay, sand, and rice husk (RH)—was maintained at a strict constant proportion to isolate the chemical effects of the variable additives:
Scenario 1: Fixed baseline held at 40% clay, 26% sand, and 14% rice husk by weight.
Scenario 2: Matrix adjusted to 45% clay, 22% sand, and 15% rice husk by weight.
Scenario 3: Proportions set at 50% clay, 20% sand, and 20% rice husk by weight.
Scenario 4: Incremental shifts to 60% clay, 24% sand, and 12% rice husk by weight.
Scenario 5: Matrix boundary raised to 70% clay, 20% sand, and 5% rice husk by weight.
The absolute matrix of these multi-variable formulations allowed for an exhaustive exploration of every possible raw material interaction influencing final product quality. Particular analytical focus was directed toward how the shifting balances of lime and TMS parameters affected structural integrity, with the ultimate objective of determining the mathematically optimal mix ratio for stronger and more dependable bio-bricks.
To validate structural viability and moisture durability, all 45 combinations were tested and evaluated against Indian and Ethiopian regulatory standard thresholds, which strictly dictate a maximum permissible water absorption limit of less than 20% (<20%)WA) (Indumathi et al., 2024). The comprehensive testing run profiles are thoroughly cataloged in Supplementary File 1 (S1).
2.1.1. Advanced Characterization Techniques
After testing physical and index properties moreover an advanced analytical instrumentation and characterization were deployed to identify underlying structural mechanisms and evaluate chemical transformations:
Thermogravimetric Analysis (TGA)
Thermogravimetric analysis (TGA) was performed on the bio-brick materials—clay, sand, rice husk, lime, termite mound soil, and optimized composites—using an SDT Q600 (TA Instruments) (Seyoum et al., 2021). For each measurement activities, we approximately utilized 10.171 mg of sample has been placed in a platinum crucible and heated from room temperature up to 900°C. The heating rate was set at 10°C per minute, with a constant airflow of 60 mL per minute maintained throughout the process. After the run, we processed the data using Universal Analysis 2000. The DTG curves revealed the peak decomposition temperatures for each material and composite, making it straightforward to compare thermal stability among all the ingredients and composites and to identify the temperatures at which each one decomposed most rapidly.
Morphological Analysis by Scanning Electron Microscopy (SEM)
Morphological analysis of microparticles was performed using Scanning Electron Microscopy (SEM), a sophisticated technique that employs a focused beam of electrons directed onto the sample surface. The interaction between the electron beam and the material generates various signals, which are subsequently analyzed to produce highly detailed images, providing critical insights into the physical and structural properties of the examined materials. In this study, a high-vacuum SEM (JEOL JSM 5910 LV) operating at an accelerating voltage of 15.0 kV was employed to investigate the morphology of silica nanoparticles. Sample preparation involved carefully mounting the nanoparticles onto copper stubs using carbon tape, followed by the deposition of a thin gold coating via sputter coating. The application of this conductive gold layer was essential for enhancing surface conductivity, thereby facilitating the acquisition of sharper and more precise images that revealed intricate structural features of the nanoparticles.
Structural Analysis by X-Ray Diffraction (XRD)
We investigated the crystalline structure and phase composition of the nanosilica with a RIGAKU MiniFlex II X-ray diffractometer at room temperature. The instrument used a Cu Kα radiation source (λ = 1.540562 Å), operated at 30 kV and 15 mA. Diffraction patterns were recorded over a 2θ range of 5° to 70°, with a step size of 0.02° per second.
Water Absorption Test
The methodology for the water absorption test, designed to evaluate the porosity, durability, and moisture resistance of sustainable bricks, adheres strictly to ASTM C67 standards. Initially, brick samples were subjected to oven-drying at a temperature of 110 ± 5°C until a constant dry weight (W1) was achieved, ensuring the removal of any residual moisture (Hershey et al., 2023; Poornima et al., 2021). Following this, the samples were allowed to cool to room temperature and then weighed. Subsequently, the bricks were fully immersed in water maintained at a temperature range of 15–30°C for a duration of 24 hours. After immersion, the samples were surface-dried to remove excess water and weighed again to determine the wet weight (W2). The water absorption percentage was calculated using the formula: Water Absorption (%) = ((W2 - W1) / W1) × 100. This quantitative analysis provides critical insights into the material properties of the bricks, contributing to their evaluation for sustainable construction applications.
Compressive Strength Test
Compression tests were conducted to evaluate the mechanical properties and load-bearing capacity of bricks using a Tecnotest compression testing machine. Samples that were well-cured and free of visible defects were carefully placed between the machine's loading platens. A gradually increasing load was applied until the point of failure was reached, as outlined in prior studies (Poornima et al., 2021). The compressive strength of the bricks was determined by dividing the maximum load at failure by the cross-sectional area of the sample. Quantitative data obtained from these tests were analyzed to assess the effects of varying lime content, TMS proportions, and curing conditions on brick performance. To monitor the long-term development of mechanical properties and ensure compliance with regulatory construction standards, the bricks were evaluated at curing intervals of 7, 14, and 28 days.
2.2. Materials and Procedures
The selected raw materials for this study, as illustrated in Figure 1, included clay, termite mound soil, river sand, rice husk, and lime. These materials were procured from four distinct regions within the Oromia administrative area: Adami Tulu Jido Kombolcha, Ambo Town, Burayu Sub-City, and Chewaka Woreda Administration. Each location was geo-referenced and documented to ensure traceability. The preparation process utilized accessible equipment such as weighing scales, particle sieving tools, mixing containers, manual crushers, and custom wooden molds with dimensions of 15 cm × 10 cm × 10 cm.
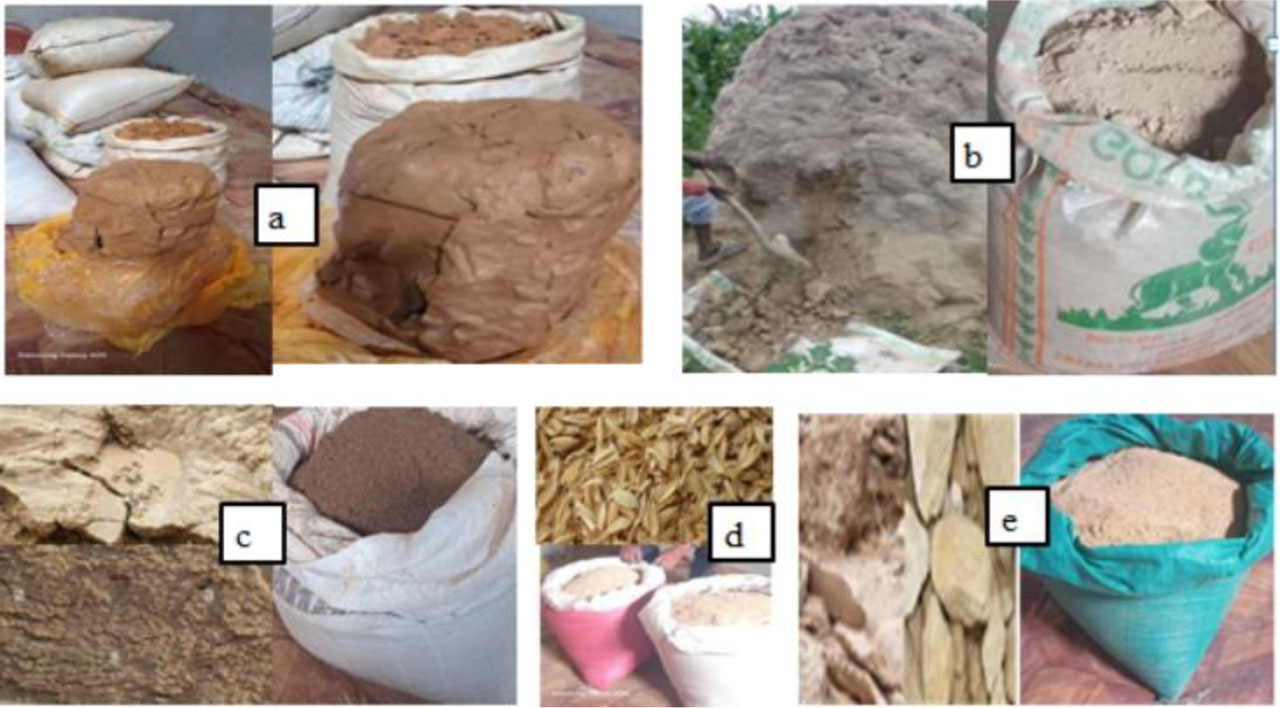
Figure 1:
Raw materials; (a) clay, (b) termite mound soil, (c) river sand (d) rice husk, and (e) lime
As depicted in Figure 2, the study utilized a methodological framework involving raw material preparation, drying, crushing, sieving, homogenization, and sample ratio determination. Laboratory microscale characterization employed techniques such as XRF, XRD, SEM, and TGA. Macroscale characterization included tests for water absorption, compressive strength, hardness, color and sound testing. This comprehensive approach offered crucial insights into developing sustainable and high-performance bio-bricks.
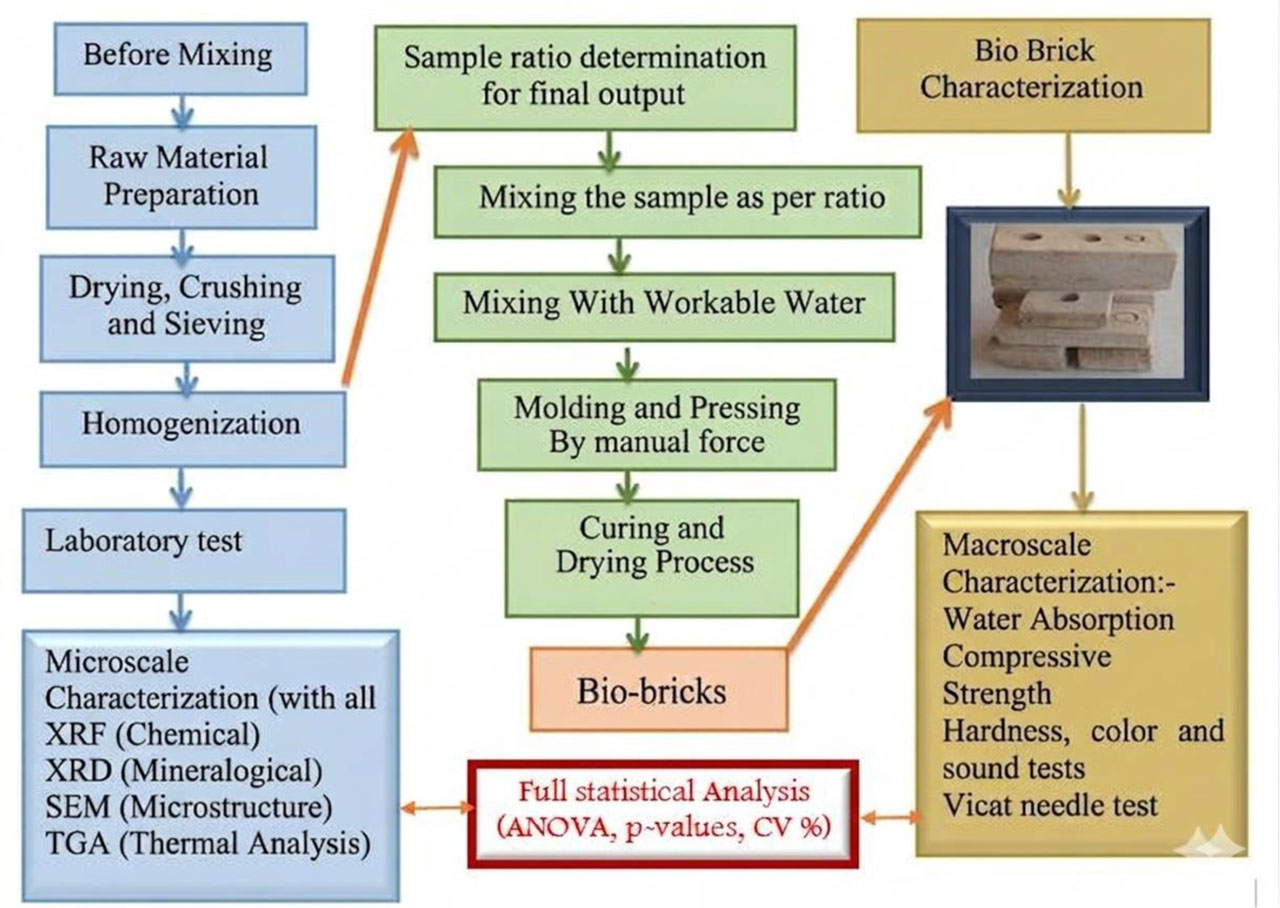
Figure 2:
General methodological process and characterization techniques
As showed below in Figure 3 illustrated the study area's location by presenting the spatial distribution with geo-referenced coordinates and administrative boundaries. It clearly depicted procurement zones, highlighting four specific regions within the Oromia administrative area: Adami Tulu Jido Kombolcha, where termite mound soil was sourced; Ambo Town, where lime was obtained; Burayu Sub-City, where clay and sand were acquired; and Chewaka Woreda Administration, where rice husk was accessed.
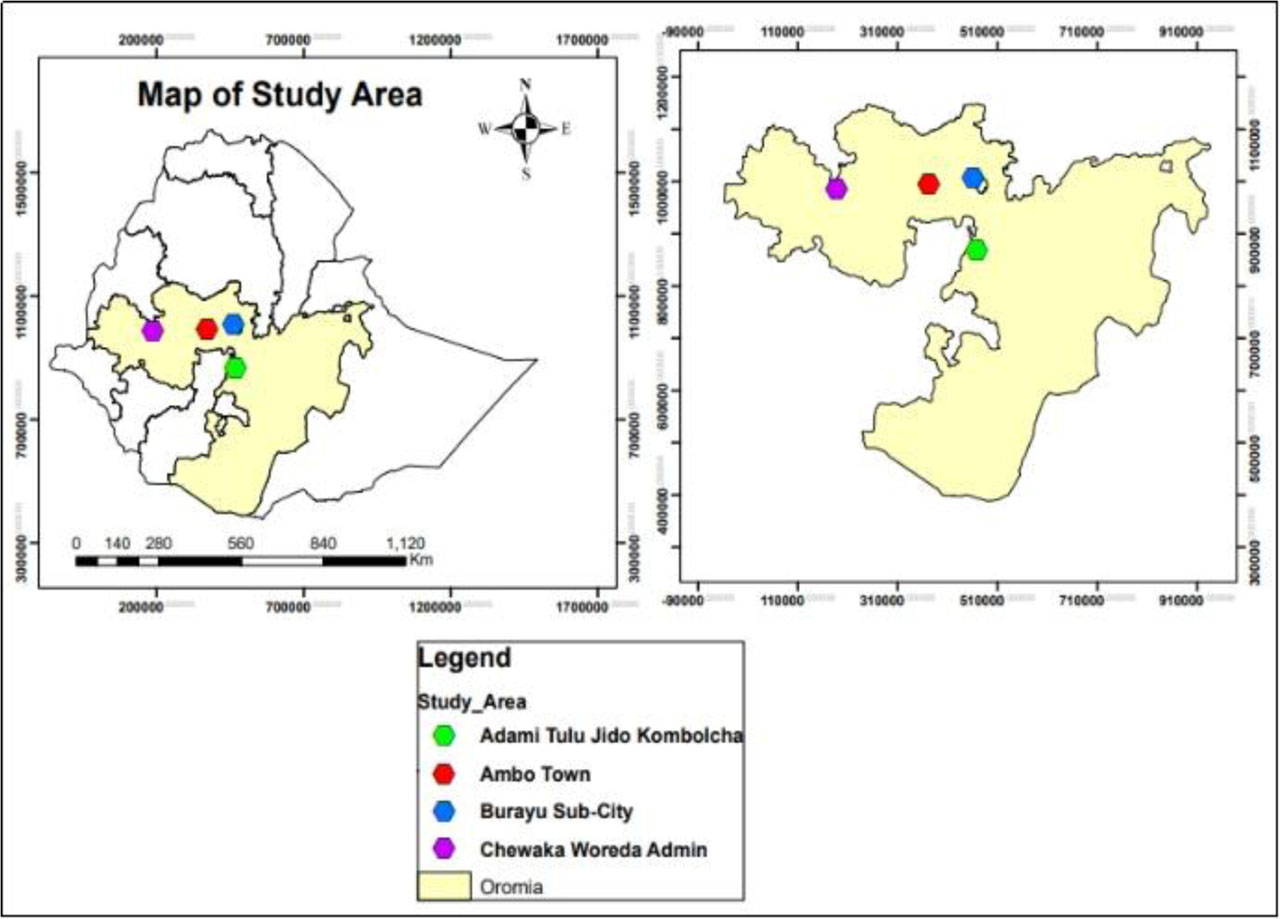
Figure 3:
Location Maps of the study area
2.3. Data Collection
The data collection process was executed with a focus on precision and reliability, utilizing a systematic approach to gather materials from specific locations. The collection sites were carefully chosen within the Oromia administrative area, including Adami Tulu Jido Kombolcha, Ambo Town, Burayu Sub-City, and Chewaka Woreda Administration. Each site was geo-referenced to ensure traceability and accuracy, with standardized procedures employed throughout the collection phase. This meticulous documentation facilitated uniformity in the physical and index properties of the materials, maintaining the integrity of the data collected. To enhance accessibility and cost efficiency, the materials were sourced from areas in close proximity to the study site in Oromia Regional State, Ethiopia. This strategic selection of nearby locations streamlined supply and logistics, ensuring a reliable supply chain and reducing transport time. The use of handheld GPS devices enabled precise recording of each collection site's coordinates, while Google Maps was utilized to create a comprehensive resource map. This mapping process allowed for easy tracking and tracing of the procurement process, ensuring transparency and accountability in the data collection.
The choice of raw materials was driven by considerations of quality, cost-efficiency, and environmental sustainability. The main ingredients—clay, sand, rice husk, termite mound soil, and sun-dried powdered lime—were selected for their essential engineering properties and their contribution to the formation of bio-bricks. Each material played a critical role in achieving a balance between structural strength, local availability, low cost, and eco-friendliness. The combination of these materials facilitated the development of bio-bricks with desired properties, aligning with the research's goals of innovation and sustainability.
3. Results and Discussion
3.1. Particle Size Distribution and Geotechnical Properties of Raw Materials for Sustainable Brick Production
Suitability of clay, TMS, and lime for eco-friendly bricks manufacturing was determined based on the sieve analysis and geotechnical properties tests. As presented in Table 1 and particle size distribution curves shown in Figure 4 reveal that all the tested samples contained a considerable percentage of fine particles that would be advantageous for bio-brick manufacturing. Materials with more than 35% passing the No. 200 sieve are classified as fine-grained according to the AASHTO soil classification system. All investigated materials exhibited a high proportion of fine particles, indicating their suitability for sustainable brick production.
Table 1:
Particle Size Distribution of Raw Materials Used for Sustainable Brick Production
| Material | Passing No. 200 Sieve (0.075 mm) [%] | Passing No. 270 Sieve (0.053 mm) [%] |
|---|---|---|
| Clay | 85 | 75 |
| Lime | 68 | 60 |
| Termite Mound Soil (TMS) | 65 | 52 |
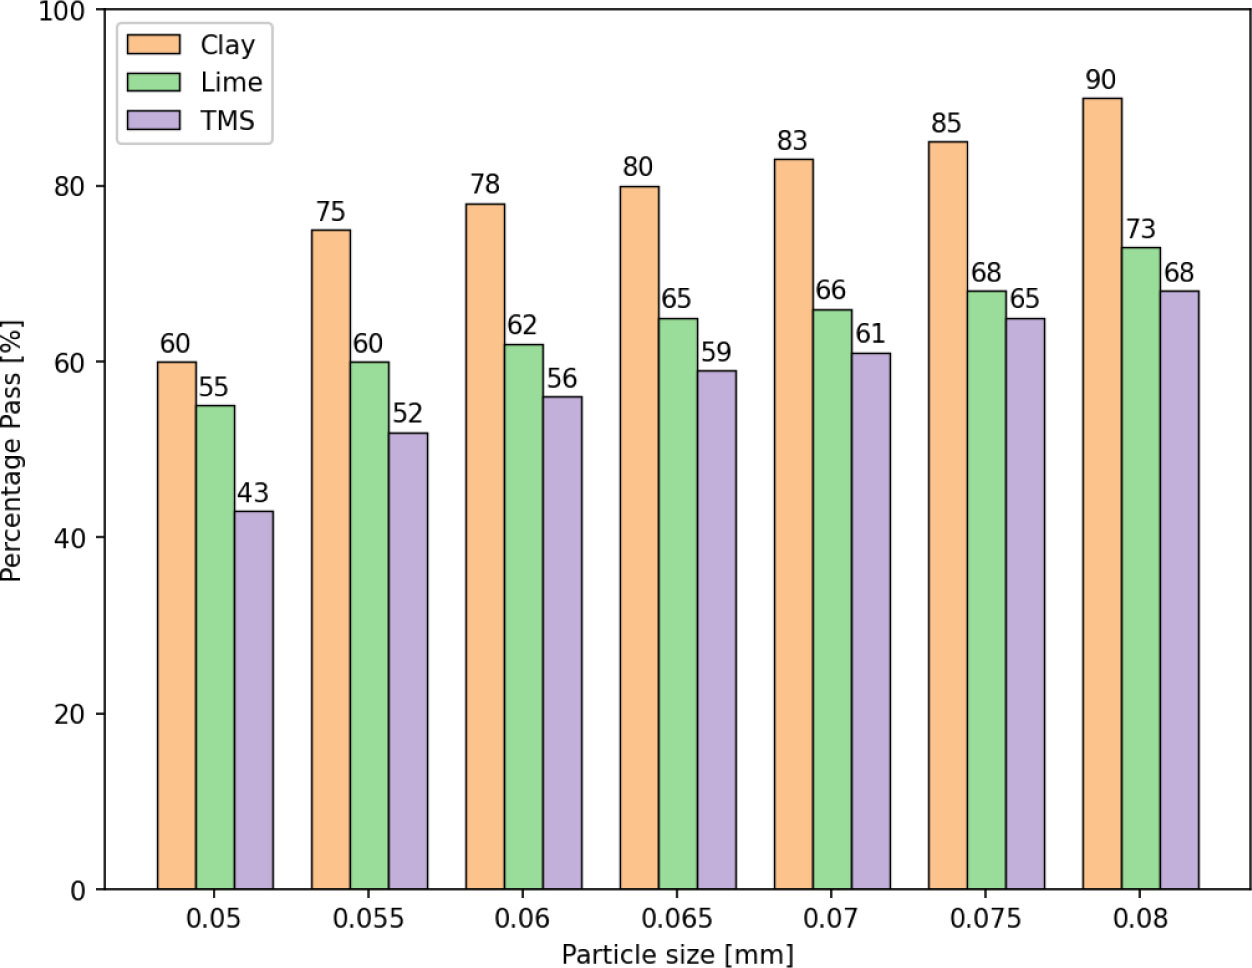
Figure 4:
Particle size distribution of clay, lime, and termite mound soil (TMS) showing the percentage passing at different sieve sizes
Clay exhibited the highest proportion of fine particles across all particle sizes, followed by lime and TMS. The predominance of fine particles in clay and TMS indicates their suitability for bio-brick production by enhancing plasticity, workability, and compaction behavior, while lime contributes to stabilization through pozzolanic reactions.
The percentage passing through Sieve No. 200 (0.075mm) is 85%, 68%, and 65% for clay, lime, and TMS, respectively, whereas the percentage passing through Sieve No. 270 (0.053 mm) is 75%, 60%, and 52%, respectively. According to the AASHTO soil classification, soils that contain over 35% of those passing through Sieve No. 200 are termed fine-grained soils. River sand and rice husk were subjected to only sieve No. 200 at a passing range of 8% to 10%, which was consistent throughout. This consistency is important to maintain the skeletal interlocking that creates the structural integrity of bio-bricks.
Clay exhibited more fine particles implying good plasticity and bonding capabilities, which are ideal for brick making. TMS had a relatively high number of fine particles (65% passing sieve No. 200), which is within the desired range (40–65%) for bricks. The fineness of lime was moderate and could be used to improve the strength of bricks through pozzolanic reactions when combined with clay and TMS. The particle size distribution graphs further confirmed the presence of fine particles, which increase the workability and compactness of bricks during the manufacturing process. (Legese et al., 2021)gave similar findings indicating that soils with enough fine particles are fit for brick making.
The geotechnical properties of clay and TMS were further analyzed using the standards of ASTM, and the results are presented in Table 1. The natural moisture content of both materials was relatively low with values of 4.2±0.3% and 3.8±0.4% for clay and TMS respectively (ASTM D2216). The specific gravities of the samples were 2.68±0.02 for clay and 2.55±0.03 for TMS (ASTM D854). It implies that clay particles have higher density than TMS particles.
This design process was done in order to analyze the effect of lime and TMS, keeping clay, sand, and rice husk as necessary components of the mixes. The five different designs (S1-S5) were developed, where clay, sand, and rice husk were present in different percent ratios. Each mix design was tested under different quantities of lime and TMS in order to determine their efficiency. Optimum mix design process was done by using 32 factorial design using Design of Experiments (DOE) and Response Surface Methodology (RSM). Lime and TMS were considered as independent variables, whereas compressive strength and water absorption were considered as response variables (G, 2021; Oke & Abuel-naga, n.d.; Umara et al., 2023).
According to the analysis of Atterberg limits (ASTM D4318), the liquid limit (54.3 ± 1.5%) was higher for TMS than for clay (48.5 ± 1.2%), reflecting better water-retaining ability. In a similar way, the plastic limit (28.1 ± 0.9%) for TMS was higher than for clay (22.3 ± 0.8%). However, the plasticity indices were equal for both substances (26.2%), which reflects their similar plastic properties. As shown by previous studies, soils with moderately-high plasticity indices provide good workability but require careful moisture control while performing the stabilization process (Legese et al., 2021; Makomra et al., 2022).
The compaction properties according to ASTM D698 revealed that the maximum dry density (1.82 ± 0.02 g/cm3) for clay was higher than for TMS (1.71 ± 0.02 g/cm3), which reflected better efficiency of compaction and more dense particle packing. On the other hand, the optimum moisture content (18.2 ± 0.6%) for TMS was higher than for clay (16.5 ± 0.5%).
Effect of Lime and Termite Mound Soil on Curing and Mechanical Performance
Effects of Lime and Termite Mound Soil (TMS) on Curing Behavior, Strength Properties and Durability of the Bio-Bricks Produced Were Investigated Using Controlled Lab Experiments Conducted at Adama Science and Technology University (temperature range: 26±2°C; Relative Humidity range: 43±5%). Clay, sand, and RH contents were kept constant while lime and TMS proportions were varied. Bricks were prepared using low energy curing process in which samples were air-cured and later dried using the sun for curing periods of 7, 14, and 28 days.
The summary of the curing performance of selected mixes is presented in Table 2. According to results, it was confirmed that the use of lime helped speed up the process of curing and increase the development of strength characteristics. The samples containing more lime, such as S2-3 and S1-5, gained compressive strength of 7.15 and 5.20 MPa after 28 days of curing. Such improvement occurred due to higher content of CaO in lime that promoted pozzolanic reaction resulting in formation of hydrated cementitious phases. However, according to XRD and TGA results, there are pozzolanic reaction products and densification of the matrix; still, there is no confirmation of amorphous C-S-H phases presence. Therefore, the discussion centers on the formation of hydration products.
Table 2:
Effect of Lime and TMS on Curing Performance of Selected Brick Samples
| Sampe | Lime [%] | TMS [%] | 28-Day Compressive Strength [MPa] | Setting Time [h] |
|---|---|---|---|---|
| S1-1 | 0 | 20 | 5.00 | 39.8 |
| S1-5 | 20 | 0 | 5.20 | 28.5 |
| S2-3 | 18 | 0 | 7.15 | 25.4 |
| S2-4 | 0 | 18 | 5.70 | 35.3 |
| S2-1 (Optimum) | 12 | 6 | 7.56 | 24.0 |
The analysis of variance (ANOVA) further confirmed that lime was the main parameter influencing both the compressive strength and water absorption properties, with the p-values of 0.0138 and 0.0439, respectively. Although the TMS improved the density of the particles, workability, and compaction of the matrix, it had relatively low influence on the strength gain in comparison to lime. The excessive TMS content delayed the hardening process, most likely due to an increase in the number of fine clay particles and residual organic components.
Among all the tested mixes, sample S2-1, containing 45% clay, 22% sand, 15% rice husk, 12% lime, and 6% TMS, exhibited the highest performance characteristics. According to the statistical analysis results (Supplementary File S2), Scenario 2 achieved the highest average compressive strength and minimal standard deviation, with CV equal to 7.99%.
The modified bio-brick exhibited compressive strength of 7.56 MPa, exceeding the typical compressive strength of fired clay bricks (around 6.5 MPa). Additionally, it displayed low moisture absorption rate (14.15%) with a density of 1.55 g cm−3 and high resistance to cracking. The improvements in the properties of the brick can be attributed to the synergistic action of lime and TMS, which increased the pozzolanic reaction and improved particle arrangement (Abu Bakr et al., 2023; Ramesh et al., 2023).
3.2. Visual Relationship to Baseline Performance and Structural Engineering Assessment
The study utilized a two-way ANOVA to examine the effects of varying Lime% and TMS% on water absorption (WA %) and compressive strength (CSt, MPa). Descriptive statistics, including mean, standard deviation, coefficient of variation, residual error, and total variance, were computed to evaluate data variability and model robustness. Multiple Linear Regression models were constructed to predict WA% and CSt, with performance assessed using R2, adjusted R2, and predicted R2. Statistical significance was confirmed through F-statistics and p-values, ensuring the validity of the models. The results were substantiated by quantitative metrics and statistical tests, offering a detailed understanding of the factors impacting the response variables.
The visual mapping graph plots in Figure 5 demonstrate how the average performance of Scenarios 1 and 2 is better compared to the average grand mean baselines of other three scenarios regarding water absorption and compressive strength. Consequently, both scenarios exhibit reduced water absorption and enhanced compressive strength. According to the final experimental optimization analysis, Scenario 2, specifically sample 2:1 (SA 2:1)—comprising 45% clay, 22% sand, 15% rice husk, and a variable additive mix of 12% lime and 6% termite mound soil—achieved superior mechanical performance (Supplementary File S1). This formulation maintained water absorption significantly below the statutory limit of 20%. Conversely, Scenarios 3, 4, and 5 did not meet the performance criteria due to high water absorption and extensive macro-void cracking during curing, leading to their rejection. However, the optimal composition sample S2-1 recorded the highest compressive strength of 7.56 MPa and reduced water absorption to 14.15%, outperforming traditional clay bricks and other scenarios. This can be attributed to the presence of a well-blended soil composition, consisting of clay, sand, rice husk, lime, and termite mound soil (TMS). (Bakker et al., 2020) made a report of similar results. The writer proposes that compressed earth blocks' durability and strength can be enhanced through the use of proper soil-lime combinations. According to (Hershey et al., 2023), the blocks will have lower water uptake levels if there is good stabilization of the blocks. The performance of Scenario 2 directly links with SEM and XRD results due to the fact that it has dense microstructure and better development of cementitious products such as C-S-H. The addition of rice husks in the right amounts improves the reactivity of the blend because of the provision of reactive silica; however, excessive amounts may cause porosity and low strength, according to (Malkanthi et al., 2020; Soharu et al., 2022). The same happens in the case of TMS addition, which increases the pozzolanic action of the bricks. Many researchers have demonstrated that using appropriate amounts of natural soil, agricultural residues, and lime stabilization can create low carbon emission building materials with sufficient mechanical strength (Malkanthi et al., 2020; Muheise-Araalia & Pavia, 2021).
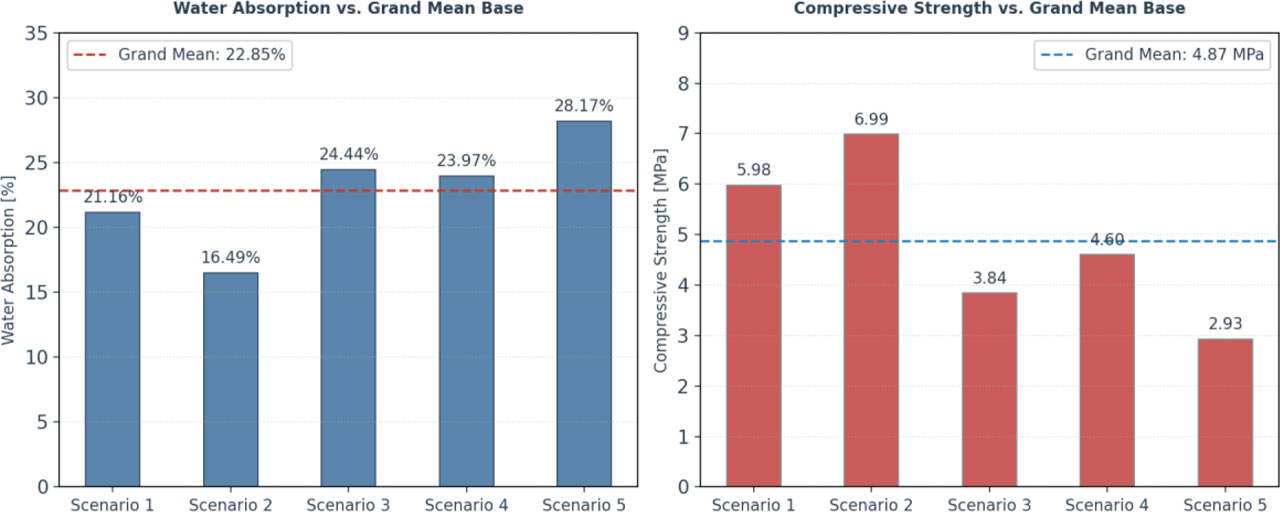
Figure 5:
Comparison of water absorption and compressive strength of the five bio-brick scenarios relative to the grand mean values
The study explores the influence of lime content on the water absorption and compressive strength of bio-bricks using empirical regression models for predictive analysis. The regression equation WA (%) = 20.841 – 0.4304 × (Lime %) + 0.0104 × (TMS %) (Eq.1) indicates that an increase in lime content significantly reduces water absorption and this has been confirmed with the experimental results illustrated in Supplementary File S1. Conversely, a two-way ANOVA reveals a positive correlation between lime content and compressive strength, as shown by CSt (MPa) = 5.759 + 0.1197 × (Lime %) + 0.0153 × (TMS %) (Eq.2). An inverse linear interaction equation CST = −0.322 ×WA + 11.834 further examines the relationship between water absorption and compressive strength, with verification mapping confirming its accuracy against experimental data from scenarios 2 and 5. Two predictive models are proposed: Model A, an inverse linear interaction equation CST predicted = −0.2545 × (WA) + 9.6833 with R2 = 0.2504, predicts a CST of approximately 6.52 MPa for Scenario 2 (WA = 16.49%), closely aligning with the experimental value of 6.99 MPa, and 2.76 MPa for Scenario 5 (WA = 28.17%), closely matching the average experimental result of 2.93 MPa (See Supplementary File S1, Table 3, Table 4 and Table 5). Model B, a quadratic polynomial regression CST predicted = 0.0560 X (WA)2 − 2.7349 × (WA) + 36.2792 with R2 = 0.4382, offers a more precise correlation for materials exhibiting non-linear failure modes under stress, predicting a CST of 6.44 MPa for Scenario 2 and 3.65 MPa for Scenario 5, approximating the average experimental values of 6.99 MPa and 2.93 MPa, respectively. Model verification checks align closely with experimental values, reinforcing the models' validity for predicting bio-brick performance under varying conditions.
Scenario 2 exhibited the best overall performance, achieving the lowest water absorption (16.49%) and the highest compressive strength (6.99 MPa), indicating improved durability and structural integrity. In contrast, Scenario 5 showed the highest water absorption (28.17%) and the lowest compressive strength (2.93 MPa). The dashed lines represent the grand mean values of water absorption (22.85%) and compressive strength (4.87 MPa), highlighting the relative performance of each scenario.
Optimization of Bio-Brick Composition and Mechanical Performance
The results of the response surface and optimization analyses for the bio-bricks fabricated are depicted in Figures 6 and Figure 7 below, indicating how the variations in the ratio of clay to sand, rice husk (RH), lime, and TMS affect the compressive strength and water absorption properties of bricks.
According to Figure 6, the expected compressive strength increased with decrease in the ratio of clay to sand from approximately 3.2 to 1.3, attaining an optimum value of approximately 7.8–8.0 MPa. The increase in the compressive strength could be attributed to the increased content of sand, which improved particle packing, reduced drying shrinkage, and provided a uniform granular structure in the bio-brick matrix. High clay content contributed to shrinkage and formation of micro cracks in the brick matrix (Muheise-Araalia & Pavia, 2021; Oti et al., 2009).
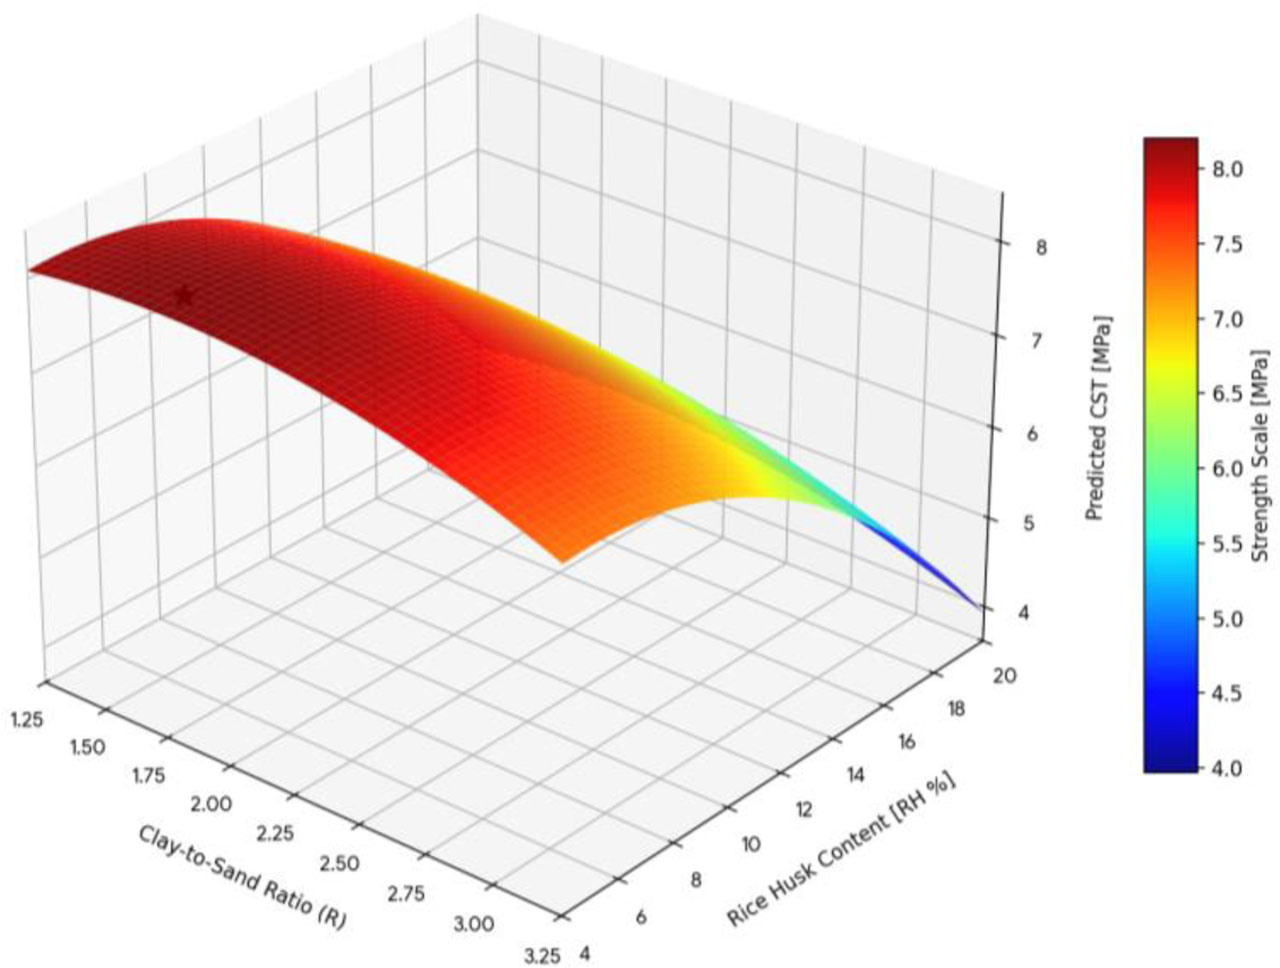
Figure 6:
Response surface plot showing the predicted compressive strength (CST) of bio-bricks as a function of the clay-to-sand ratio (R) and rice husk (RH) content
The compressive strength increases with decreasing clay-to-sand ratio and lower rice husk content, reaching a maximum value of approximately 8 MPa (indicated by the star). The color gradient represents the strength distribution, with warmer colors corresponding to higher compressive strength. The figure highlights the interactive influence of mixture proportions on the mechanical performance and optimization of sustainable bio-bricks.
Content of the rice husk also had an influence on the compressive strength. Low contents of rice husk (4–8%) gave higher compressive strengths, whereas high contents of rice husk (>15%) gradually reduced the strength because of high organic content that increased porosity and interrupted matrix continuity (Gbadeyan et al., 2023; Maraveas, 2020). The optimal content was observed in a clay-to-sand ratio of 1.3–1.5 with 4–6% RH, where the cumulative effect of clay bonding, sand consolidation, and RH increase caused formation of a denser and stronger structure.
In Figure 7, the effects of lime and TMS on water absorption and compressive strength are presented. Increasing content of lime from 10% to 18% reduced water absorption from about 19.4% to 14.0%, and increased compressive strength from approximately 6.1 MPa to 7.7 MPa. Adding of low content of TMS contributed to increased density and stabilized matrix; however, lime remained the major factor affecting performance.
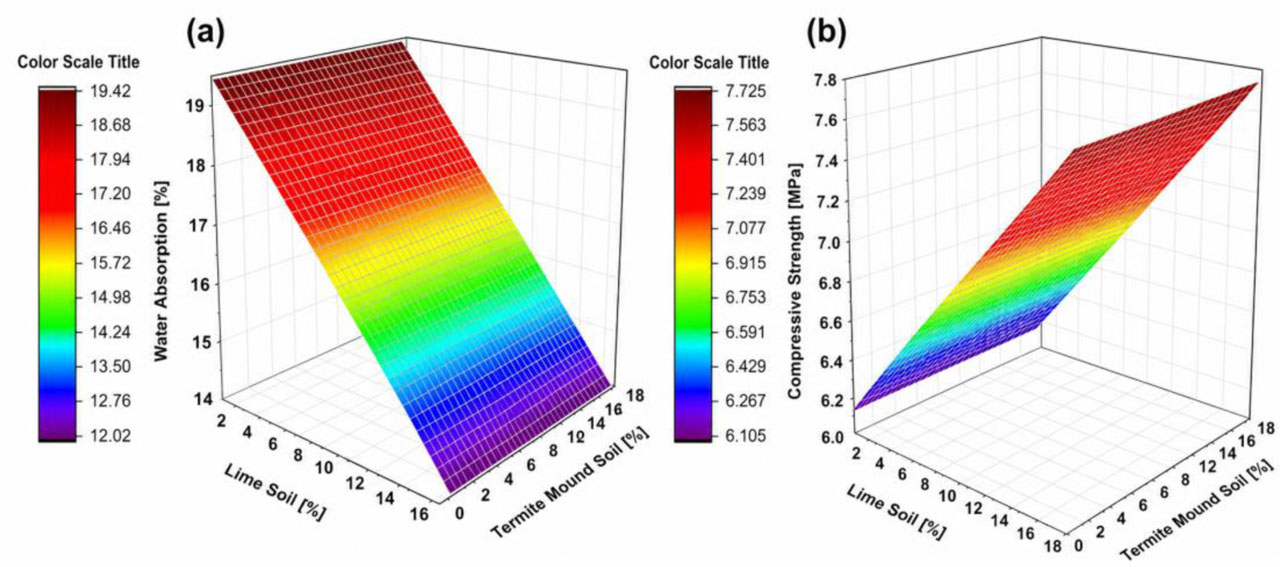
Figure 7:
Response surface plots showing the influence of lime and termite mound soil (TMS) contents on the performance of the developed bio-bricks: (a) predicted water absorption (%) and (b) predicted compressive strength (MPa)
Increasing lime content reduced water absorption and improved compressive strength, while moderate TMS additions enhanced overall performance. The optimum region was observed at approximately 12–18% lime and 4–6% TMS, corresponding to low water absorption (≈14–15%) and high compressive strength (≈7.5–7.8 MPa)
The experimental outcomes confirmed the anticipated patterns. Scenario 2 demonstrated the highest overall performance, attaining the lowest mean water absorption (16.49 ± 1.93%) and the greatest mean compressive strength (6.99 ± 0.56 MPa), as well as a low coefficient of variation (CV = 7.99%), suggesting strong repeatability and consistency. As showed in Table 3, the analysis of variance (ANOVA) revealed that the overall mix composition significantly influenced both water absorption (F = 34.73, p = 3.19 × 10⁻¹¹) and compressive strength (F = 58.22, p = 3.11 × 10⁻¹⁴). These results indicate that fine-tuning the ratios of the component materials is essential for enhancing the mechanical properties and longevity of the created bio-bricks. As presented in table 4, the regression analysis results demonstrate a high degree of mathematical fitness and statistical significance for both modeled target boundary properties. The compressive strength model exhibited an R-squared value of 71.53%, indicating a strong explanatory power, with an F-statistic of 17.59 and a p-value of 0.004, signifying statistical significance. In comparison, the Water Absorption model showed an R-squared value of 65.38%, with an F-statistic of 12.35 and a p-value of 0.011. The adjusted fit values closely aligned with the predicted fit values, showing 61.20% versus 56.40% for Water Absorption and 67.46% versus 62.36% for Compressive Strength, which confirms the models' excellent generalization and predictive capabilities without overfitting risks.
Table 3:
Statistical assessment of the developed bio-bricks based on five scenarios with respect to water absorption and compressive strength with their means, standard deviations (SD), and coefficient of variation (CV). Scenario 2 proved to be the most efficient in terms of both minimum water absorption (16.49 ± 1.93%) and maximum compressive strength (6.99 ± 0.56 MPa)
| Structural Property | Evaluation Metric | Scenario 1 | Scenario 2 | Scenario 3 | Scenario 4 | Scenario 5 |
|---|---|---|---|---|---|---|
| Water Absorption (AVGWA) [%] | Column mean (Xj) | 21.16 | 16.49 | 24.44 | 23.97 | 28.17 |
| Standard Deviation (SD) [-] | 2.14 | 1.93 | 2.30 | 1.95 | 2.00 | |
| Relative Variation (CV) [%] | 10.11 | 11.71 | 9.40 | 8.12 | 7.10 | |
| Compressive Strength (AVGCST) [MPa] | Column Mean(Xj) | 0.98 | 6.99 | 3.84 | 4.60 | 2.93 |
| Standard Deviation (SD) [-] | 0.81 | 0.56 | 0.79 | 0.28 | 0.45 | |
| Relative Variation (CV) [%] | 13.61 | 7.99 | 20.61 | 5.99 | 15.44 |
Table 4:
Comprehensive overview of the mathematical fitness, significance testing, and regression diagnostics for the boundary models of water absorption and compressive strength
| Modeled Target Boundary Property | Model Fit (R2) [%] | Adjusted Fit (Rad) [%] | Predicted Fit (R2pre) [%] | Regression Error (S) [%] or [MPa] | Standard Regression ANOVA Status [-] | Maximum Standard Residual |
|---|---|---|---|---|---|---|
| Water Absorption (WA) | 65.38 | 61.20 | 56.40 | ± 1.201 | F = 12.35 P = 0.011 | +1.98 |
| Compressive Strength (CSt) | 71.53 | 67.46 | 62.36 | ±0.318 | F = 17.59 P = 0.004 | −2.36 |
For the Water Absorption (WA) model, the Model Fit (R2) is 65.38%, with an Adjusted Fit (R2adj) of 61.20% and a Predicted Fit (R2pre) of 56.40%. The regression error is ±1.201%, with a standard regression ANOVA status of F=12.35 (P=0.011), and a maximum standard residual of +1.98. In comparison, the Compressive Strength (CSt) model exhibits a Model Fit (R2) of 71.53%, an Adjusted Fit (R2adj) of 67.46%, and a Predicted Fit (R2pre) of 62.36%. The regression error for this model is ±0.318MPa, with an ANOVA status of F=17.59 (P=0.004), and a maximum standard residual of −2.36.
Optimal Bio-Brick Composition and Performance
As showed in table 5 and Figure 8, the study identified sample S2-1 as the optimal bio-brick composition, consisting of 45% clay, 22% sand, 15% rice husk, 12% lime, and 6% termite mound soil (TMS) by weight. This configuration maintained the core skeletal framework (clay, sand, and rice husk) at 82% to ensure workability and shape retention, while the remaining 18% functioned as a binary stabilizer mix. To prepare the mix, 900 g of clay, 440 g of sand, 300 g of rice husk, 240 g of lime, and 120 g of TMS were combined, yielding a standardized weight ratio of 7.5:3.7:2.5:2:1. The optimized bio-bricks exhibited an average density of 1.55 g/cm3 with standardized dimensions of 10 × 15 × 10 cm.
As detailed in Table 4 and illustrated in Figure 8, sample S2-1 achieved a peak compressive strength of 7.56 MPa and the lowest water absorption rate of 14.15%. This performance significantly surpassed the baseline control testing of traditional 100% fired clay bricks, which averaged a compressive strength of 6.50 MPa and a water absorption rate of 18.00%. Furthermore, sample S2-1 satisfied the durability thresholds outlined in ASTM C67, which restricts maximum water absorption to below 20%.
The structural and mechanical enhancements observed in sample S2-1 were primarily driven by the synergistic effects of the ternary stabilizers. The balanced addition of 12% lime and 6% TMS optimized particle packing and promoted lime-induced pozzolanic reactions. These reactions facilitated the formation of calcium silicate hydrates (C–S–H), which effectively filled micro-pores, reduced overall porosity, and enhanced material cohesion (Muheise-Araalia & Pavia, 2021; Oti et al., 2009). Consequently, the brick developed a denser microstructure with superior resistance to both load and moisture penetration. These microstructural findings were corroborated by X-ray diffraction (XRD), scanning electron microscopy (SEM), and thermogravimetric analysis (TGA) data.
Mechanical and physical evaluations followed standardized testing protocols. Mechanical testing conditions, detailed in File S2, adhered to ASTM C67 using a Tecnotest universal testing machine. The brick specimens were loaded perpendicularly to the bedding plane across a net loaded area of 9,057.5 mm2, which included three pre-formed holes of 20 mm diameter. Each configuration was evaluated using six replicates. Structural failure consistently initiated through the formation of vertical cracks propagating through the holes, followed by edge spalling and matrix crushing, which indicated typical brittle material behavior.
Water absorption characteristics were determined using the ASTM C67 submersion protocol. Brick specimens were washed, oven-dried at 110 ± 5°C until they reached a constant mass, and weighed to record their initial dry weight (W1). The specimens were subsequently immersed in water at 15–30°C for 24 hours. Upon removal, surface moisture was wiped off, and the samples were reweighed to obtain the wet weight (W2). The final water absorption percentage was calculated using the standardized formula: Water Absorption (%) = (W2−W1)/W1 × 100.
Overall, sample S2-1 exhibited superior durability and structural integrity, meeting ASTM C67 durability requirements with a water absorption rate below 20%. It outperformed traditional fired clay bricks in both strength and moisture resistance, demonstrating an average density of 1.55 g/cm3 with standardized dimensions of 10 cm × 15 cm × 10 cm.
Table 5:
Experimental matrix of the mixture design optimization under Scenario 2 and associated engineering response variables versus control traditional bricks
| Scenario | Experimental Variable | Response Variable | |||||
|---|---|---|---|---|---|---|---|
| Clay [%] | Sand [%] | Rice [%] | Lime [%] | Termite mound [%] | Water absorption [%] | Compression [MPa] | |
| Traditional Bricks | 100 | 0 | 0 | 0 | 0 | 18 | 6.5 |
| Scenario 2 | S2-1 | 45 | 22 | 12 | 6 | 14.15 | 7.56 |
| S2-2 | 45 | 22 | 8 | 10 | 16.7 | 6.9 | |
| S2-3 | 45 | 22 | 18 | 0 | 16 | 7.15 | |
| S2-4 | 45 | 22 | 0 | 18 | 21 | 5.7 | |
| S2-5 | 45 | 22 | 10 | 8 | 16.25 | 7.1 | |
| S2-6 | 45 | 22 | 14 | 4 | 15.32 | 7.4 | |
| S2-7 | 45 | 22 | 6 | 12 | 17 | 6.73 | |
| S2-8 | 45 | 22 | 13 | 5 | 15.12 | 7.45 | |
| S2-9 | 45 | 22 | 7 | 11 | 16.87 | 6.88 | |
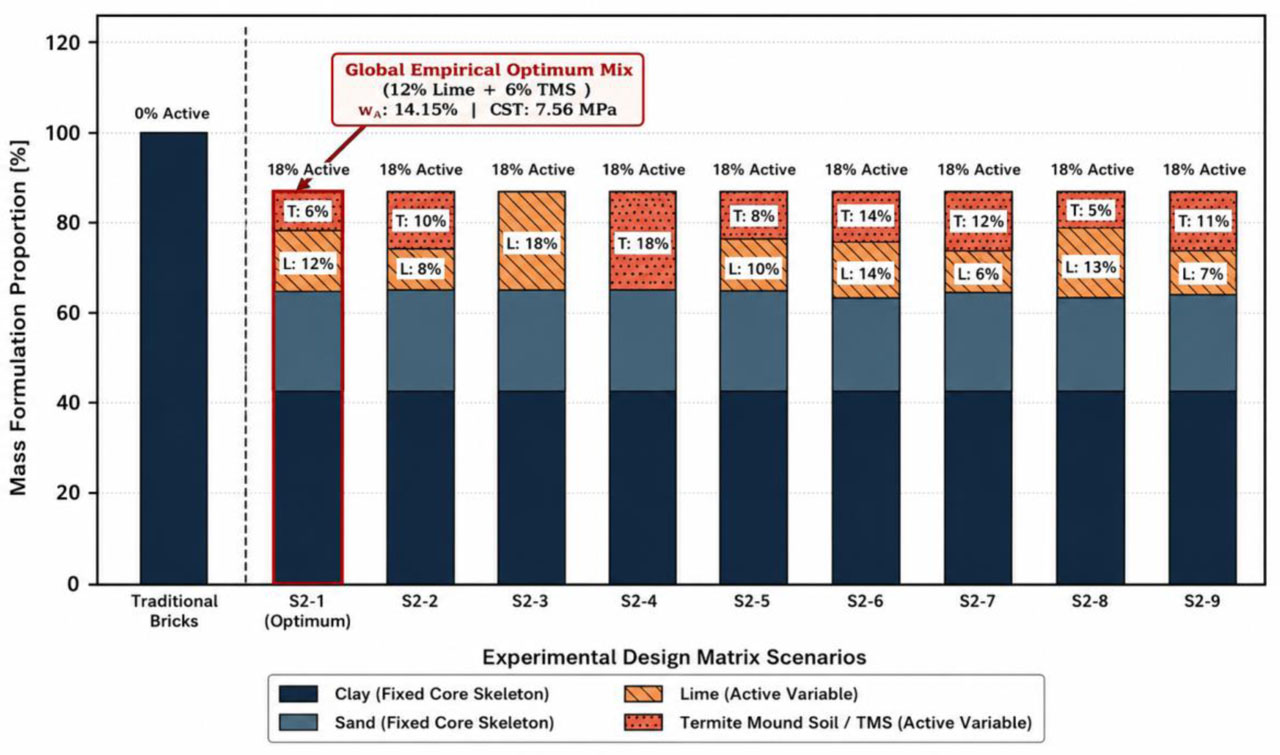
Figure 8:
Complete mass formulation proportion mapping alignment fixed core skeletal framework vs. Active variable stabilizer dosage
As illustrated in Figure 9, the fabrication procedures began with form working (a), where rigid wooden mold boundaries were cleaned and calibrated. This was followed by weighted mix ratio verification (b), during which exact gravimetric measurements of each component were conducted to ensure consistency and prevent volumetric batch variance. The next step, blending mix ratio execution (c), involved homogenizing sieved raw materials through dry mechanical mixing to achieve uniform particle size distribution. Hand-baking (d) was then performed, consisting of preliminary manual compounding of the hydrated composite paste. Subsequently, re-baking on foot (e) was conducted immediately after a three-day fermentation and maturation period to enhance mineral hydration and optimize plasticity. Plasticity and deformation assessment (f) evaluated the blend's ability to stretch and deform without micro-fracturing or shear rupture, ensuring sufficient workability. Molding (g) involved pressing and compacting the composite paste into 15 cm × 10 cm × 10 cm forms, followed by demolding and primary air curing (h), during which green bricks were air-dried for seven days under translucent roof sheets with controlled relative humidity of 50%–70% to prevent differential shrinkage cracking at early stages. The final stage, secondary solar curing (i), exposed the matured bricks to direct solar radiation, promoting complete matrix crystallization and ensuring long-term durability.
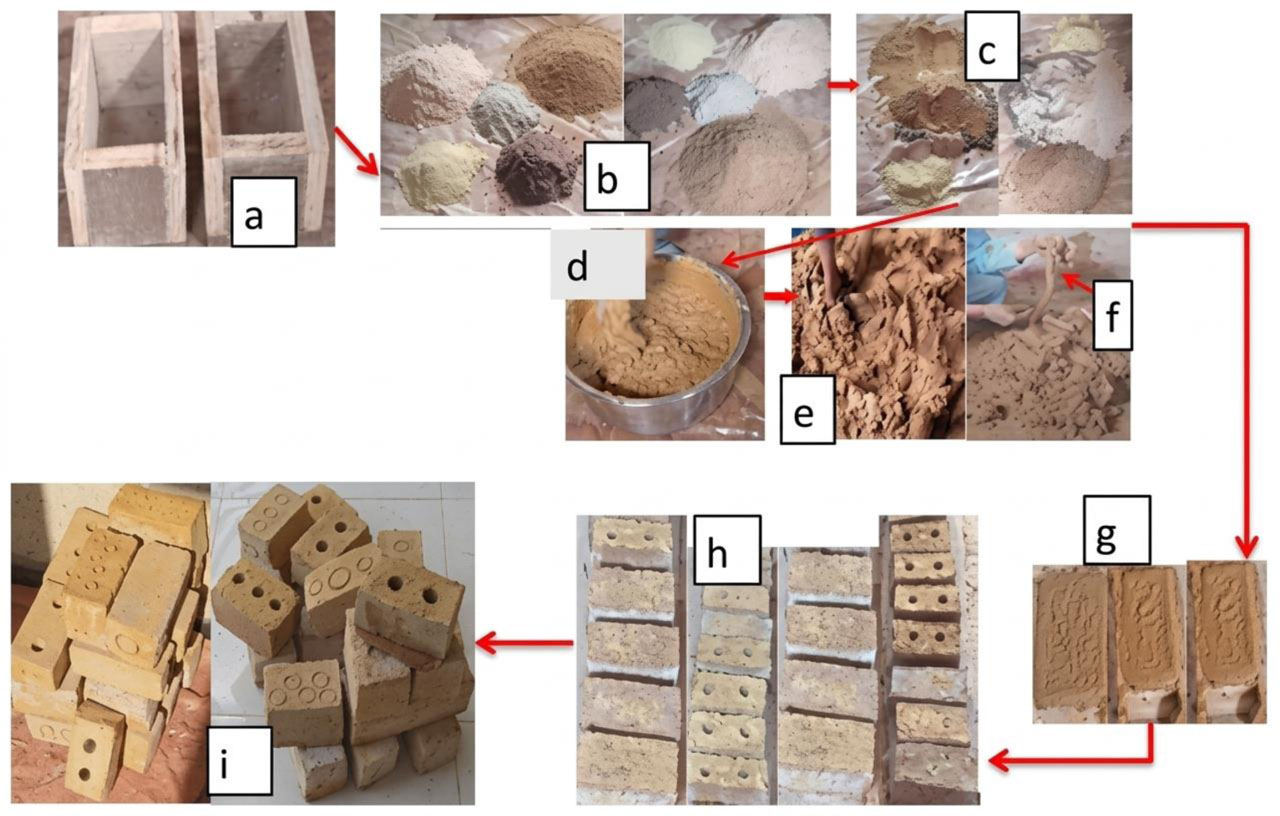
Figure 9:
Step-by-step bio-brick manufacturing, molding, and curing process. (a) Form working; (b) weighted mix ratio; (c) blending mix ratio; (d) hand-kneading; (e) foot-treading after fermentation period; (f) verification of blend plasticity and structural integrity; (g) molding; (h) demolding and 7-day ambient air curing; (i) direct solar curing process
Figure 10 illustrates the relationship between chemical formulation and the physical properties of the optimized S2:1 bio-bricks. Mechanical and Physical Performance (Figure 10a): The graph tracks the impact of varying lime content (%) on water absorption and compressive strength. As lime concentration increases up to 12%, the compressive strength steadily climbs to a peak value of approximately 7.5 MPa. Concurrently, water absorption drops significantly from an initial 21% down to a minimum of approximately 14.1% at the same 12 % lime threshold. This optimal point indicates the maximum density and matrix cohesion of the mix. Beyond 12 % lime, a sharp reversal occurs, characterized by a sudden reduction in strength and an increase in water absorption, signifying a drop in structural efficiency at higher lime ratios. Each data point included a 1% error bar, indicating the results were reliable and repeatable. Physical Morphology (Figure 10b): The photographic panels display the visual characteristics and structural forms of the optimized bio-bricks. The manufactured samples present distinct uniform perforation patterns, sharp edge definitions, and a consistent color distribution. This visually confirms successful mold compaction, minimal shrinkage defects, and structurally sound macro-integrity post-curing. The image shows a highly cohesive material framework with standardized dimensions of 10 × 15 × 10 cm and an average density of 1.55 g/cm3.
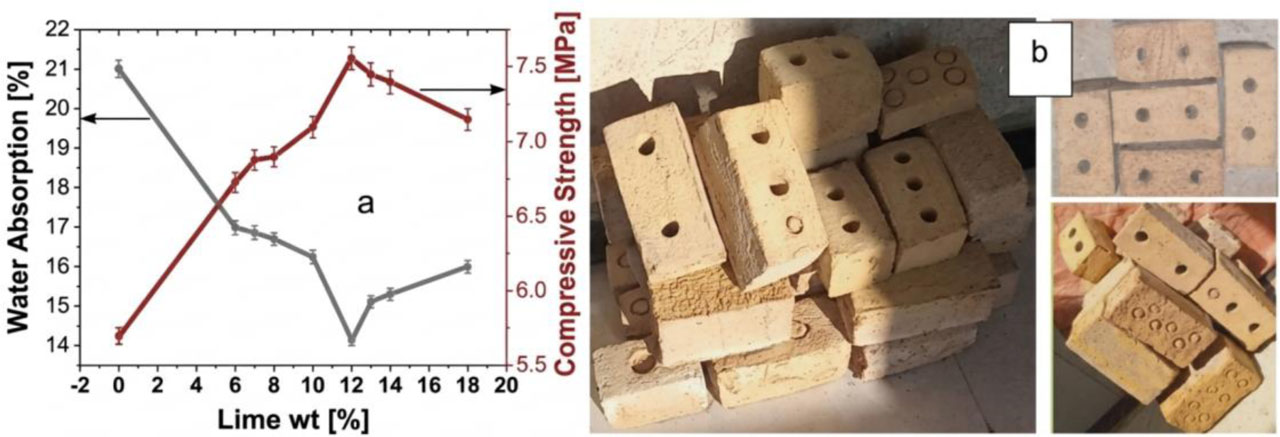
Figure 10:
Optimal mixture design and performance characteristics of optimized s2:1 bio-bricks
The model depicted in Figure 11 demonstrated the predictive capabilities of a multiple linear regression analysis under Scenario 2 (SA2-1), focusing on the behavior of active variable additives in relation to material engineering criteria. The response surfaces for water absorption and compressive strength were illustrated in Figures 12a and 12b, respectively. For water absorption, the model achieved an R2 value of 65.38% with a statistically significant p-value of 0.011. The compressive strength model showed a higher R2 value of 71.53% with a p-value of 0.004, indicating the models' ability to estimate responses based on tested variables.
The compressive strength model, detailed in Figure 11 (a), achieved an R2 value of 71.53%, signifying that over 70% of the variation in compressive strength was due to changes in lime and termite mound proportions. This model had strong explanatory power with an F-statistic of 17.59 and a p-value of 0.004, indicating high statistical significance, as shown in Table 4. In comparison, the water absorption model demonstrated an R-squared value of 65.38%, with an F-statistic of 12.35 and a p-value of 0.011, also reflecting significant results.
Both models exhibited adjusted fit values (R2adj) closely aligned with predicted fit values (R2pre), with water absorption showing 61.20% versus 56.40% and compressive strength showing 67.46% versus 62.36%. This alignment confirmed the models' excellent generalization and predictive capabilities while minimizing overfitting risks. Additionally, the standard regression errors were minimal, recorded at ±1.201% for water absorption and ±0.318 MPa for compressive strength. The maximum standard residuals were within acceptable ranges, noted at +1.98 for water absorption and −2.36 for compressive strength, further affirming the reliability and precision of the regression models, as detailed in Table 3.
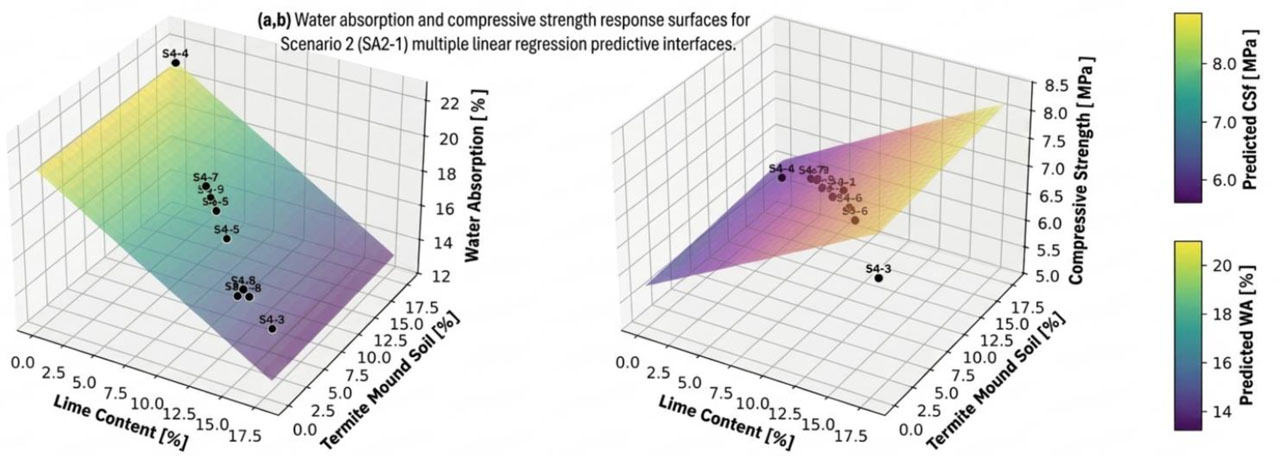
Figure 11:
Scenario 2 (SA2-1) Multiple linear Regression predictive interfaces for simultaneous behavior mapping of active variable additives against material engineering criteria: (a) Water absorption response surface (Model R2=65.38%, P=0.011) and (b) compressive strength response surface (Model R2=71.53%, P=0.004)
3.3. Characterization of Raw Materials and Optimized Composite
Microstructural Analysis of Raw Materials and the Optimized Composite
As presented in Figure 12: SEM micrographs clearly showed (a) clay, (b) sand, (c) rice husk, (d) lime soil (e) termite mound soil, (f) optimized composite and particle size distribution of the optimized composite showing fine, well-dispersed particles (<20 μm). The clay sample showed a dense, tightly packed structure made up of irregular, plate-like particles layered silicate minerals like kaolinite and illite and these particles left little room for pores, suggesting a cohesive matrix. Micro-cracks and surface roughness were visible, which likely influenced water absorption and mechanical strength. The findings match those of (Mahamat, Obianyo, et al., 2021; Soharu et al., 2022), who observed similar morphologies and implications for natural clays in ceramic applications.
The sand SEM image indicated that grains appeared uniform in size, well-sorted, and smoothly surfaced, but they were packed loosely. This structure suggested high porosity and good drainage—ideal for composites that need dimensional stability, though the low cohesion limits binding. These results resonated earlier studies that described sand’s role as a filler to boost structural integrity in earthen materials (Huang et al., 2023).
Lime, on the other hand, revealed particles that were more angular and heterogeneous and this angularity increased mechanical interlocking and durability due to its pozzolanic reactivity, lime’s structure improved bonding when mixed with siliceous materials, as previously discussed by (Ramesh et al., 2023). The scanning electron microscopy (SEM) analysis of termite mound soil revealed a fine-grained and tightly packed matrix characterized by uneven surfaces and the presence of tiny pores. The biogenic binding agents produced by termites contribute to the well-cemented nature of the soil particles. This finding aligns with the study by Shelke et al., (2023), which supports the notion that termite soil enhances strength in load-bearing applications.
The scanning electron microscopy (SEM) image of rice husk reveals a distinctive, fibrous, and highly porous microstructure. Observations indicate that the interior of the rice husk is characterized by elongated fibers and void spaces, while its exterior surface appears to be silica-rich and exhibits a shedding texture. This unique structural configuration significantly enhances the surface area, which facilitates improved mechanical interlocking and moisture absorption. As reported by (Gbadeyan et al., 2023; Haruna et al., 2024), these morphological features contribute directly to superior mechanical reinforcement and thermal insulation properties when rice husk is incorporated into composite materials.
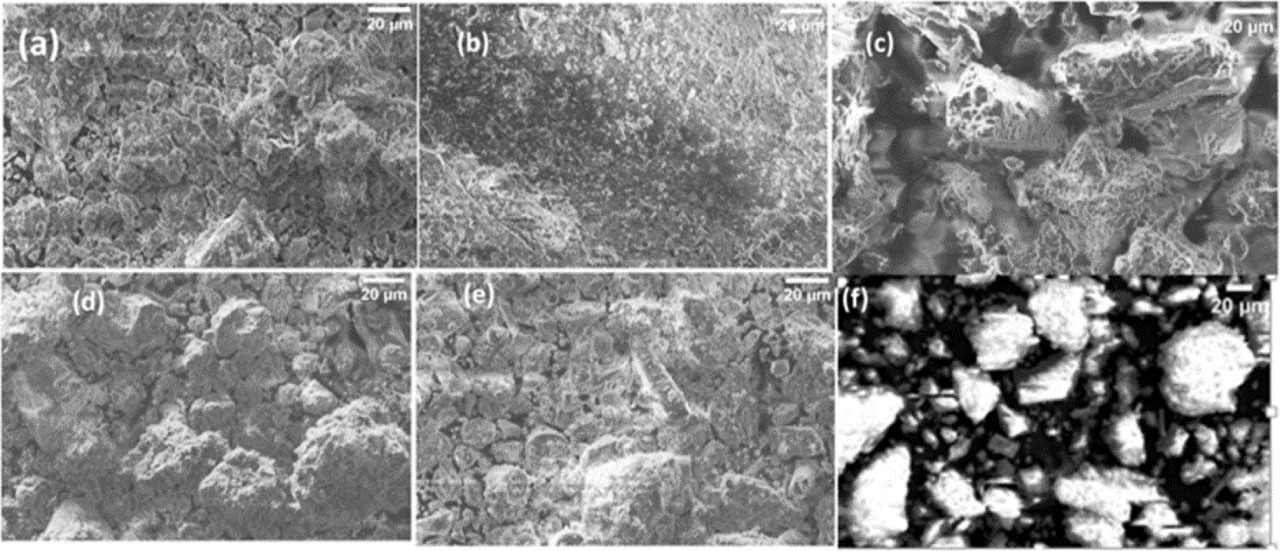
Figure 12:
Scanning electron microscopy (SEM) micrographs illustrating the microstructural morphology of raw materials and the final composite: (a) clay, (b) sand, (c) rice husk, (d) lime, (e) termite mound soil (TMS), and (f) the optimized blend mixture
The SEM image analysis of the optimized composite—comprising 45% clay, 22% sand, 6% termite mound soil, 12% lime, and 15% rice husk—revealed a well-integrated and heterogeneous matrix. The mineral particles, particularly those from clay and termite mound soil, exhibited close interaction with the organic, fibrous rice husk. This strong interfacial bonding between components enabled the rice husk fibers to effectively reinforce the composite, significantly enhancing its compressive strength. The microstructure demonstrated efficient stress transfer and maintained the material’s structural integrity under load. Detailed experimental results, provided in Supplementary File S1, confirmed that this particular combination of organic and inorganic components achieved the highest compressive strength and the lowest water absorption among all tested samples (refer to S2-1). These findings align with existing literature, which highlights the potential of hybrid composites as sustainable and durable building materials (Alshalif et al., 2021; Mahamat, Bih, et al., 2021; Savastano et al., n.d.; Soharu et al., 2022).
X-ray Diffraction (XRD) Analysis of Raw Materials and Optimized Composite
XRD was used to determine the crystalline phases of the raw materials used, which include clay, sand, rice husk, lime, and termite mound soil (TMS), and the bio-brick composite (as shown in Figures 13(a–f)). It is clear that each material contributes different mineralogical characteristics that influence the final properties of the bio-brick.
As shown in Figure 13a, the XRD profile of the clay showed characteristic peaks around 2θ = 12°, 20°, and 26°, which mainly consist of kaolinite, illite, and quartz phases. Such minerals are well known for their high plasticity and pozzolanic activity, which is needed for construction of earthen structures (Mahamat, Bih, et al., 2021; Soharu et al., 2022).
In the XRD profile of the sand shown in Figure 13b, there was a distinct diffraction peak at 2θ ≈ 26.6°, suggesting that the crystalline phase in the sand is mainly composed of quartz.
Rice husk XRD pattern (Figure 13c) depicted diffuse diffraction pattern characteristics ranging from 2θ = 20° to 35°, accompanied by minor crystalline peaks, indicating primarily amorphous silica along with quartz phases. Amorphous silica has the ability to undergo pozzolanic reactions and improve bonding behavior in the composite (Fruett et al., 2023; Gueye et al., 2023)
Lime (Figure 13d) XRD pattern exhibited intense diffraction peaks at 2θ = 29.4° and 39.4°, corresponding to calcite crystals, which are formed due to carbonation process during storage of lime. High content of calcium in lime acts as source of Ca2⁺ ions required for the stabilization of the composite (Malkanthi et al., 2020; Oti et al., 2009).
Termite mound soil (TMS) (Figure 13e) XRD pattern showed several diffraction peaks, indicating presence of quartz and iron-containing minerals, which could be attributed to the presence of aluminosilicate and oxide phases in TMS.
The XRD spectrum of the refined composite (Figure 13f) greatly differs from that of the individual constituents. Peaks corresponding to clay minerals have weakened while those corresponding to quartz have remained significant. Additionally, there was the existence of broader diffraction patterns within the wider 2θ range suggesting an increase in amorphous phases and occurrence of pozzolanic reaction among the composite components. However, XRD alone is not sufficient to prove the formation of amorphous calcium silicate hydrate (C–S–H) phases. Therefore, the results have been interpreted to suggest pozzolanic products and densification rather than as a confirmation of specific hydration products.
According to the XRD data, the combination of clay, sand, rice husk, lime, and TMS provided an ideal mineral composition containing both crystalline and amorphous phases. It is evident that this combination of phases gave good particle bonding and densification of the matrix, thus making the properties of bio-bricks more advantageous. These findings demonstrate the importance of proper raw material selection and its ratio in the formation of environmental bio-bricks.
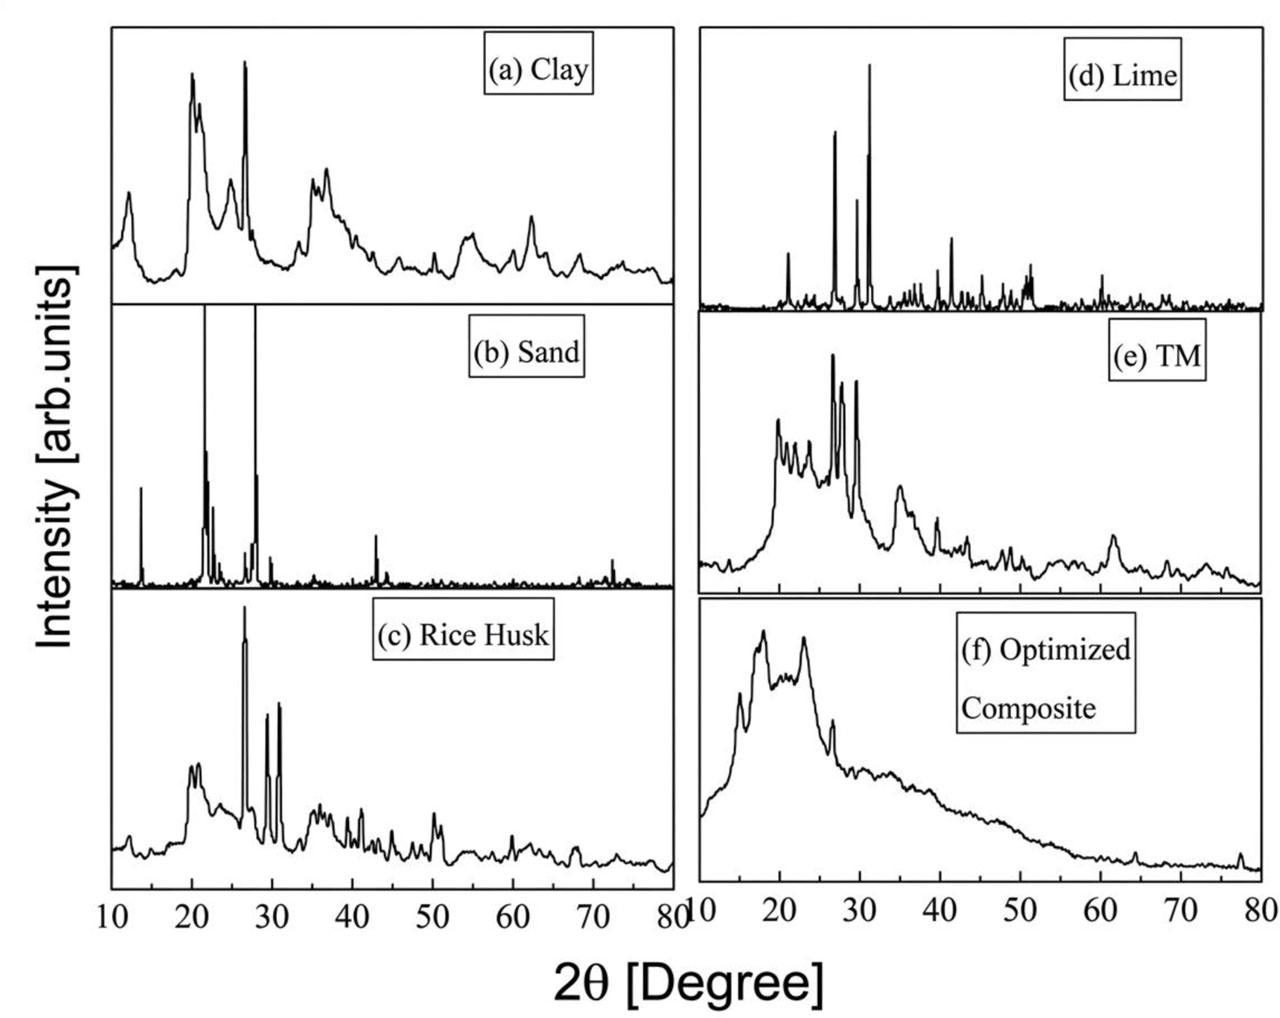
Figure 13:
XRD patterns of (a) clay, (b) sand, (c) rice husk, (d) lime, (e) termite mound soil (TMS), and (f) the optimized composite
Thermal Stability Analysis of Raw Materials and Optimized Bio-Brick Composite
Figure 14 represents the TGA curves of (a) clay, (b) sand, (c) powdered lime dried by sunlight, (d) termite mound soil (TMS), (e) rice husk, and (f) optimized composite. The insights gathered from the TGA data provide an indication of the thermal stability of the individual ingredients and optimized bio-brick composite material which is very significant in determining their suitability for construction purposes.
The clay exhibited relatively stable nature up to around 600 °C and then started losing mass gradually due to the process of dehydroxylation of the mineral phases of the clay minerals. Sand showed negligible loss of mass throughout the temperature range, indicating that it is highly thermally stable and contributes to the structural strength of the bio-brick composite matrix (Dr. A.M. Arun mohan et al., 2024).
The dried lime powder demonstrated remarkable weight loss between 600 °C and 800 °C, which was related to the dissociation of CaCO3 to CaO and CO2. Such decomposition indicates the existence of calcium-containing phases that can take part in the process of stabilization in the composite (Malkanthi et al., 2020). The rice husk displayed considerable weight loss at relatively low temperatures due to the decomposition of such organic materials as cellulose, hemicellulose, and lignin and gave rise to silica-containing residues contributing to the improvement of heat-insulating properties and pozzolanic activity (Haruna et al., 2024; Nzereogu et al., 2023). The same is true for the termite mound soil, which possesses excellent thermal stability as a result of its composition containing aluminosilicates and minerals.
The degraded curve of the composite had a multistep pattern within the temperature range of 24–900 °C. An early weight loss of 3.1% was observed within the temperature range of 24 and 92 °C, which is due to the evaporation of moisture adsorbed on the surface. In the next step, a weight loss of 6.3% was observed within the temperature range of 92 and 387 °C due to the decomposition of volatile organic content from rice husk and chemically bonded water from clay and TMS minerals. The highest weight loss of 12.23% occurred within the temperature range of 387 and 539 °C.
Beyond 539 °C, the composite exhibited only limited additional mass loss, indicating improved thermal stability due to the predominance of thermally stable phases such as silica, aluminosilicates, and metal oxides. Therefore, the term “thermal stability above 540 °C” refers to the substantially reduced rate of further decomposition beyond this temperature rather than complete stability throughout the heating process. The total mass loss up to 539 °C was approximately 21.63%, indicating a balanced proportion of organic and inorganic constituents that can provide adequate mechanical performance, thermal resistance, and sustainability for construction applications.
TGA analysis reveals that the combination of locally available materials such as clay, sand, rice husks, lime, and termite mound soil can produce bio-bricks with favorable thermal properties, hence reducing dependency on energy-intensive conventional construction materials.
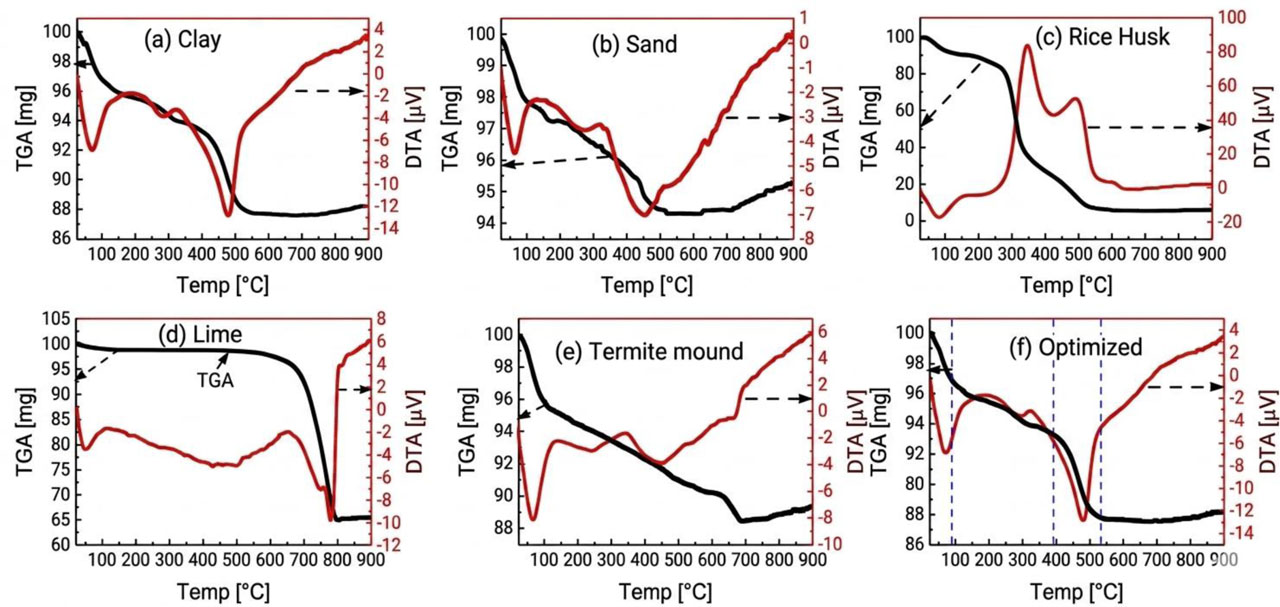
Figure 14:
(a) TGA for clay soil, (b) TGA for sand soil, (c), TGA for sun dried powder lime, (d) TGA for termite mound soil (e) TGA for sun dried powder rice husk and (f) TGA of optimized blend
3.4. Environmental Impact Assessment of Sustainable -Bricks vs. Traditional Bricks
Besides improved engineering performance, the sustainable bricks showed remarkably lower environmental effects compared to traditional fired clay bricks. Life cycle assessment (LCA), cradle to grave, involving the extraction of raw materials, production, transport, usage, and disposal phases showed considerably lower energy use and greenhouse gas emissions (Abd El-Hady & Mohamed, 2023; Jaramillo et al., 2025). In contrast to fired clay bricks that undergo heating in kilns up to 900–1100 °C and consume large amounts of fossil fuels, the new bricks used air and solar drying without energy-intensive heating and minimized embodied energy and CO2 footprint (Nath et al., 2018). Furthermore, the use of locally available termite mound soil and rice husk improved sustainability by utilizing waste resources and relying less on construction materials from industries.
As demonstrated in Table 6, the study conducted a comparative analysis of traditional clay bricks and sustainable bricks by evaluating their Global Warming Potential (GWP) across the entire production process.
Table 6:
Global warming potential (GWP) analysis of traditional bricks and Sustainable bricks
| Parameter | Traditional Bricks (GWP) | Sustainable-bricks (GWP) |
|---|---|---|
| Curing Method | Standardized solar curing | Kiln firing |
| Extraction & Preparation emission [kg CO2-eq] | 150 | 14 |
| Manufacturing emission [kg CO2-eq] | 450 | 0 |
| Transportation emission [kg CO2-eq] | 50 | 17.5 |
| End-of-Life biodegradability [kg CO2-eq] | 30 | 0 |
| Firing Temperature [°C] | 900–1100 | Not required |
| Total emission [kg CO2-eq] per [ton] | 680 | 31.5 |
| Carbon Reduction [%] | - | 95 |
The findings reveal that traditional clay bricks emit 150 kg of CO2-equivalent per ton during the extraction and preparation stages, primarily due to their energy-intensive manufacturing methods. In contrast, sustainable bricks exhibit a significantly lower GWP, producing only 14 kg of CO2-equivalent per ton. This substantial reduction is attributed to the use of agricultural waste as raw material and the adoption of energy-efficient production techniques. These results align with findings from previous research conducted by Dabaieh et al., (2020), further supporting the environmental benefits of sustainable brick alternatives.
The situation got worse for traditional bricks during manufacturing. Firing in kilns alone added 450 kg CO2-eq per ton. Sustainable bricks avoided the kiln and instead used natural drying, reducing emissions to nearly zero. Transporting the bricks is another key point. Traditional bricks tacked on 50 kg CO2-eq per ton during transportation, while sustainable bricks limited this to 17.5 kg, largely because they source materials locally. The end-of-life phase is the final step. Traditional bricks don't recycle easily, so they emitted another 30 kg CO2-eq per ton here. In contrast, sustainable bricks are biodegradable or easy to recycle, meaning emissions at this stage are almost nothing. When you total everything up, the difference is clear. Traditional bricks have a total GWP of 680 kg CO2-eq per ton. Sustainable bricks are much lower at just 31.5 kg and that’s a 95% reduction in GWP simply by switching to the sustainable alternative.
4. Discussion
4.1. Interpretation of Results
The study highlights the significant implications of using fine particles in clay, lime, and termite mound soil (TMS) for sustainable brick production. The particle size distribution analysis confirms a high proportion of fine particles, enhancing plasticity and workability, consistent with findings by (Ferreira, Pereira, et al., 2023). The research underscores the mechanical benefits of optimizing mix designs with lime and TMS, noting that increased lime content improves compressive strength and reduces water absorption, as supported by (Bakker et al., 2020). However, excessive rice husk content may decrease strength due to increased porosity, aligning with observations by (Malkanthi et al., 2020). The optimal composition achieves a compressive strength of 7.56 MPa and a water absorption rate of 14.15%, surpassing conventional clay bricks.
The study's findings emphasize the potential of optimized bio-bricks as a sustainable, high-performing alternative to traditional construction materials. The optimal composition—comprising 45% clay, 22% sand, 15% rice husk, 12% lime, and 6% termite mound soil—achieved superior performance metrics compared to conventional clay bricks and cement blocks. The water absorption rate also meets the ASTM C67 durability requirement, validating its suitability for construction applications.
The significant reduction in water absorption is attributed to lime incorporation, with regression analysis showing a negative correlation with porosity. This finding aligns with (Ramesh et al., 2023), who demonstrated that lime enhances moisture resistance through pozzolanic reactions, forming calcium silicate hydrates (C–S–H) that reduce porosity and improve durability. Lime's positive impact on compressive strength is corroborated by its ability to minimize micro-voids and enhance cohesion within the composite matrix.
SEM and XRD analyses reveal a well-integrated microstructure with improved interparticle bonding, consistent with studies by (Mahamat, Obianyo, et al., 2021), emphasizing termite mound soil's role in enhancing mechanical properties. TGA analysis demonstrates the bio-brick composite's thermal stability, indicating its suitability for construction purposes. The combination of organic and inorganic constituents provides adequate mechanical performance and thermal resistance.
In addition to lime, termite mound soil improves the density and binding properties of the composite material, aligning with findings by (Mahamat, Obianyo, et al., 2021). The integration of rice husk further complements these improvements by providing mechanical reinforcement and thermal insulation, as highlighted by (Gbadeyan et al., 2023). Rice husk's fibrous nature contributes to increased tensile strength and thermal efficiency.
The study also highlights the environmental advantages of bio-bricks. Compared to traditional fired clay bricks with a GWP of 680 kg CO2-equivalent per ton, the optimized bio-bricks achieve a 95% reduction in GWP at just 31.5 kg CO2-equivalent per ton. This significant decrease is due to eliminating energy-intensive kiln firing and using locally sourced, low-carbon materials like rice husk and termite mound soil. These findings align with studies by (Dabaieh et al., 2020; Osman et al., 2023), emphasizing sustainability benefits.
This research addresses key limitations identified in earlier studies regarding water absorption and mechanical performance of bio-bricks compared to conventional materials (Dr.A.M.Arun mohan et al., 2024; Naveen et al., 2020). By optimizing the mix design and leveraging the synergistic effects of lime, termite mound soil, and rice husk, this study demonstrates significant improvements in durability and water resistance. It establishes that bio-bricks meet or exceed performance standards of many conventional alternatives.
The research provides evidence for using locally available materials to produce cost-effective, environmentally sustainable bio-bricks. These findings offer a practical solution for addressing housing challenges while reducing environmental impact, making bio-bricks a promising alternative for sustainable construction in regions like Ethiopia and beyond. Future research should address limitations such as sample size and regional variations in raw material properties to ensure broader applicability.
Overall, this study presents compelling evidence for the viability of using locally available materials such as rice husk, lime, and termite mound soil to produce cost-effective and environmentally sustainable bio-bricks. These findings offer a practical pathway for addressing housing challenges while reducing environmental impact, making bio-bricks a promising solution for sustainable construction in regions like Ethiopia and beyond.
4.2. Interpretation of Results
The findings presented in the study highlight the significance of particle size distribution and geotechnical properties in determining the suitability of raw materials for sustainable brick production. The analysis of clay, lime, and termite mound soil (TMS) revealed a high proportion of fine particles, particularly in clay, which exhibited 85% passing through Sieve No. 200. This characteristic is advantageous for brick manufacturing due to improved plasticity and bonding capabilities. The geotechnical properties, including specific gravity and moisture content, further supported the suitability of these materials, with clay showing higher density and better compaction efficiency than TMS.
The experimental design utilized a two-way ANOVA to evaluate the effects of varying lime and TMS percentages on water absorption and compressive strength. The results indicated that Scenario 2 outperformed others, achieving the lowest water absorption (16.49%) and highest compressive strength (6.99 MPa). The optimal composition (sample S2-1) consisted of 45% clay, 22% sand, 15% rice husk, 12% lime, and 6% TMS, demonstrating superior durability and structural integrity compared to traditional clay bricks.
The response surface methodology highlighted the interactive influence of mixture proportions on mechanical performance, with optimal compressive strength achieved by decreasing the clay-to-sand ratio and maintaining moderate rice husk content. The addition of lime and TMS enhanced performance by reducing water absorption and increasing compressive strength through pozzolanic reactions.
Microstructural analysis using SEM and XRD confirmed the cohesive matrix formation in the optimized composite, with strong interfacial bonding between components contributing to enhanced compressive strength. The thermal stability analysis demonstrated that the composite maintained its integrity up to 540°C, indicating its suitability for construction applications.
4.3. Limitations
The research lacks an evaluation of the scalability of producing bio-bricks at a commercial volume, with findings limited to small-scale laboratory settings. This presents a significant limitation to commercialization, as the practical, long-term, and financial implications of large-scale production remain unaddressed. Furthermore, the absence of industry-accepted, universal testing standards prevents the material's adoption in construction, as there are no uniform benchmarks for quality or structural performance. Establishing standardized testing is essential to ensure safety compliance and facilitate widespread industry acceptance of bio-bricks as a sustainable material.
5. Conclusion
The study emphasizes the critical role of particle size distribution and geotechnical properties in evaluating raw materials for sustainable brick production. It identifies clay, lime, and termite mound soil (TMS) as suitable components due to their high fine particle content, which enhances plasticity and bonding. The research utilizes a two-way ANOVA to determine the optimal mix of these materials, achieving the lowest water absorption and highest compressive strength with a composition of 45% clay, 22% sand, 15% rice husk, 12% lime, and 6% TMS. This composition significantly surpasses traditional clay bricks in durability and structural integrity.
Microstructural analysis confirms strong interfacial bonding and thermal stability up to 540°C, indicating suitability for construction. The study also highlights the environmental benefits, with sustainable bricks showing a 95% reduction in Global Warming Potential compared to traditional fired clay bricks.
Future research should focus on scaling up production to assess economic viability and establishing universal standards for bio-brick testing. Conducting a detailed feasibility study will provide insights into large-scale production challenges and opportunities, facilitating commercialization and contributing to sustainable construction practices.
Acknowledgements
The authors extend their gratitude to the Jimma Institute of University for providing research facilities that greatly supported this work. It is noted that this investigation did not receive any financial support from any organization.
Notes
[3] Contributed by Author Contributions
All authors reviewed and agreed to the final manuscript for publication. Author Contribution Statement: D.B.W conducted all the experimental work, collected the data, performed the analysis, and drafted the initial manuscript. M.A.M and D.M.A. contributed to the research design, redrafted the manuscript to meet journal standards, and participated in the discussion of key findings. All authors read and approved the final manuscript.
[4] Financial disclosure Disclosure of Interest
Conflict of interest: The authors declare that they have no known competing financial interests or personal relationships that could have appeared to influence the work reported in this paper.
[5] Data Availability Statement
The datasets generated and/or analyzed during the current study are available from the corresponding author upon reasonable request. The authors confirm that all data supporting the findings of this study are included within the article and/or its supplementary materials.