

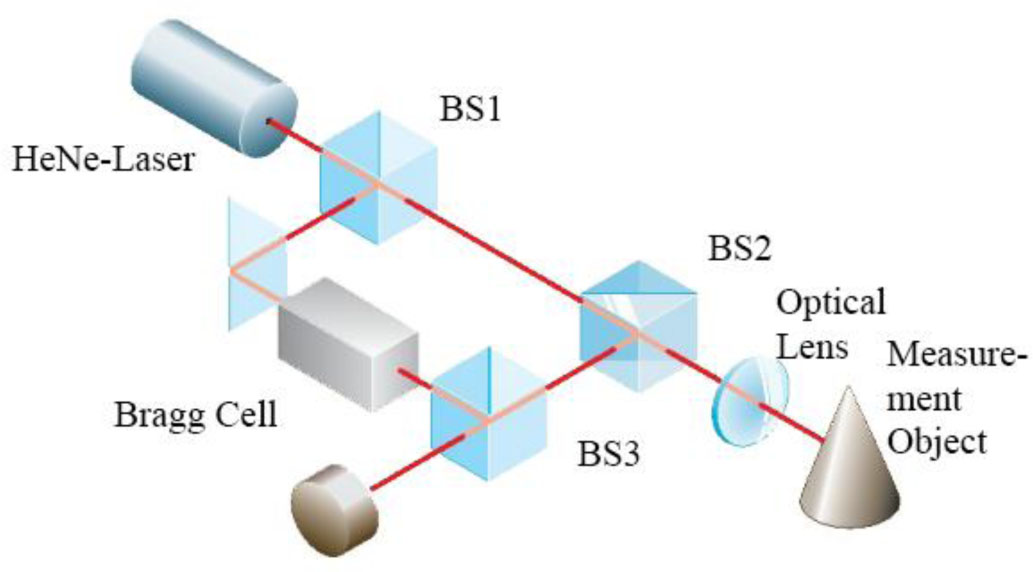
Figure 1:
Schematic of the LDV working principle
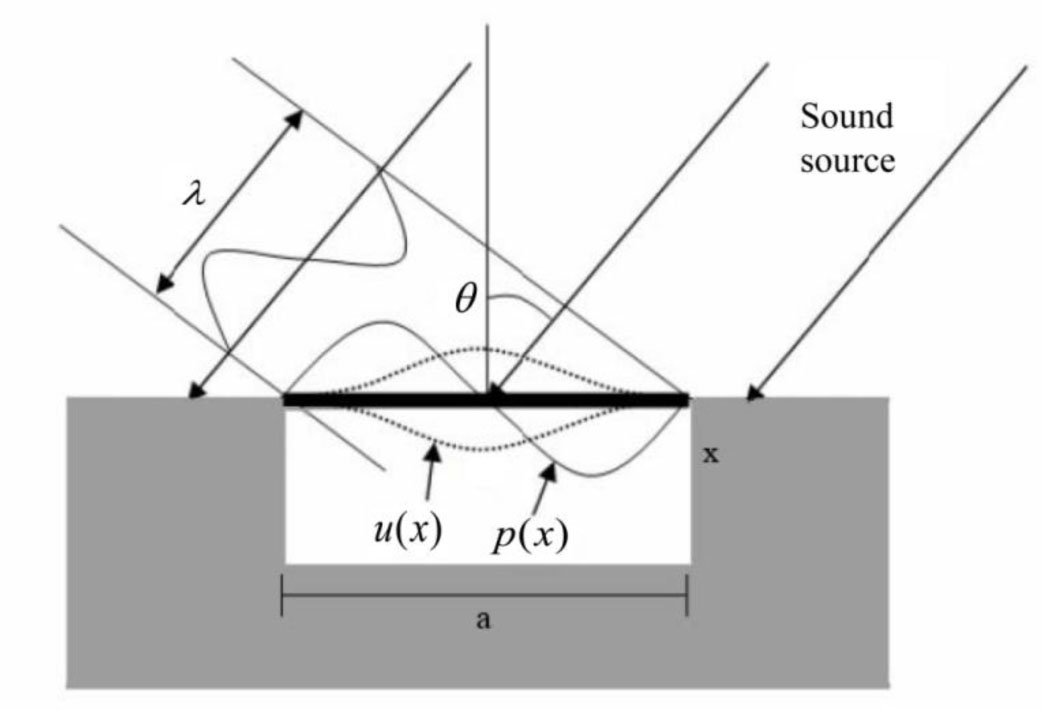
Figure 2:
Schematic of acoustic incident angle θ and resulting vibration amplitude u(x)
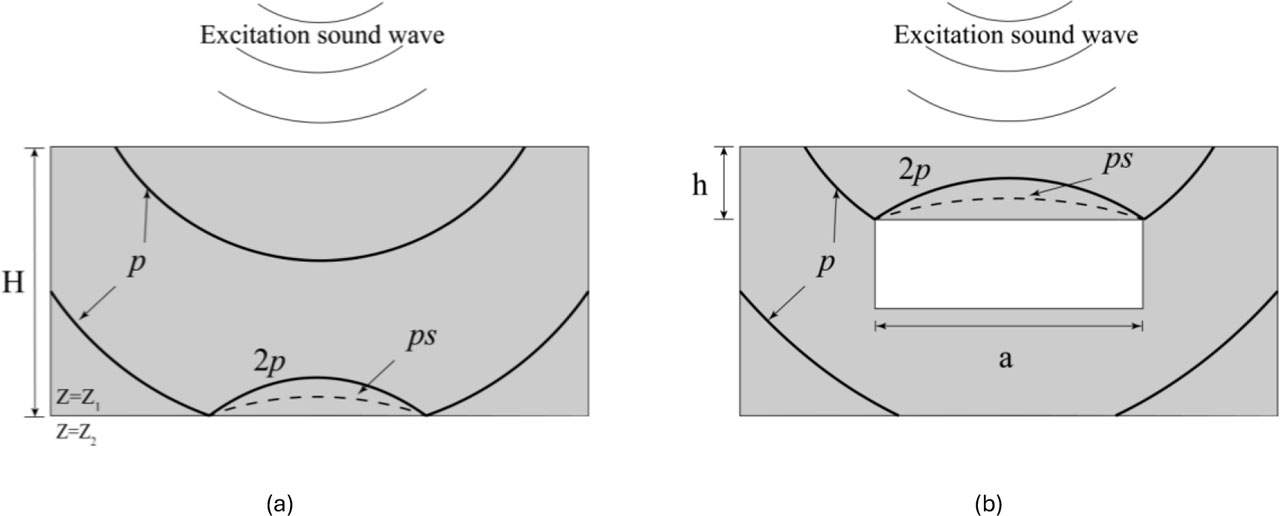
Figure 3:
Acoustic wave reflection and mode conversion at (a) the specimen backwall and (b) an internal cavity interface
Table 1:
Wave impedance coefficients of air and concrete
| Material | Wave impedance coefficients |
|---|---|
| Air | 0.4 |
| Concrete | 7×10⁶∼12×106 |
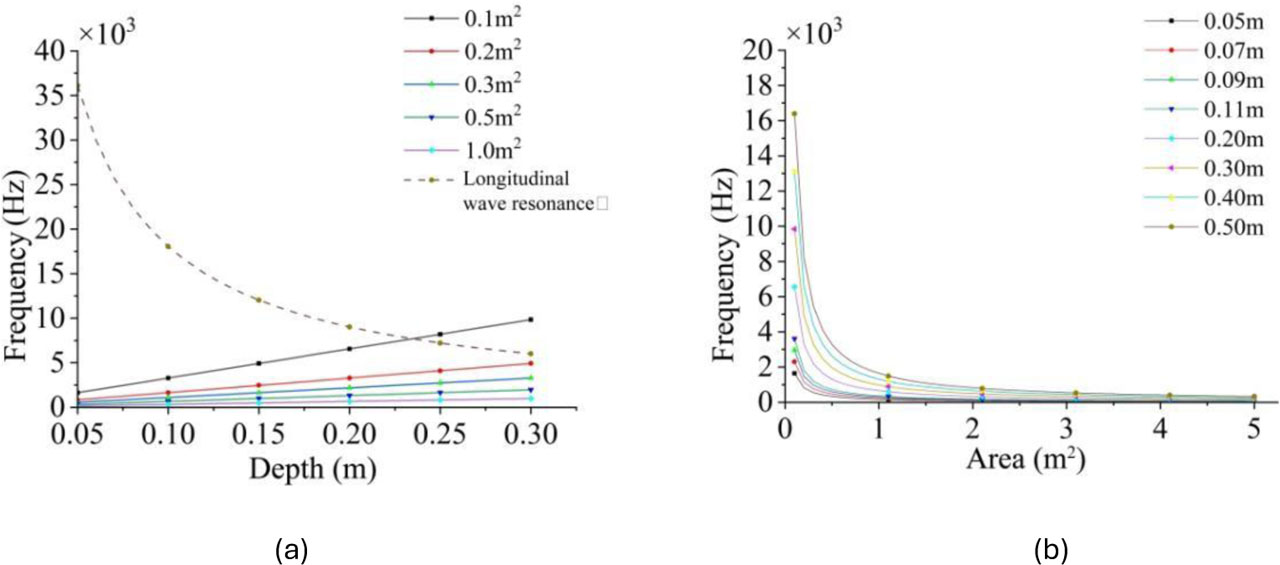
Figure 4:
Relationship among cavity area, depth, and bending vibration frequency: (a) Bending vibration frequency of concrete above cavities at different depths; (b) Relationship between cavity area and the bending vibration frequency of the concrete above
Table 2:
Mix proportion of C30 concrete (kg/m3)
| Materials | Cement | Water | Sand | Gravel | Water-Reducing Agent |
|---|---|---|---|---|---|
| Mix proportions | 350 | 175 | 690 | 1050 | 2.1 |
Table 3:
Working condition settings
| Dimensions (L×W×H) | Cavity diameter a [mm] | Depth from surface [h] | |
|---|---|---|---|
| Specimen 1 | 400×300×300 | 100 | 20 |
| Specimen 2 | 500×400×300 | 200 | 20 |
| Specimen 3 | 600×500×300 | 300 | 20 |
| Specimen 4 | 600×500×300 | 300 | 50 |
| Specimen 5 | 600×500×300 | 300 | 80 |
| Specimen 6 | 600×500×300 | No Cavity, Solid Specimen | |
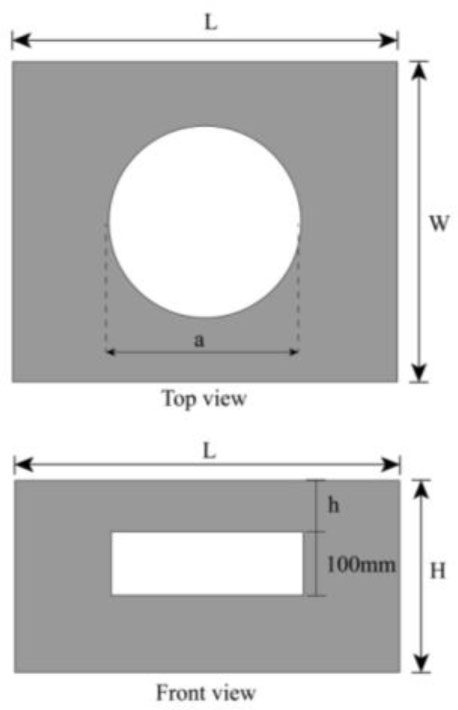
Figure 5:
Schematic diagram of the specimen
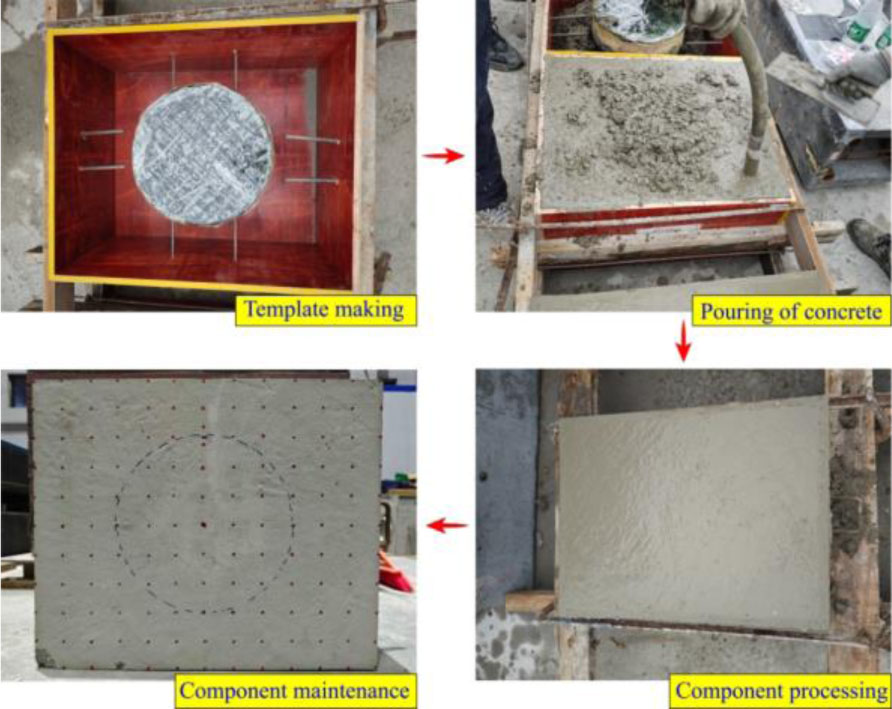
Figure 6:
Concrete specimen casting process
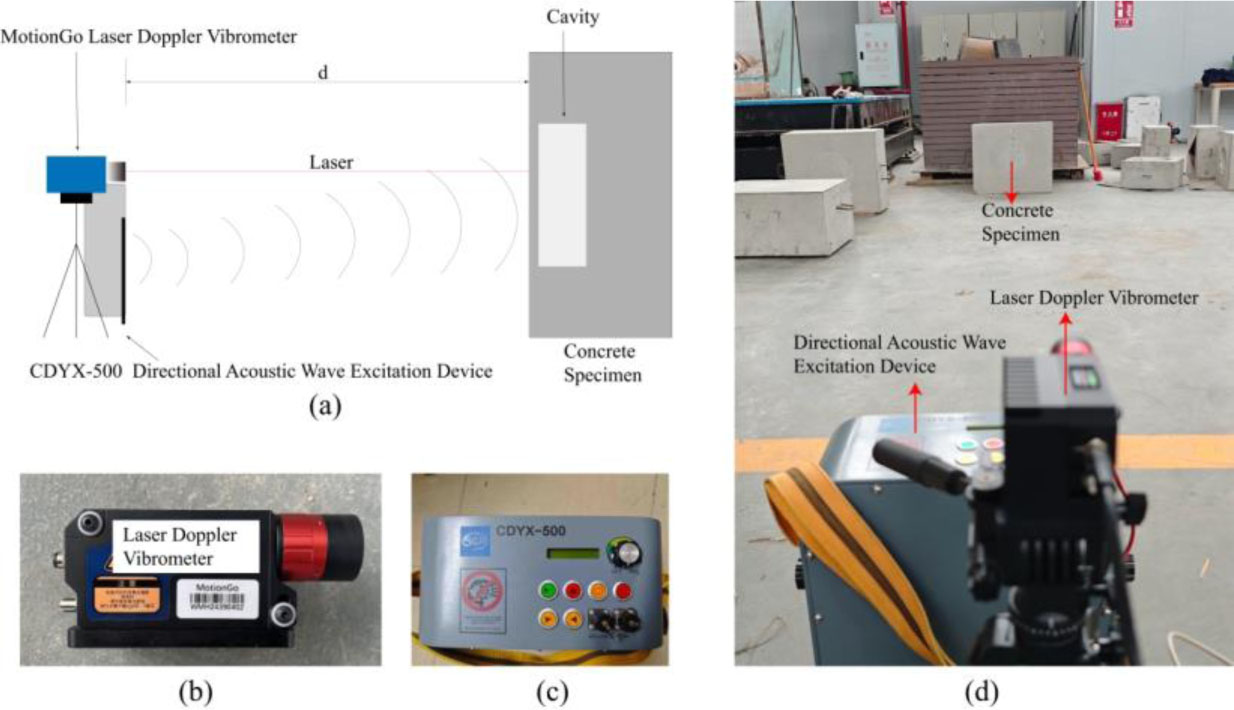
Figure 7:
Schematic diagram of test equipment layout: (a) LDV detection test diagram; (b) Laser doppler vibrometer; (c) Directional acoustic wave excitation device; (d) Layout diagram of on-site test equipment
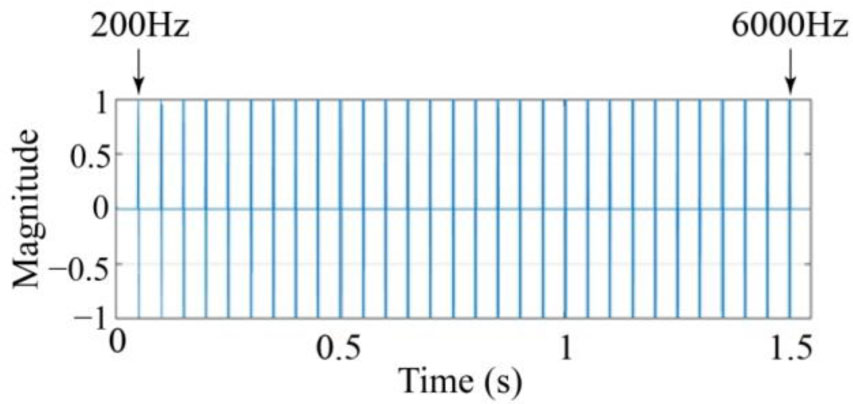
Figure 8:
Audio signal diagram of the acoustic excitation device
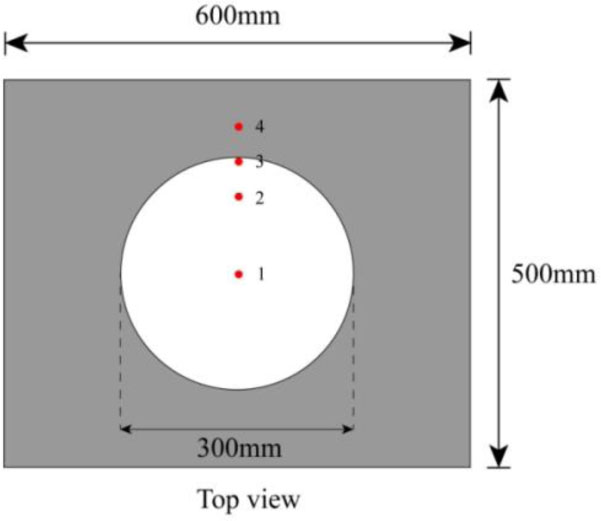
Figure 9:
Measurement point layout diagram
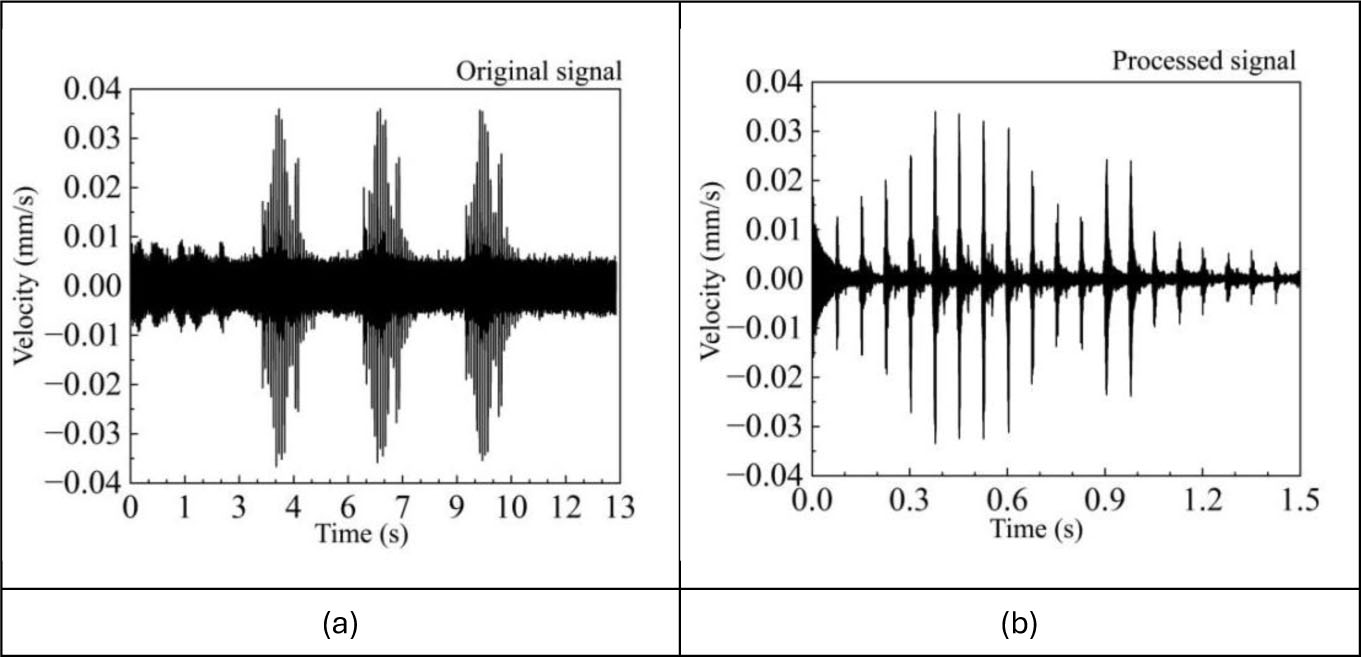
Figure 10:
Comparison of time-domain signals before and after processing: (a) Original signal; (b) Processed signal
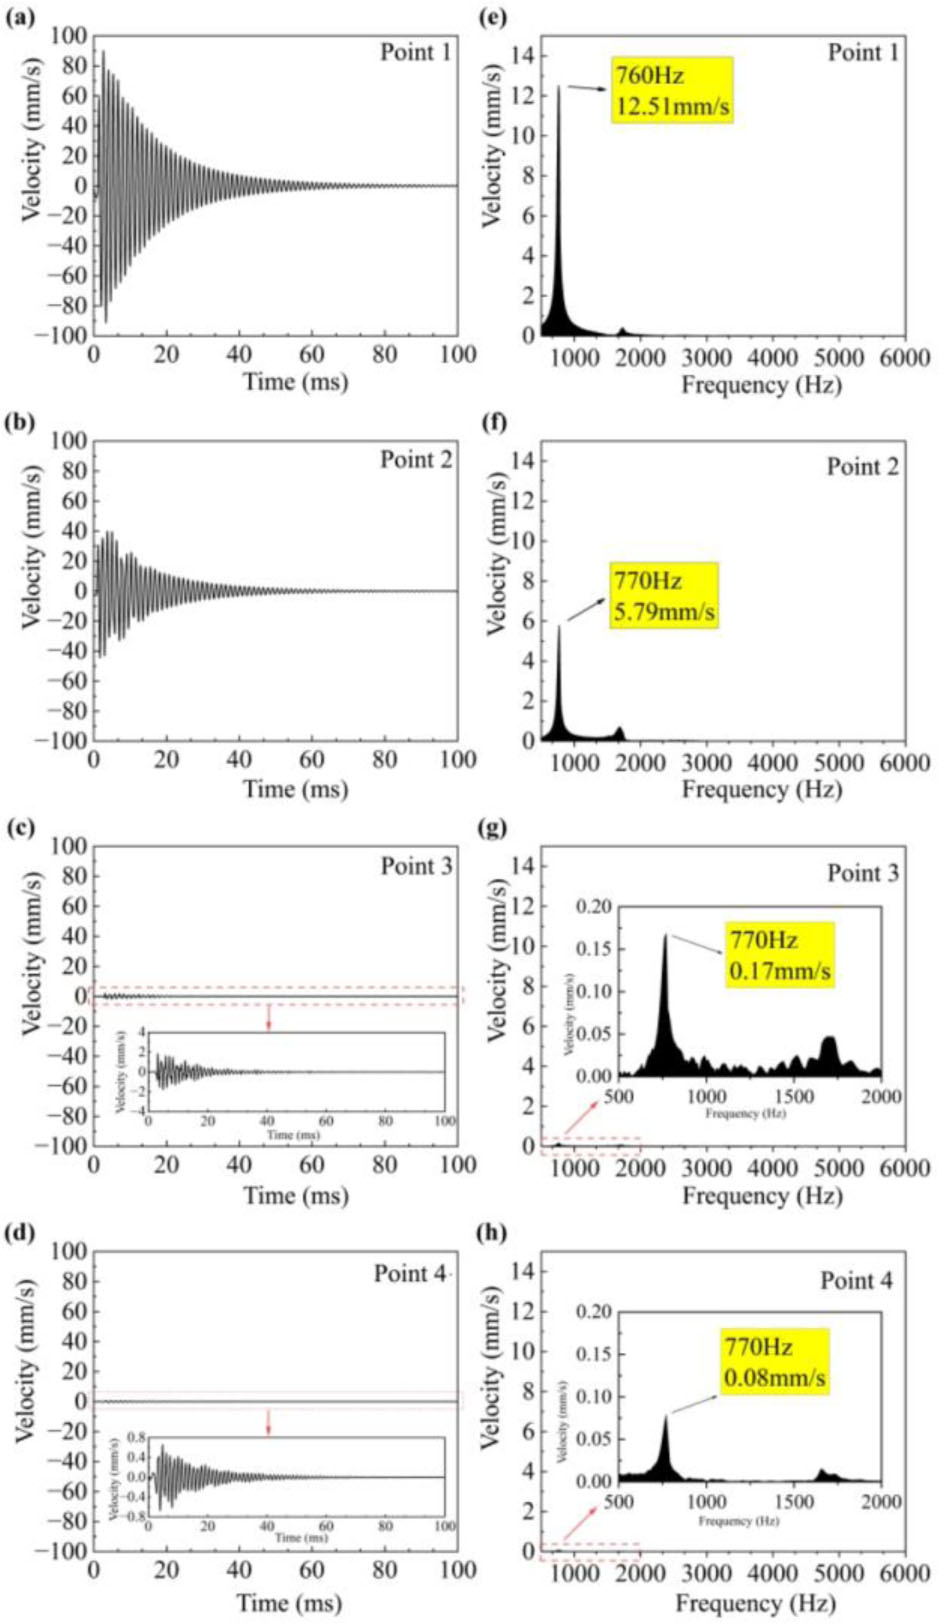
Figure 11:
Time-domain and frequency spectrum analysis of Specimen 3 at points 1–4 under impulsive hammer excitation
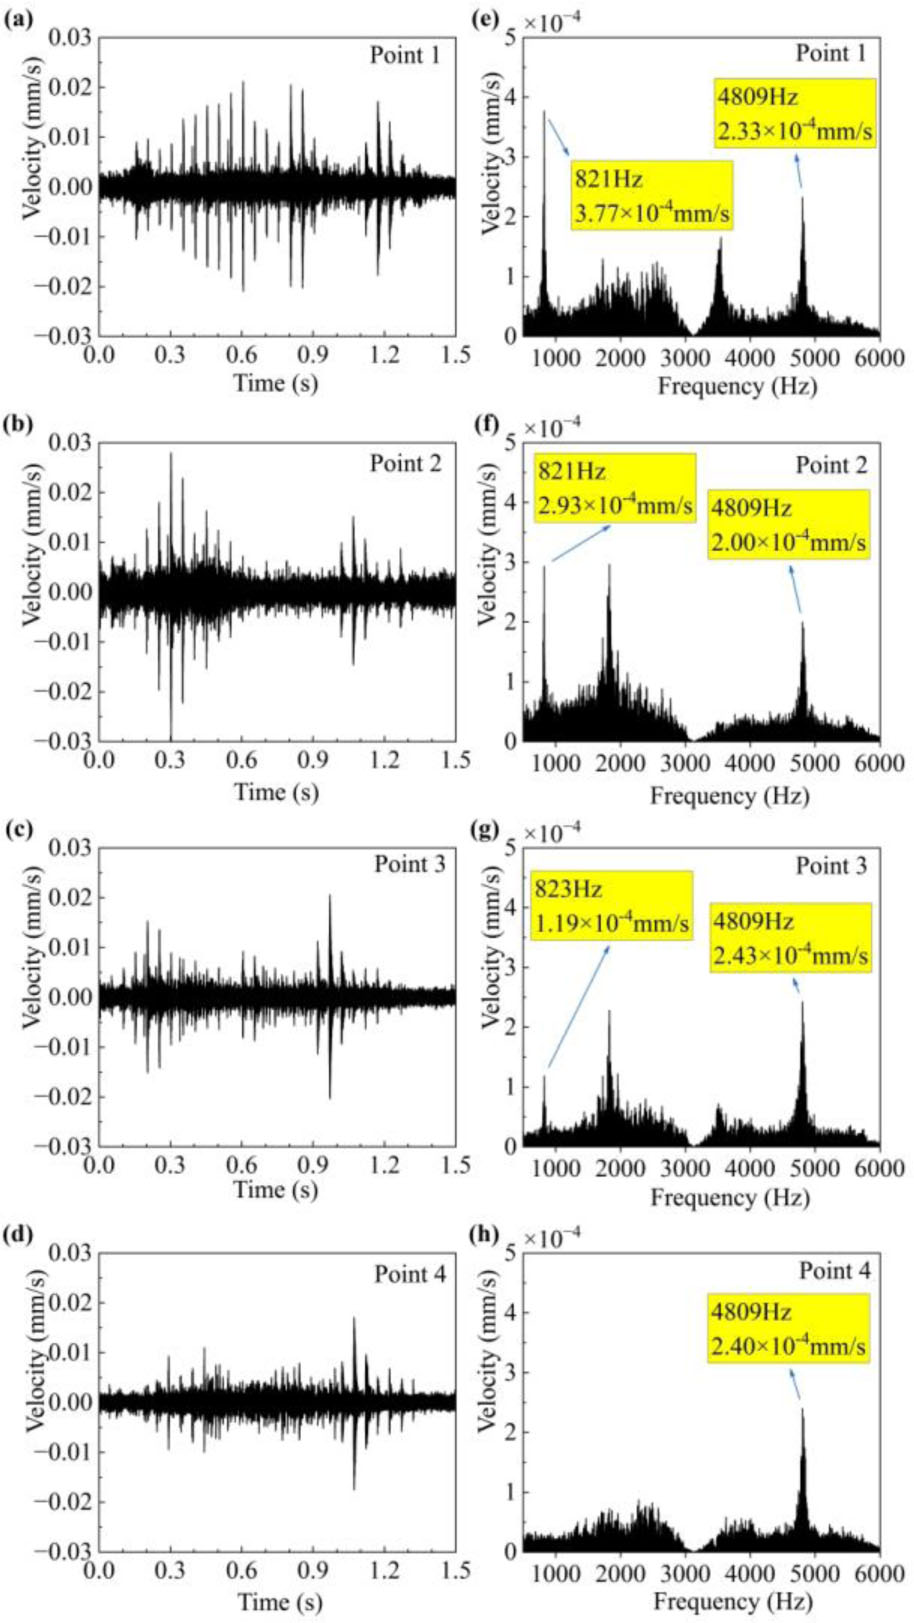
Figure 12:
Time-frequency spectrum analysis at different measurement points under remote acoustic excitation
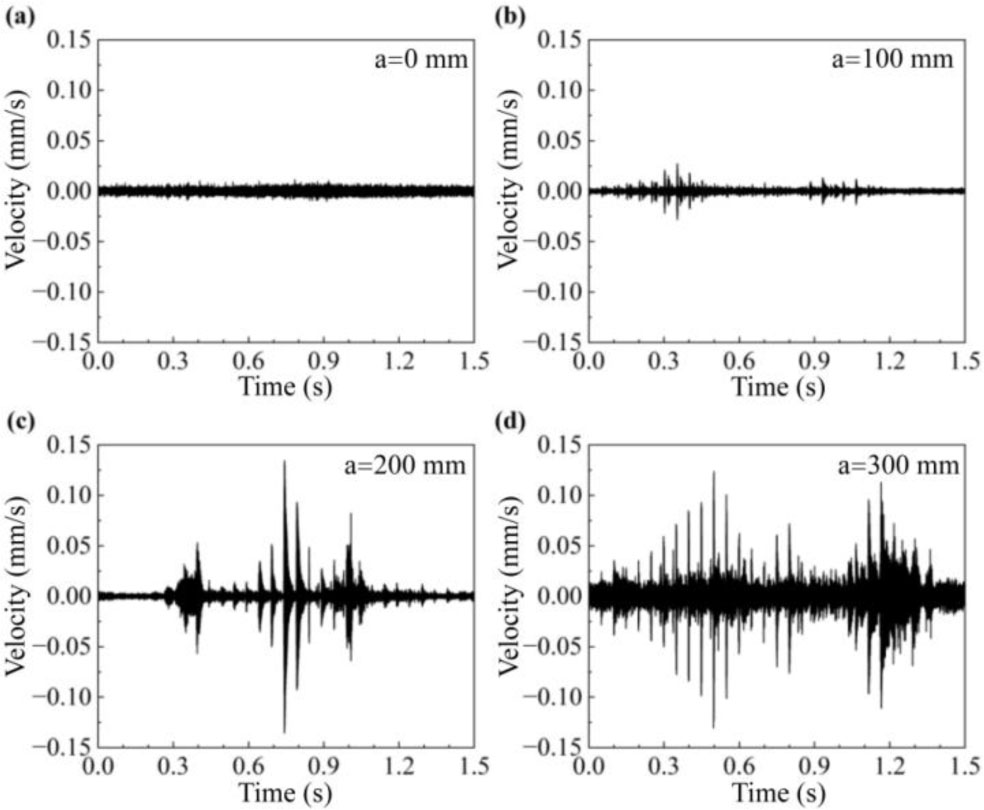
Figure 13:
Time-domain signals for different cavity sizes
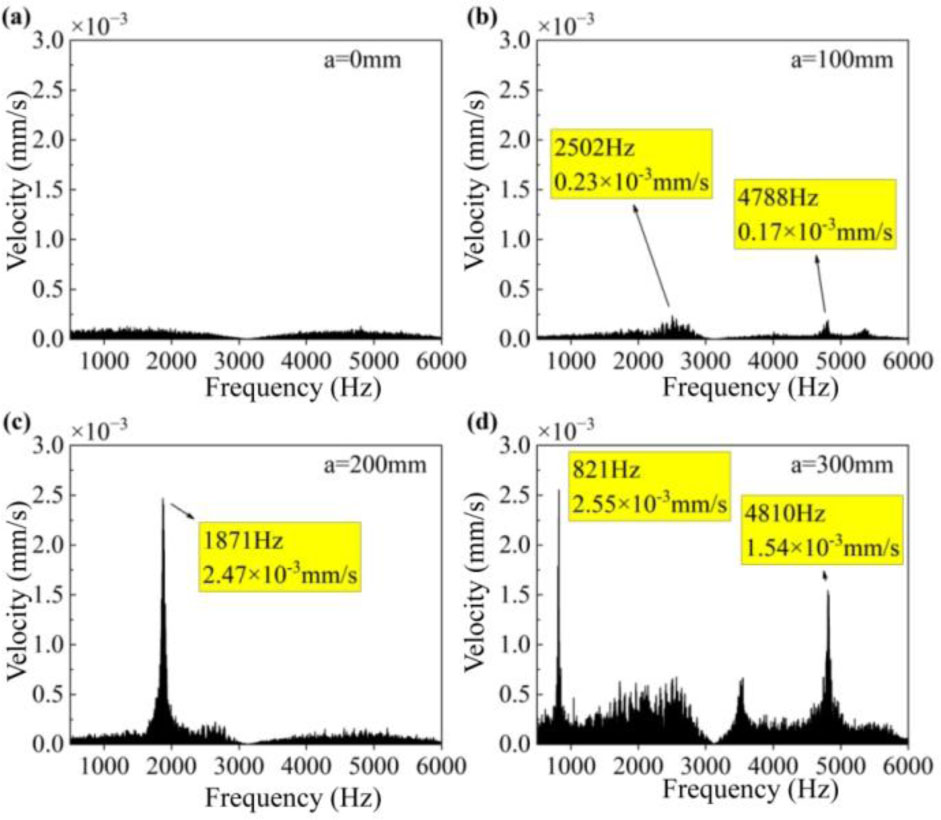
Figure 14:
Frequency spectra for different cavity sizes
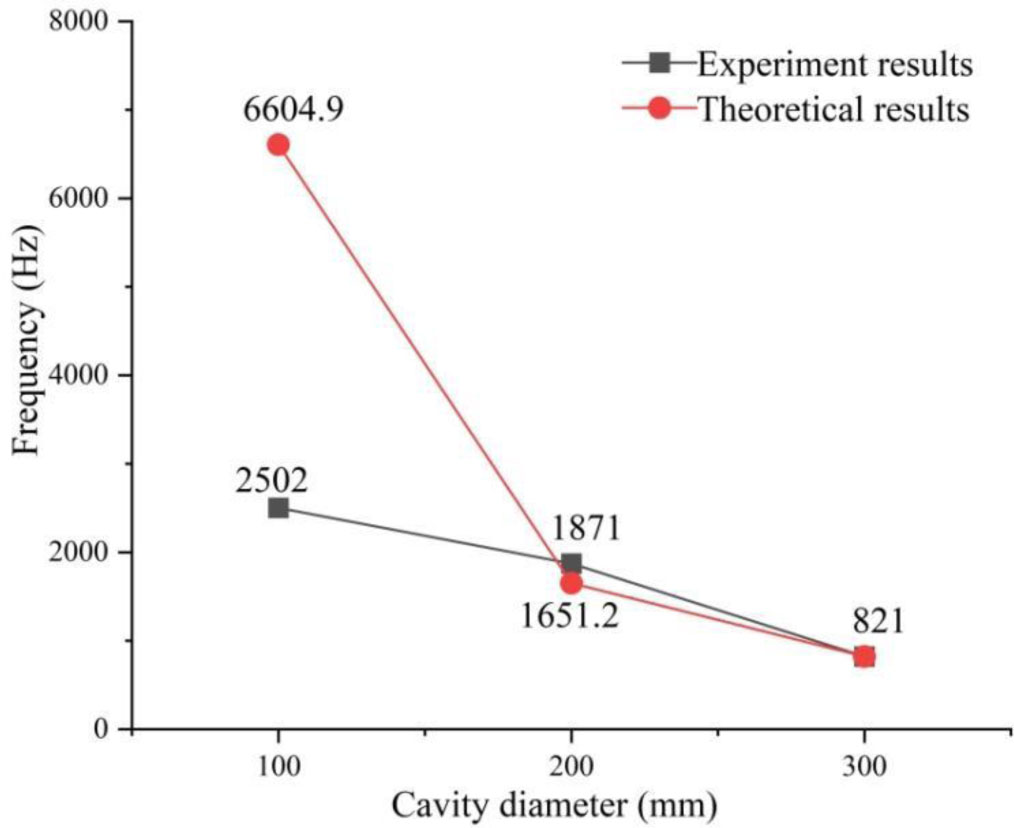
Figure 15:
Comparison of theoretical and experimental results on the effect of cavity diameter on frequency
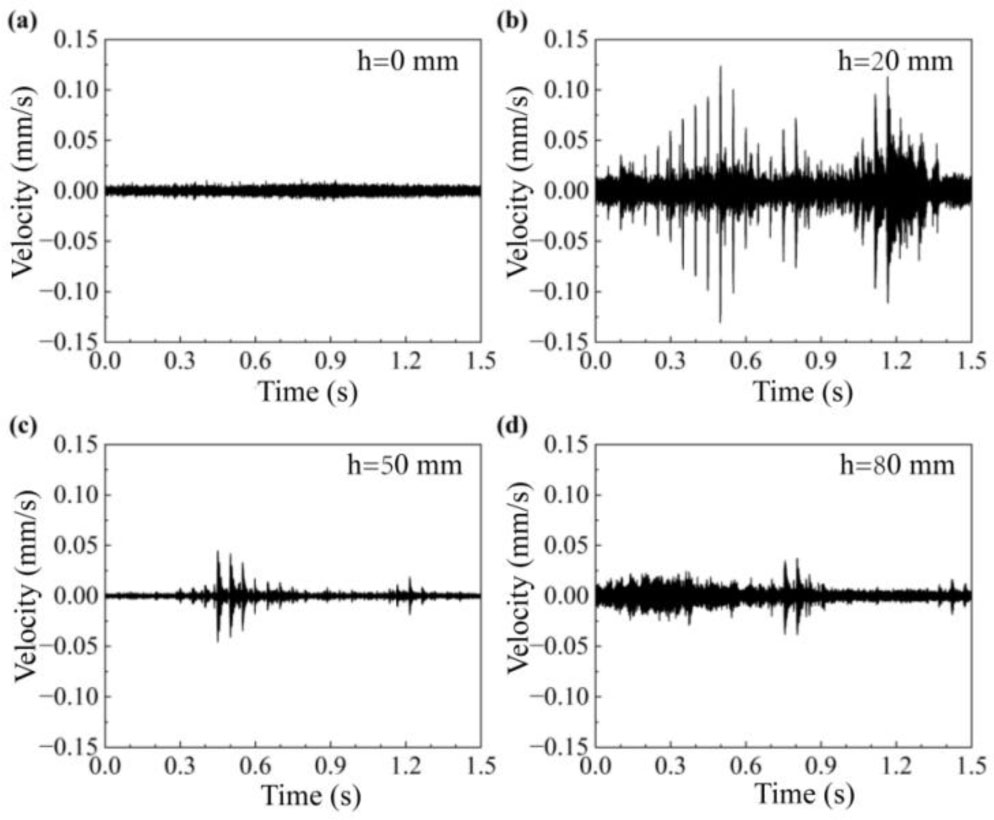
Figure 16:
Time-domain signals for different cavity depths
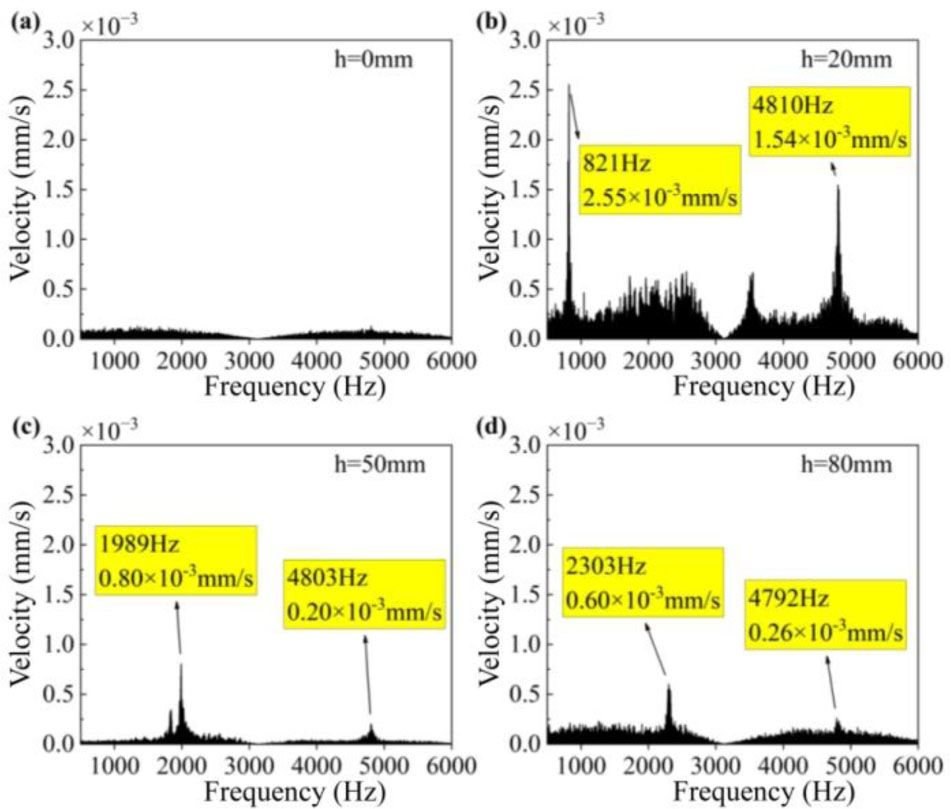
Figure 17:
Frequency spectra for different cavity depths
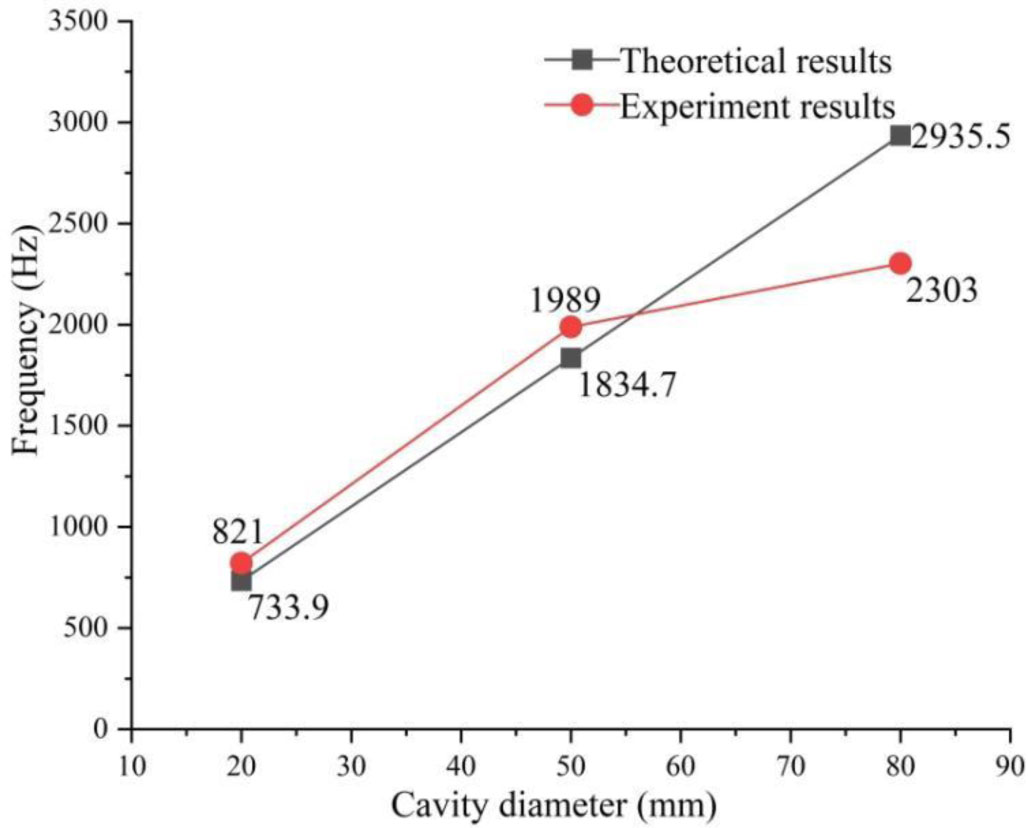
Figure 18:
Comparison of theoretical and experimental results on the effect of cavity depth on frequency
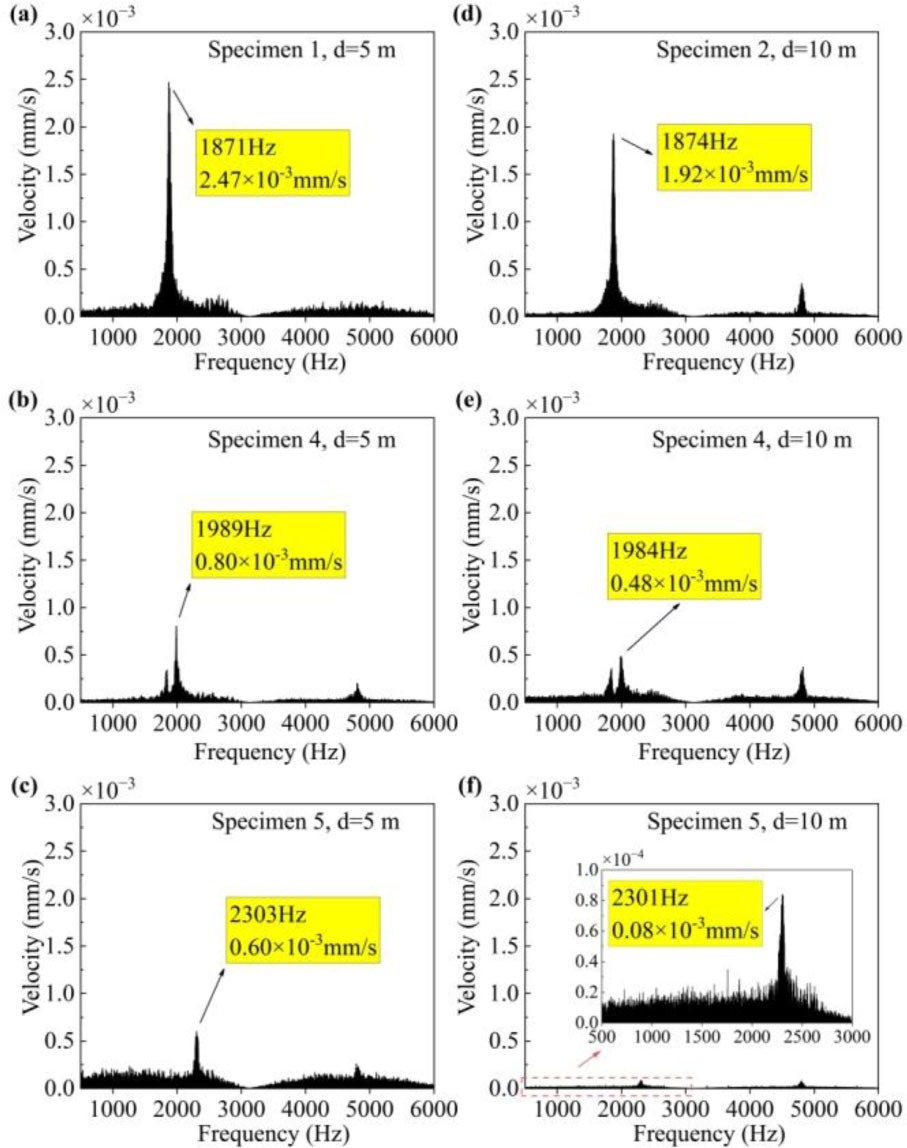
Figure 19:
Comparison of frequency spectra at different detection distances
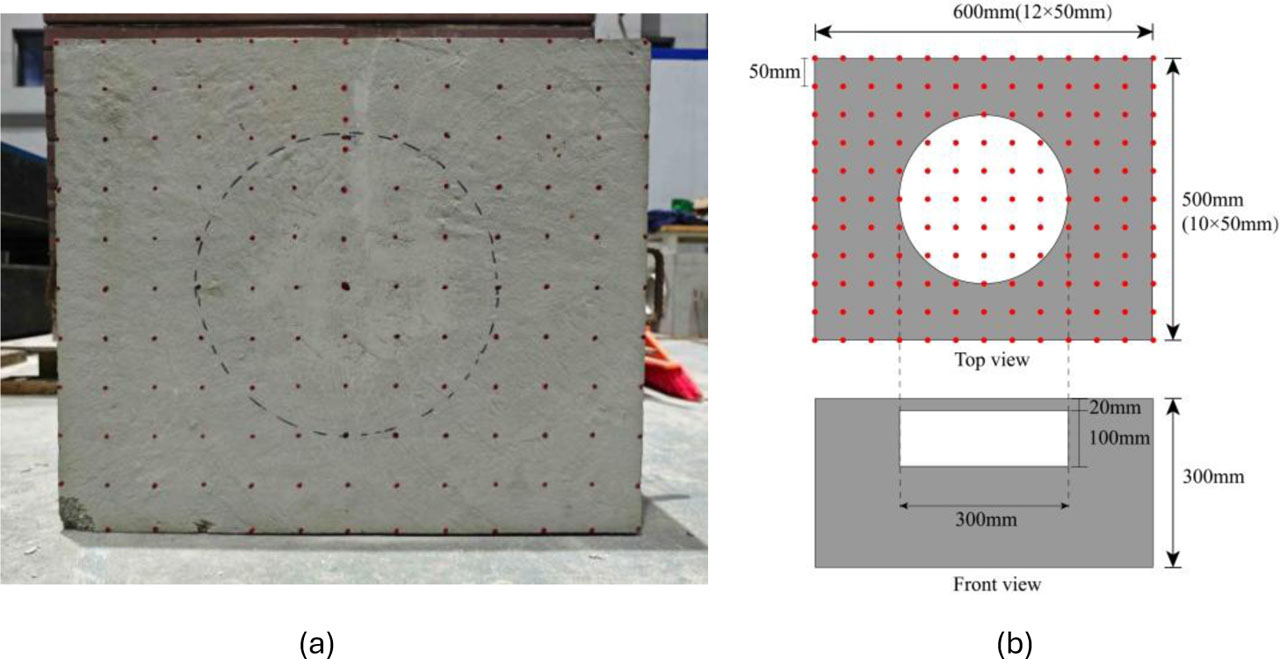
Figure 20:
Measurement point layout of the concrete specimen: (a) Photograph of the concrete specimen; (b) Layout of measurement points
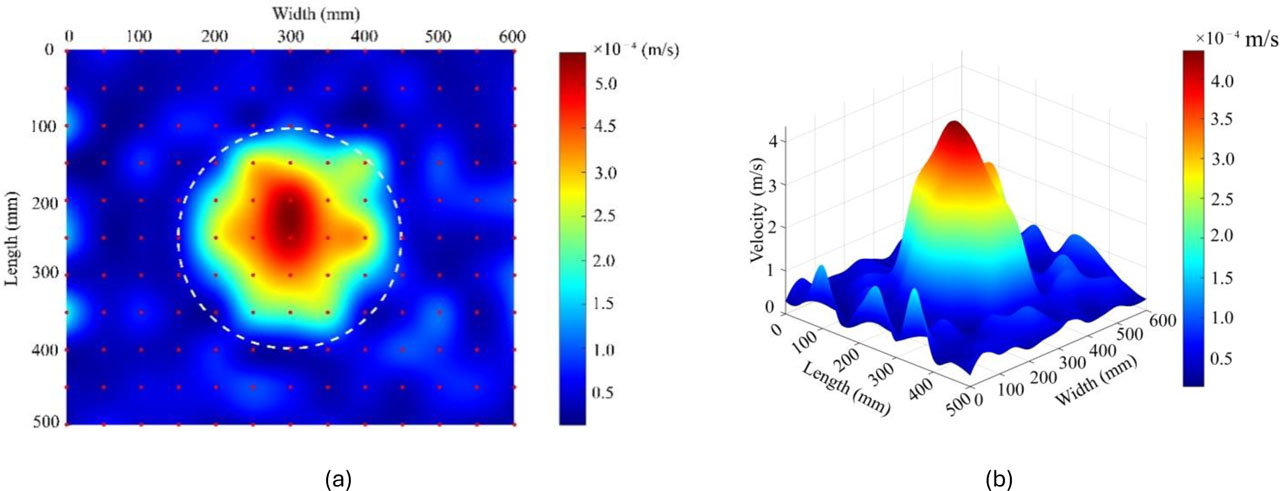
Figure 21:
Distribution characteristics of surface vibration velocity on the concrete specimen. (a) 2D Distribution (b) 3D distribution