

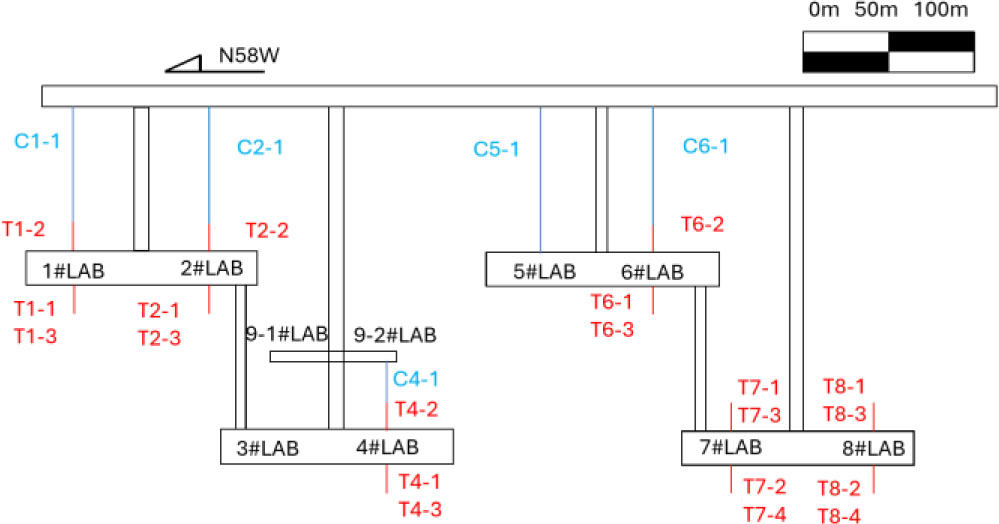
Figure 1:
Drilling layout diagram of laboratory
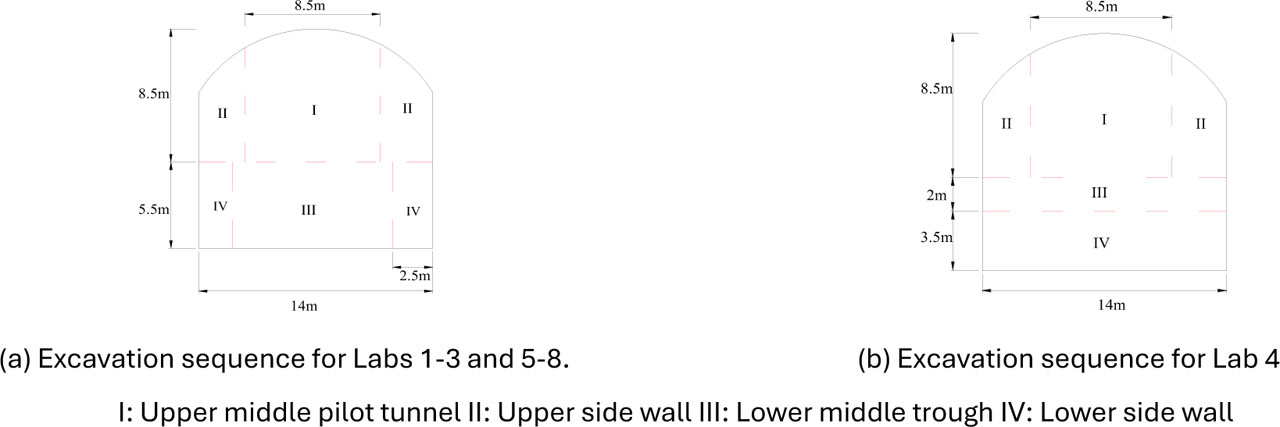
Figure 2:
Schematic illustration of the laboratory excavation steps
Table 1:
RMIBT-Based rock mass structure classification standards
| Grade | Rock mass structural types | Rock mass structural characteristics | RMIBT value[-] |
|---|---|---|---|
| I | Highly intact rock mass | Structural planes not developed, spacing > 100 [cm] | 0.9–1 |
| III | intact rock mass | Structural planes slightly developed, generally 1–2 sets, spacing generally 70–100 [cm] | 0.75–0.9 |
| III | Fairly intact rock mass | Structural planes moderately developed, generally 2–4 sets, spacing generally 40–70 [cm] | 0.5–0.75 |
| IV | Poorly intact rock mass | Structural planes poorly or well developed, generally 4–6 sets, spacing generally 20–40 [cm] | 0.25–0.5 |
| V | Broken rock mass | Structural planes extremely developed, spacing generally < 20 [cm] | 0–0.25 |
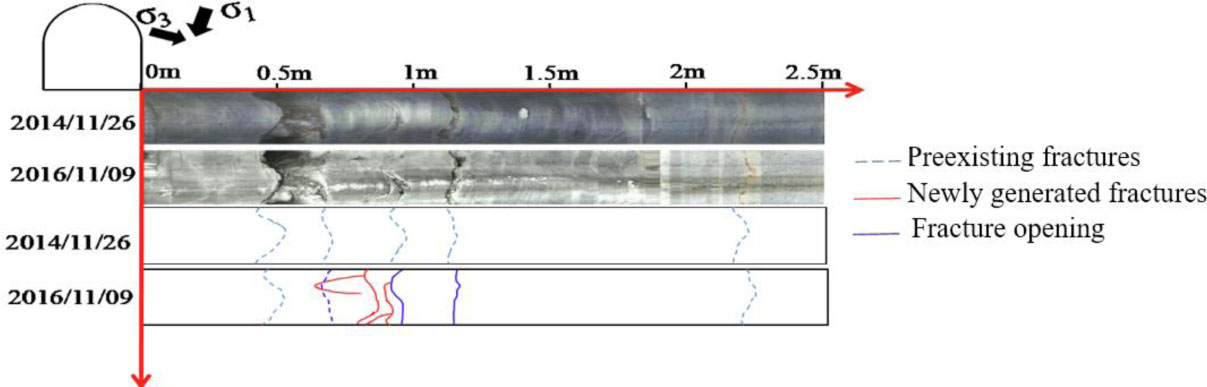
Figure 3:
Comparison of drilling camera results at different times after excavation
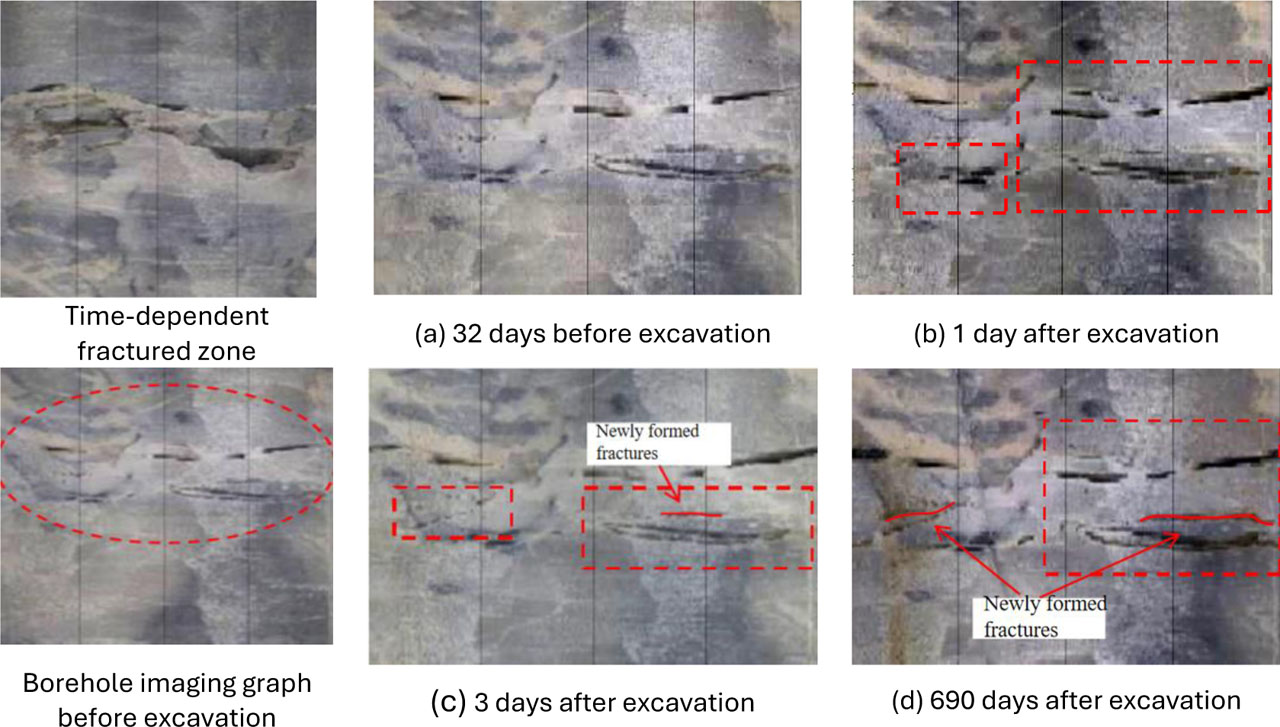
Figure 4:
Fracture aging fracture diagram of experimental chamber with hole depth of 16~18 m
Table 2:
Key parameters of different lithologies
| Lithology | Uniaxial Compressive Strength [MPa] | RMIBT Value [-] | Damage Ratio R [-] |
|---|---|---|---|
| Black-gray striped fine-grained marble | 80–190 | 0.75–0.90 | 1.93 |
| Black-gray fine-grained marble | 150–170 | 0.75–0.90 | 2.01 |
| Gray-white marble | 80–120 | 0.50–0.75 | 1.42 |
| Polychrome marble | 60–120 | 0.50–0.75 | 1.60 |
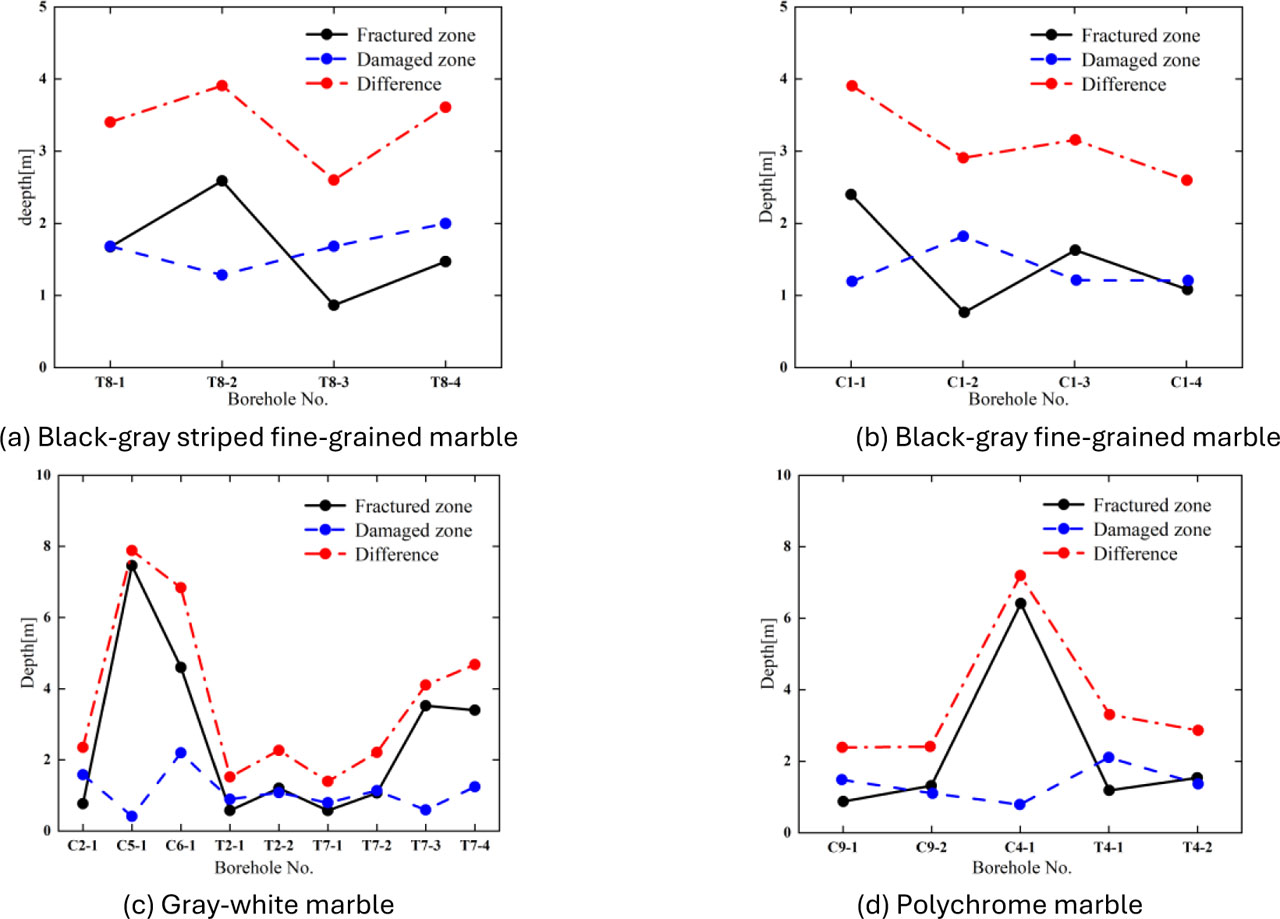
Figure 5:
The rupture zone and damage zone depth of different types of rock mass
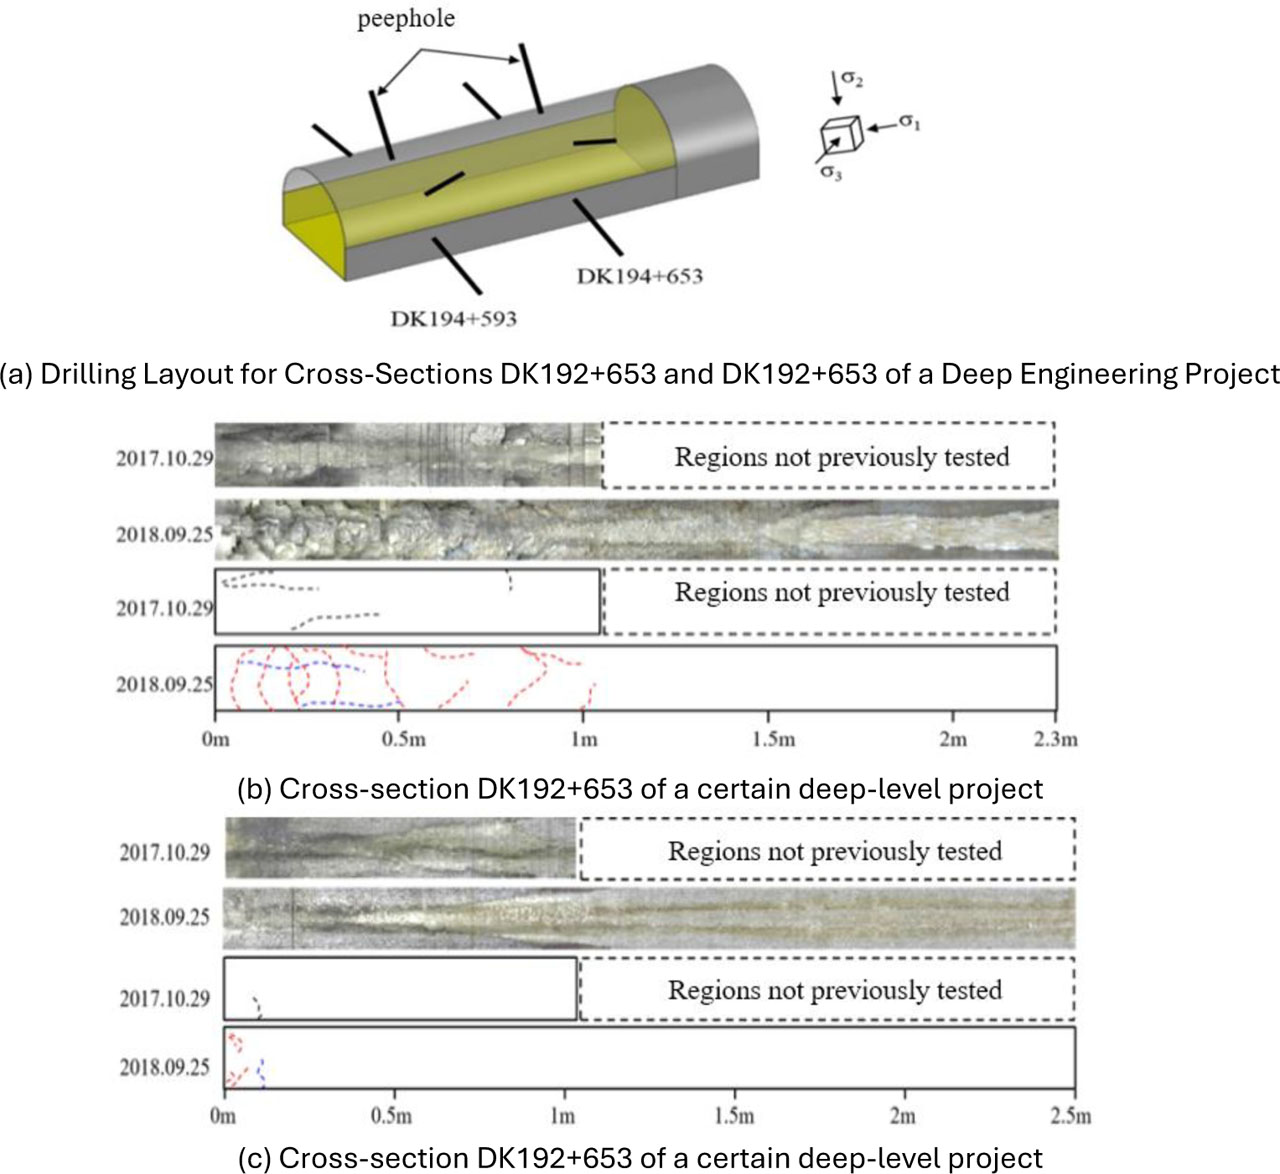
Figure 6:
Borehole camera results of DK194+593 and DK194+653 sections 1 month and 1 year after excavation
Table 3:
Key mechanical property indices of surrounding rock mass
| Rock Mass Grade [-] | Elastic Modulus [GPa] | Poisson's Ratio [-] | Tensile Strength [MPa] | Internal Friction Angle [°] |
|---|---|---|---|---|
| Grade II | 29.2 | 0.2 | 1.5 | 30 |
Table 4:
Horizontal stress parameters of surrounding rock
| Horizontal Stress σ1 [MPa] | Horizontal Stress σ2 [MPa] | Horizontal Stress σ3 [MPa] |
|---|---|---|
| 74 | 54 | 36 |
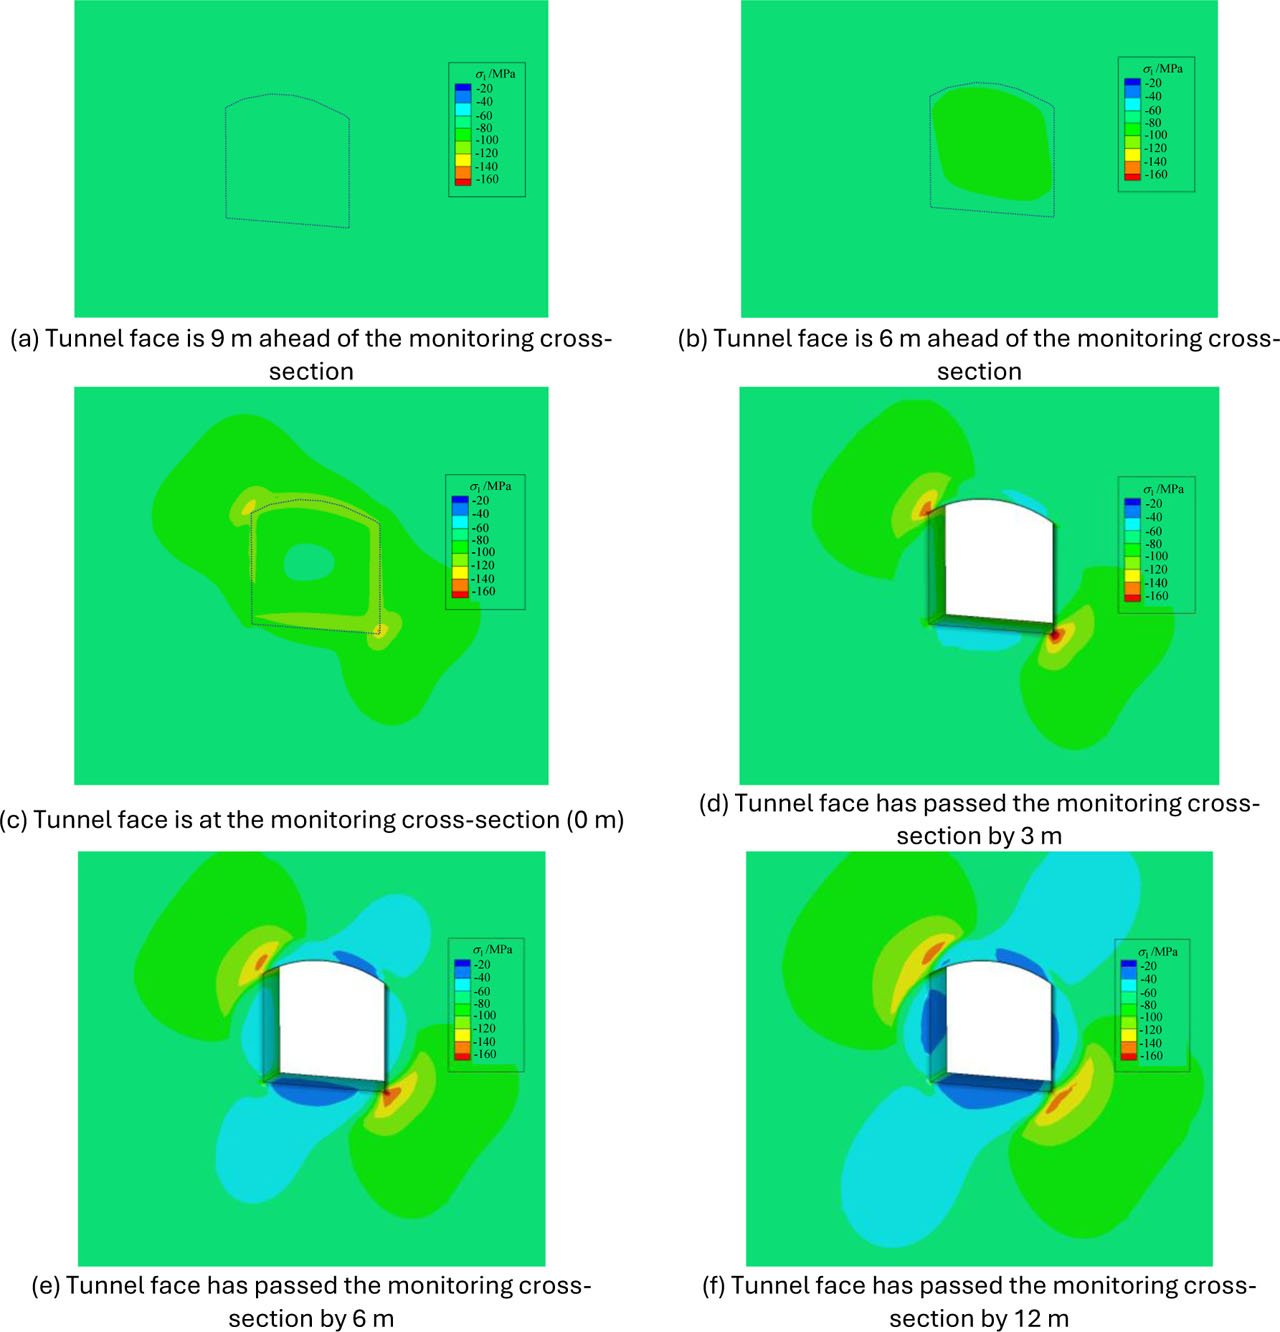
Figure 7:
The stress change of the section was monitored during the excavation
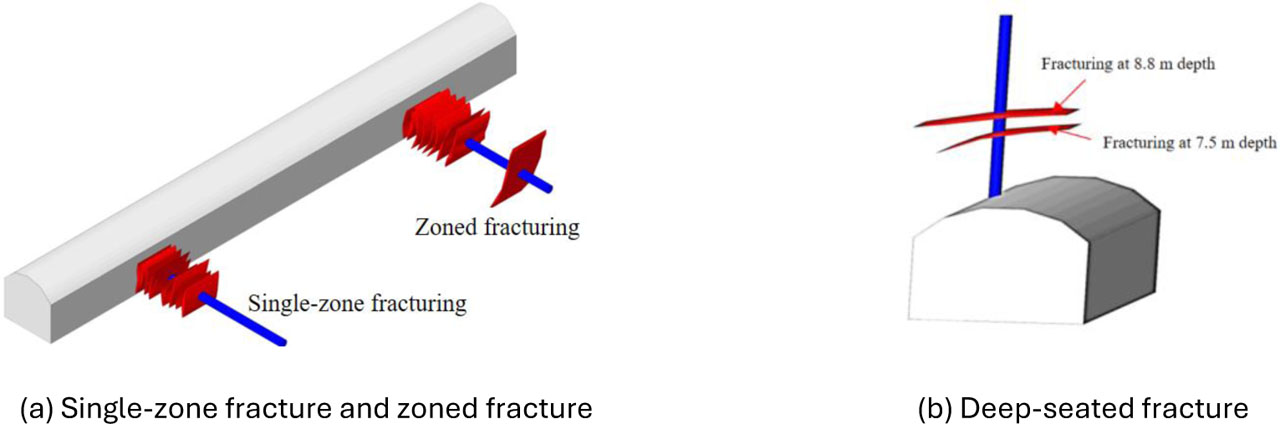
Figure 8:
Schematic diagram of deep rock mass rupture pattern
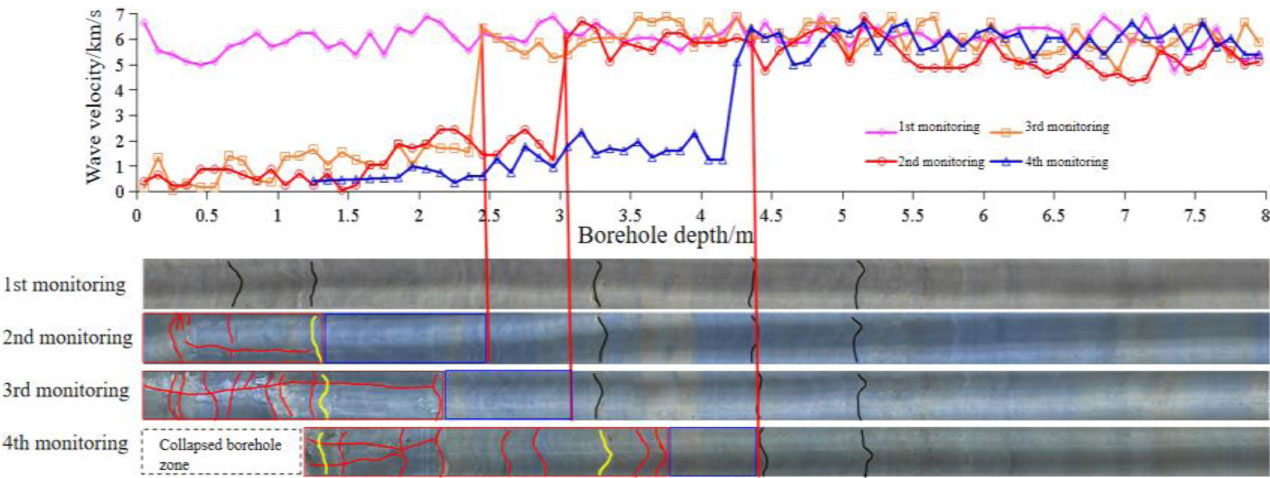
Figure 9:
The maximum concentrated stress changes with the propulsion of the palm surface
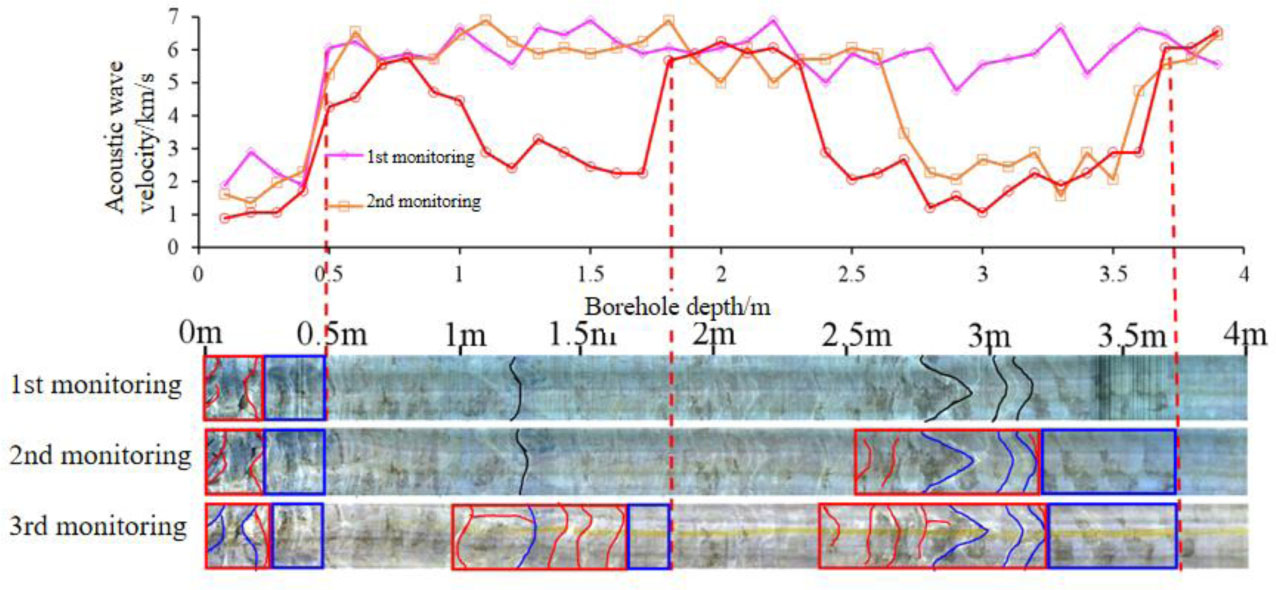
Figure 10:
The location of peak stress migrates following the advancing excavation face.
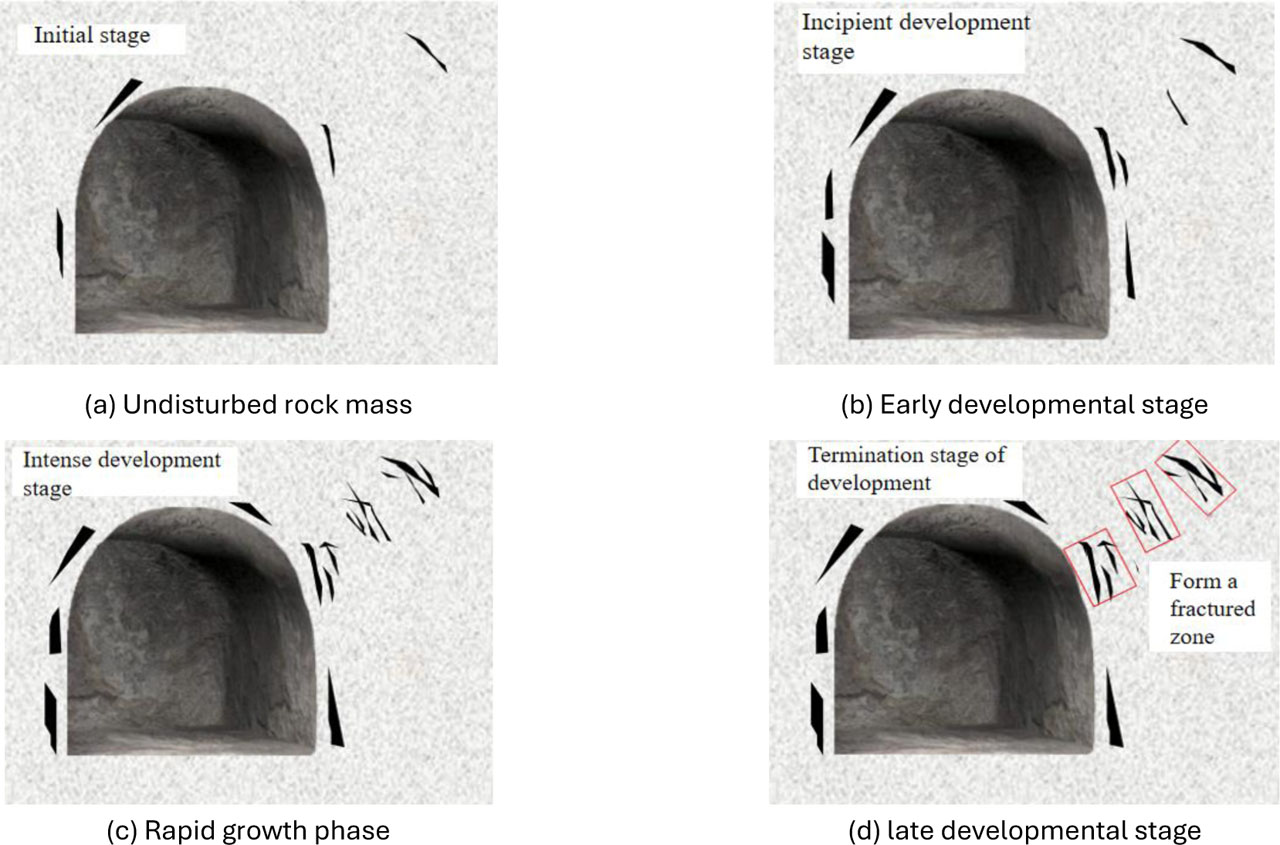
Figure 11:
Breeding process of deep surrounding rock fracture zone
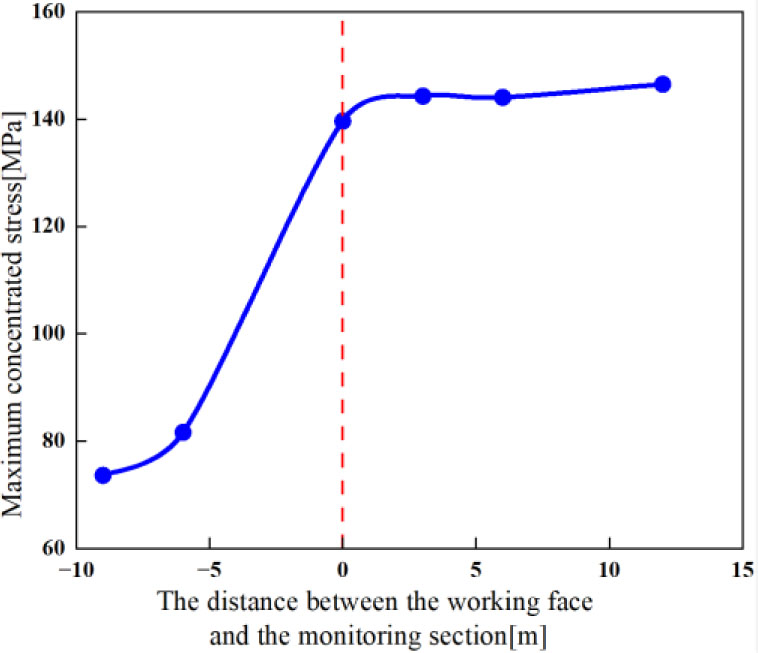
Figure 12:
The maximum concentrated stress changes with the propulsion of the palm surface