

Table 1:
Key themes in the literature
| Theme | Core insight | Relevance to proposed study | Citations |
|---|---|---|---|
| Baghdad congestion & intersection performance | Sever persistent at intersections LOS often E-F despite control improvement | Establishes local problem context and need to go beyond operational fixes | |
| Land use morphology | Uncontrolled densification and changing land uses around intersections significantly worsen volumes, delays, and LOS | Justifies explicit modelling of land-use patterns at intersection scale in Baghdad | |
| Regression and hybrid models in traffic prediction | MLR and multivariate regression remain baseline or embedded components alongside advanced ML for traffic forecasting | Supports use of a refined, interpretable MLR framework tailored to intersection-level congestion in data-limited settings | |
| Land-use mix & congestion via regression | MLR/MLSR and related models link land-use composition (e.g., commercial, residential, mixed use) to congestion indices | Provides methodological foundation for integrating land-use mix diversity into congestion models |
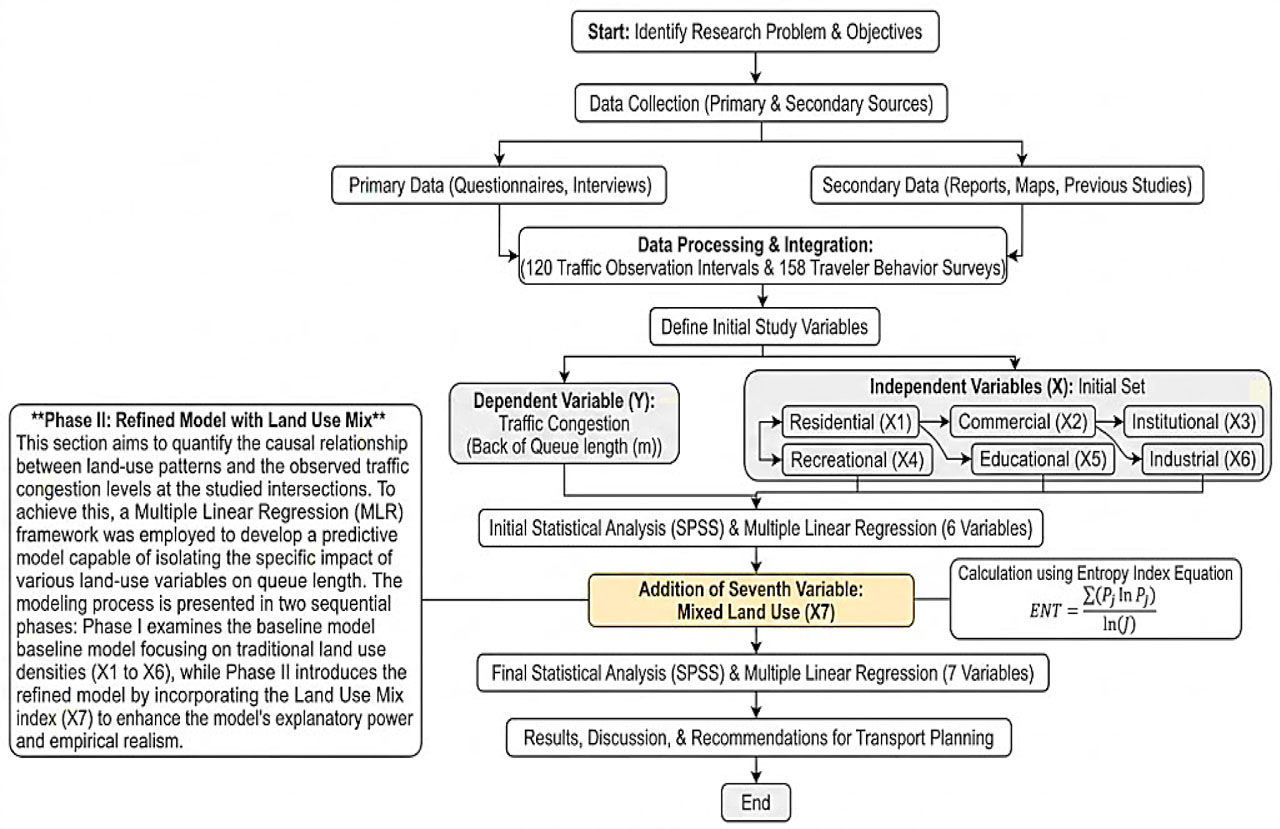
Figure 1:
Methodological workflow
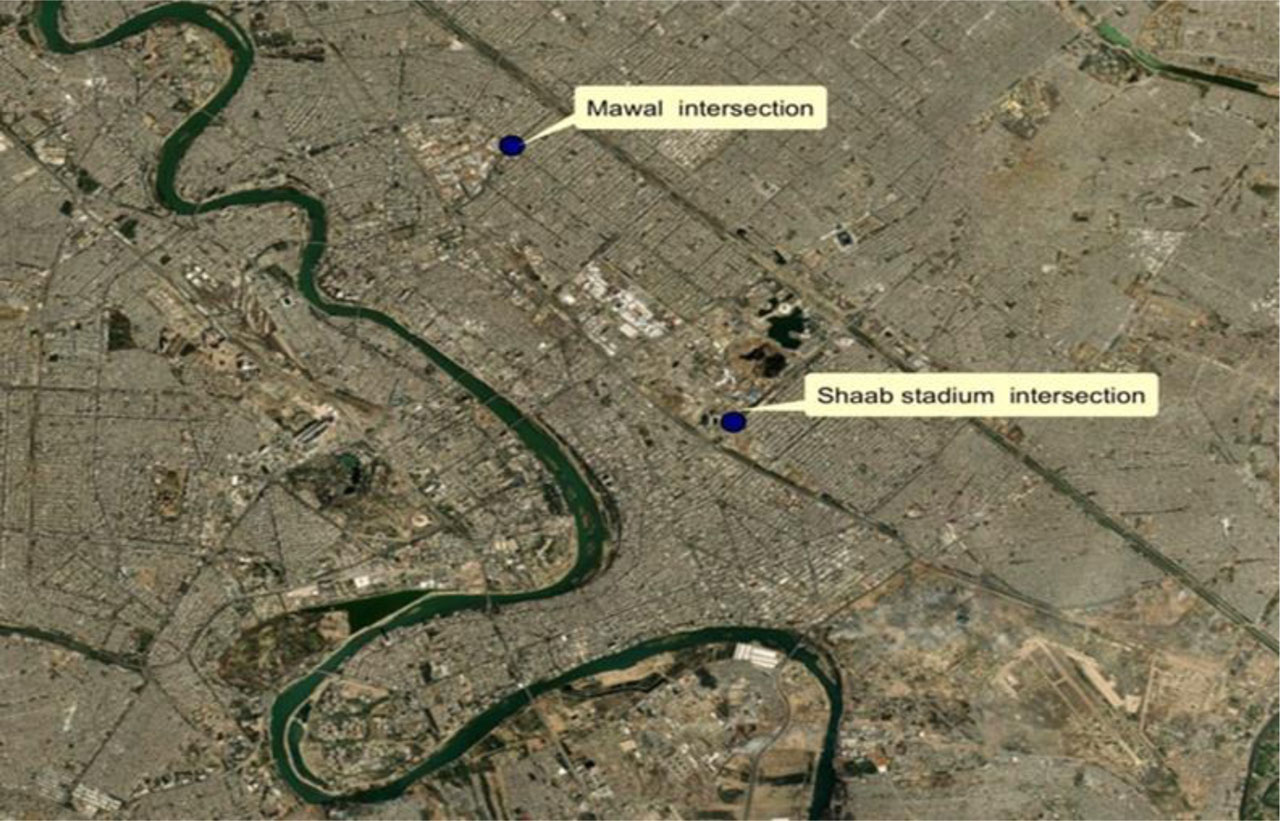
Figure 2:
Two intersection locations of Baghdad city
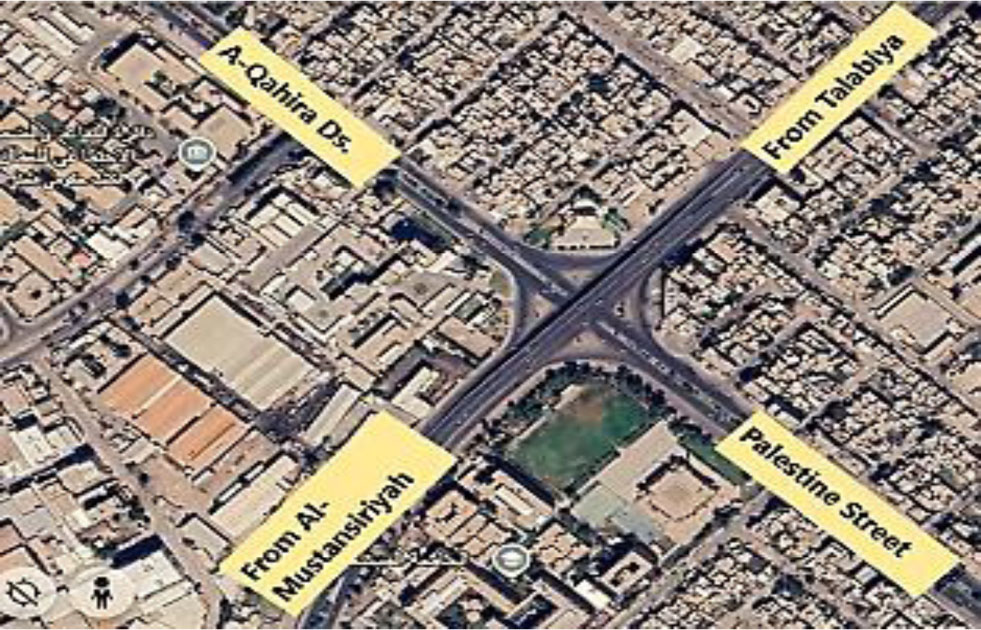
Figure 3:
Geographical view of Al-Mawal intersection
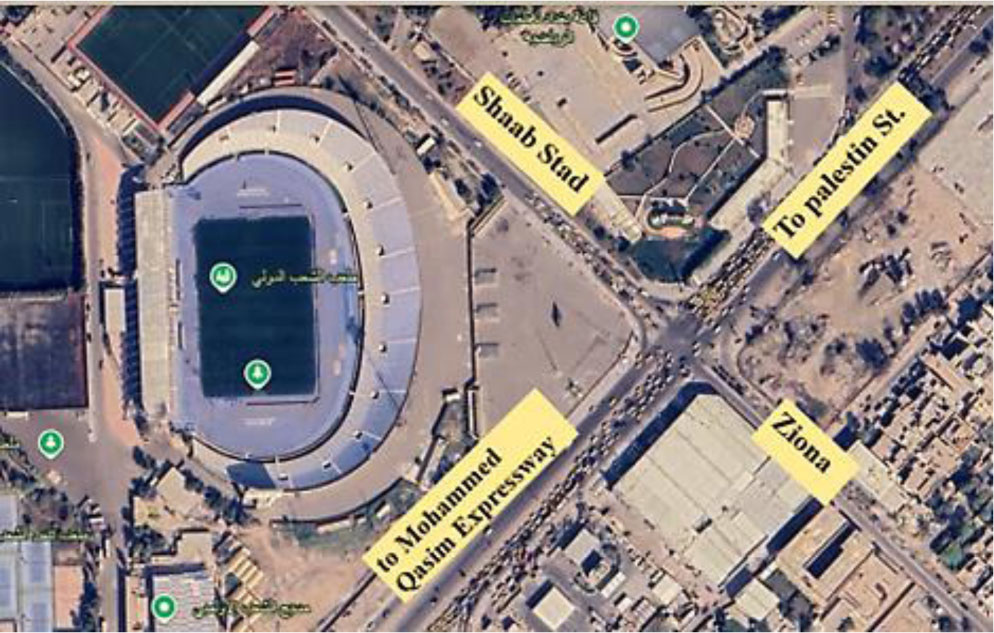
Figure 4:
Geographical view of Al-Shaab stadium
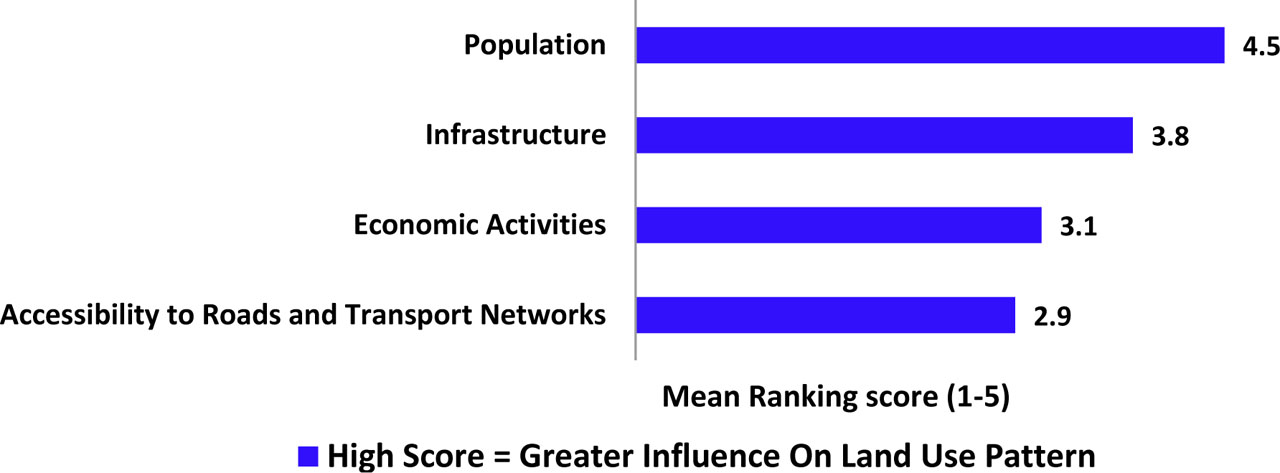
Figure 5:
Mean ranking result of factors determining land use patterns in Baghdad city
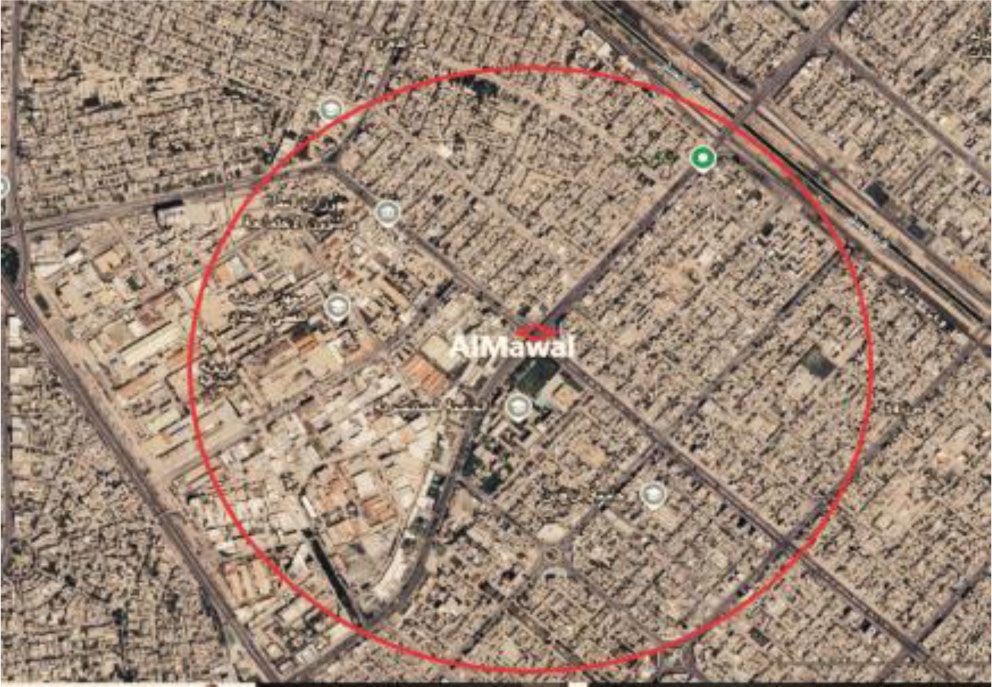
Figure 6:
Area surrounding Al-Mawal
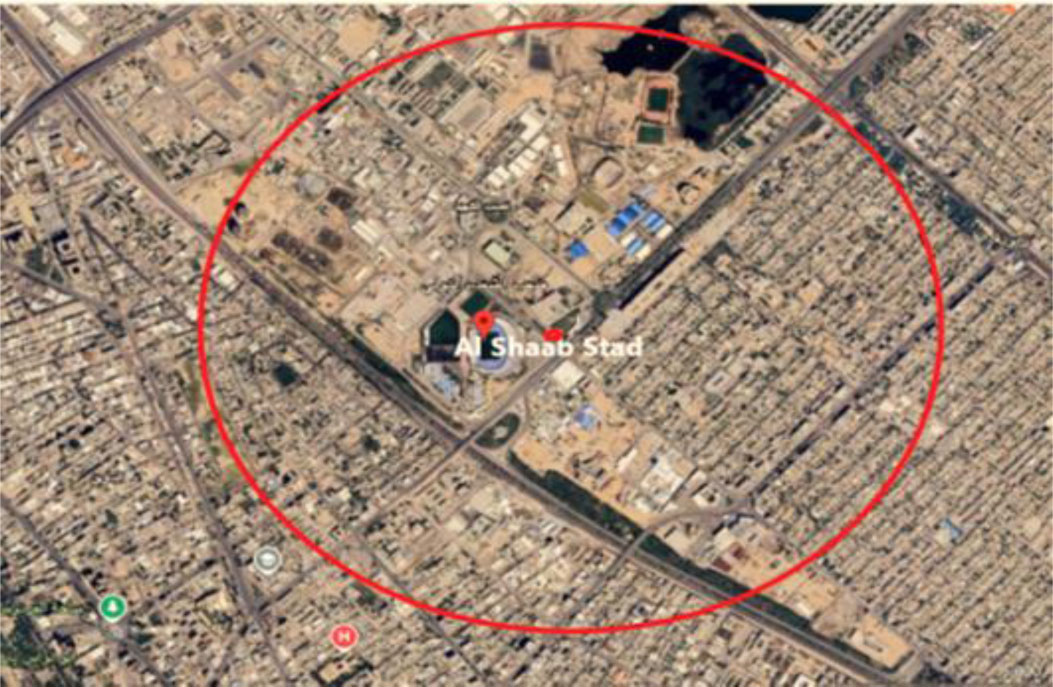
Figure 7:
Area surrounding Al-Shaab stadium
Table 1:
Land use distribution within the study intersections zone
| Intersection name | Points of attractive | Type use |
|---|---|---|
| Al-Mawal Intersection | Al-Mustansirya university | Education |
| Al Rafidian college dentist | Education | |
| International school | Education | |
| Al Sakhra intesection | Commercial | |
| Nakhla intersection | Commercial | |
| Restaurant | Recreational | |
| Cafés and parks | Recreational | |
| Bulding housing | Residential | |
| Directorate of Russafaa 1st education | Institutional administrative | |
| Shahriar gardens and halls | Recreational | |
| Al Wazereyah industrial | industrial | |
| Schools | Education | |
| Al Shaab Stadium Intersection | Al Shaab stadium | Recreational |
| Ministry of oil | Institutional administrative | |
| Al Rubaie street | Commercial | |
| Zayona amusement park | Recreational / commercial | |
| Sindbad amusement park | Recreational | |
| Social Security department | Recreational | |
| Zyona water city | Recreational | |
| Ministry of youth and sport | Institutional administrative | |
| Ministry of interior | Institutional administrative | |
| Schools | Education | |
| Building housing | Residential | |
| Police academy | Education |
Table 2:
Parameters used in study for evaluating congestion
| Condition | Parameters | SIDRA | HCM 2010 |
|---|---|---|---|
| Geometric conditions | Area type | 1 | 1 |
| No. of lane | Input user | Input user | |
| Average length width | 3.5 [m/lane] | 3.5 [m/lane] | |
| Grads | 0% | 0% | |
| Parking condition | No | No | |
| Volume by movement | [Pcu/hr] | [Pcu/hr] | |
| Ideal saturation flow rate | 1950 [Pcu/hr] | 1930 [Pcu/hr] | |
| Peak hour factor | Default | Default | |
| Per cent heavy vehicle | Default | Default | |
| Traffic conditions | Local buses stopping | Al Mawal intersection: Yes Al Shaab stadium intersection: No | Yes No |
| Parking activity | Al Mawal intersection: Yes Al Shaab stadium intersection: No | Yes No | |
| Approach speed [k/h] | Default | Default | |
| Signalized conditions | Cycle length [sec] | 138 sec at Al Mawal 150 sec at Al Sheab | 138 sec at Al Mawal 150 sec at Al Shaab |
| Green time [sec] | 25 sec at Al Mawal 33 sec at Al Shaab | 25 sec at Al Mawal 33 sec at Al Shaab | |
| Amber time, all red, clearance [sec] | 5 sec | 5 sec | |
| Interval (intergreen) | 2 sec | 2 sec | |
| Actuated operation | A | A | |
| Phase plane | Yes | Yes | |
| Analysis period [hr] | AM peak PM peak | AM peak PM peak |
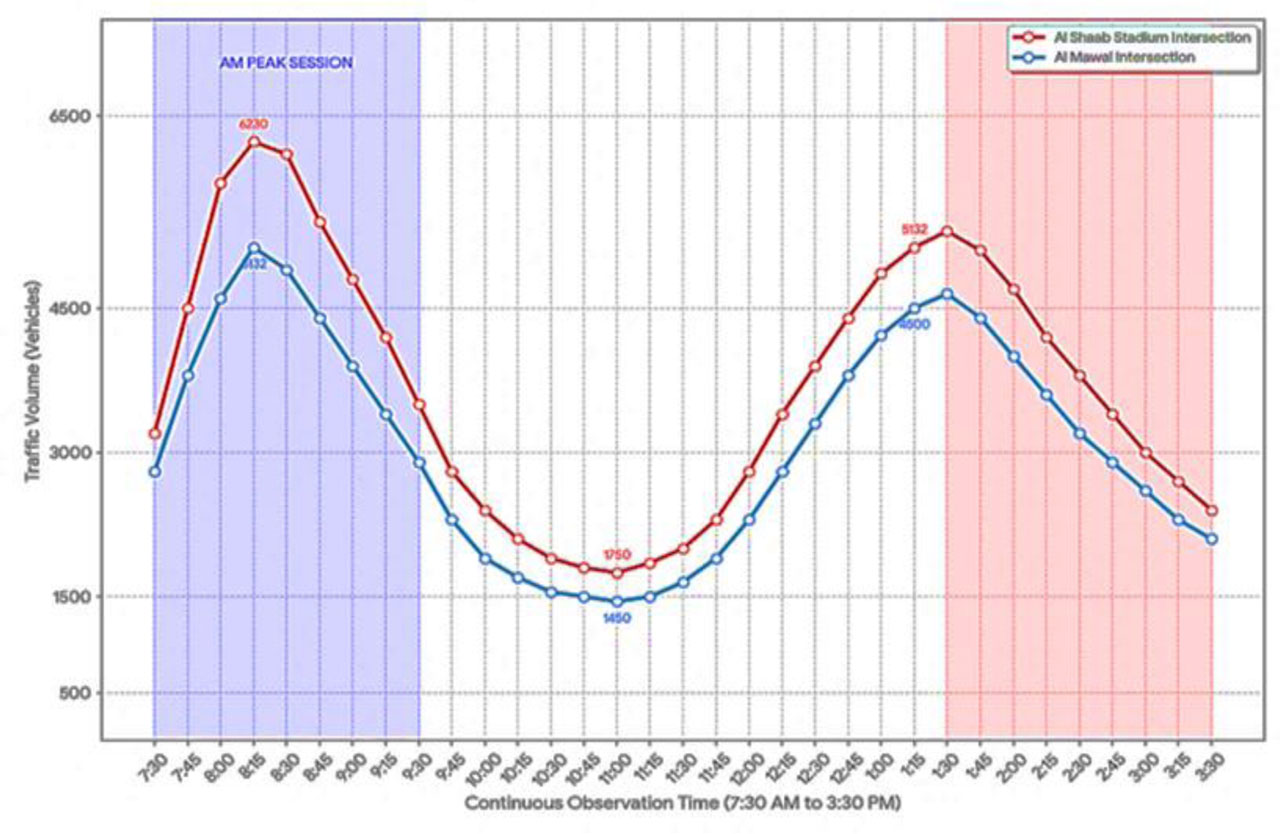
Figure 8:
Daily traffic volumes in the study sites
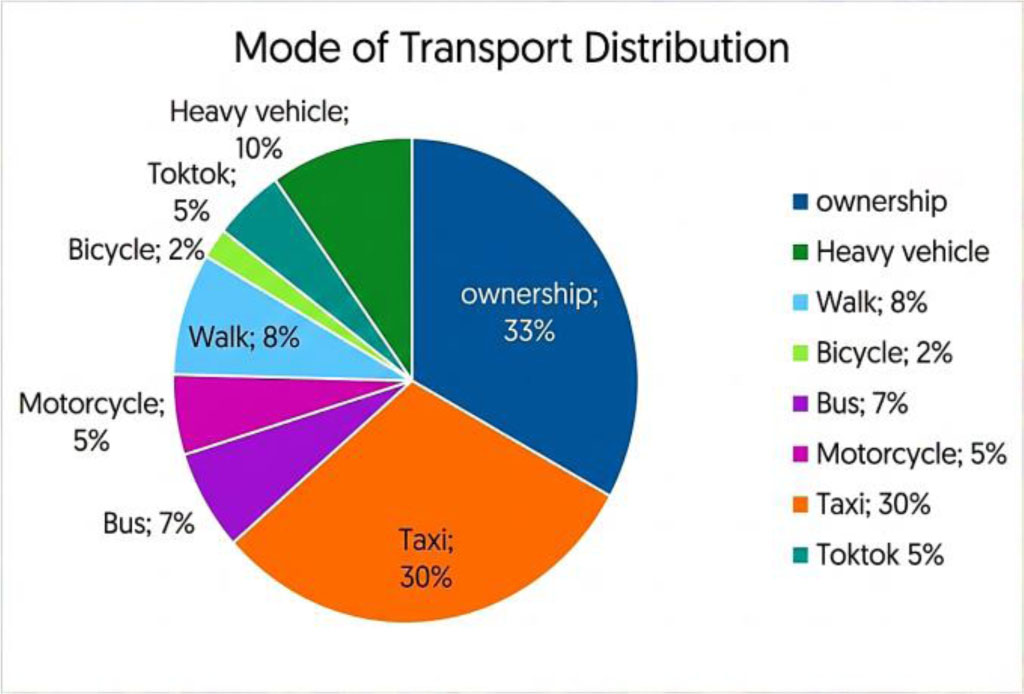
Figure 9:
Mode transportation at Al Mawal intersection
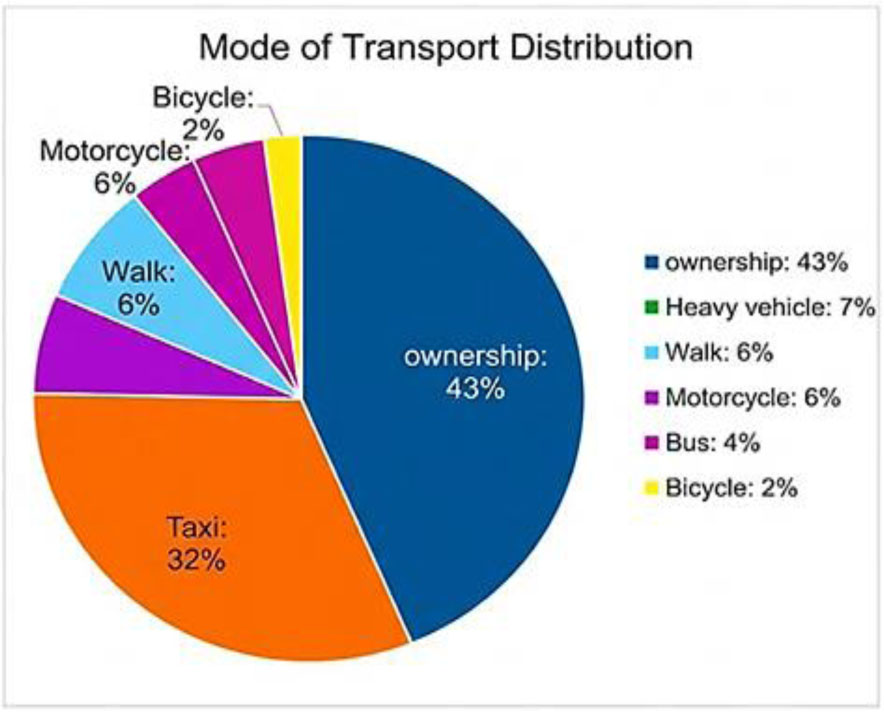
Figure 10:
Mode transportation at Al Shaab stadium
Table 3:
Percentage of trip purpose at selected intersection
| Trip purpose | Percentage [%] | Cumulative percentage [%] |
|---|---|---|
| To work | 40.56 | 40.56 |
| Returning | 30.33 | 70.89 |
| Commuting to school or universities | 11.88 | 82.77 |
| Shopping | 8.69 | 91.49 |
| Recreation | 5.34 | 96.60 |
| Picking | 30.20 | 100.00 |
Table 4:
Result of estimation traffic congestion
| Output results | SIDRA model intersection I | SIDRA Model Intersection II | HCM 2010 intersection I | HCM 2010 intersection II | Difference SIDRA&HCM I | Difference SIDRA&HCM II |
|---|---|---|---|---|---|---|
| Back of queue length [m] | 1014.5 | 1277 | 1832 | 1645 | −38 | −30.20 |
| Av. Delay [sec] | 115.4 | 336.7 | 274 | 487.3 | −58 | −30.9 |
| Degree [V/C] | 1.48 | 2.5 | 2.83 | 2.81 | −47 | −11 |
| LOS | F | F | E | E | - | - |
| Av. speed [k/h] | 22.4 | 18.6 | 20.12 | 17.34 | 70.9 | 13 |
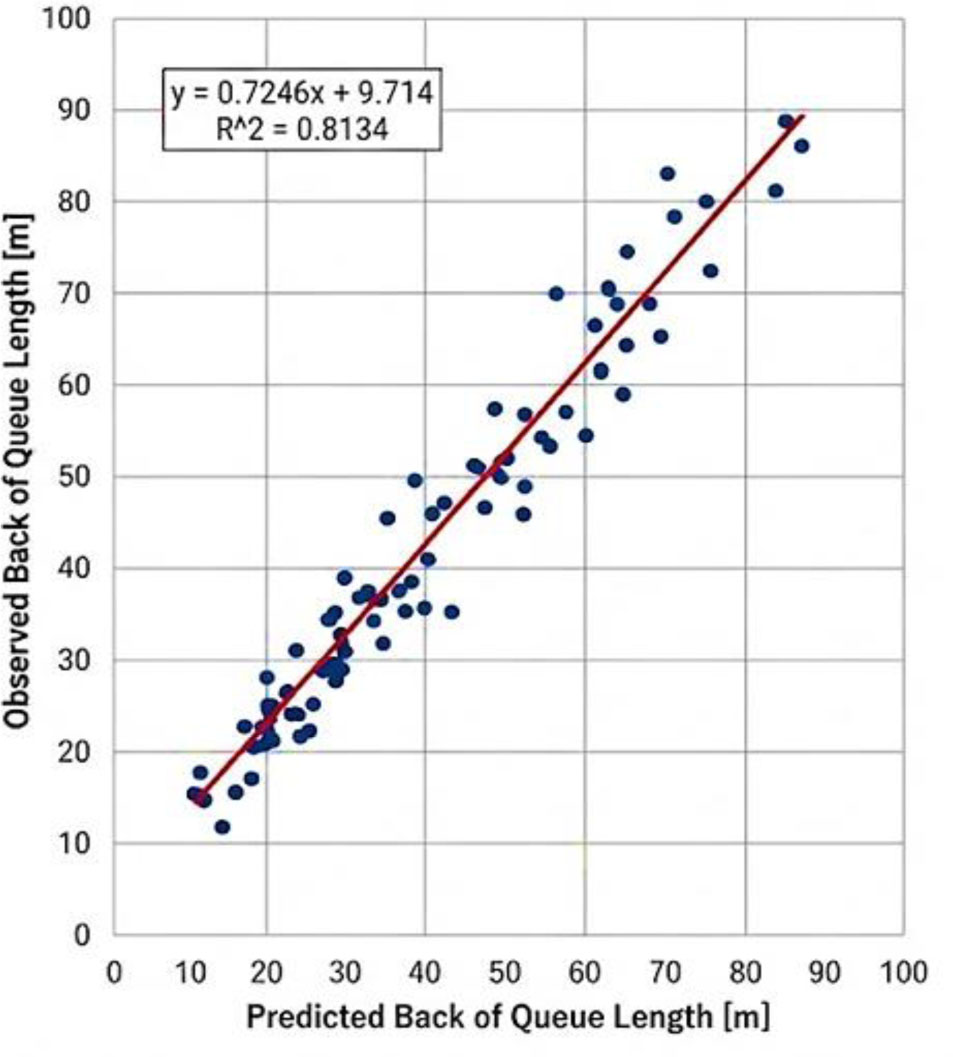
Figure 11:
Linearity of observed back of queue length and that predicted by SIDRA 9.1.1
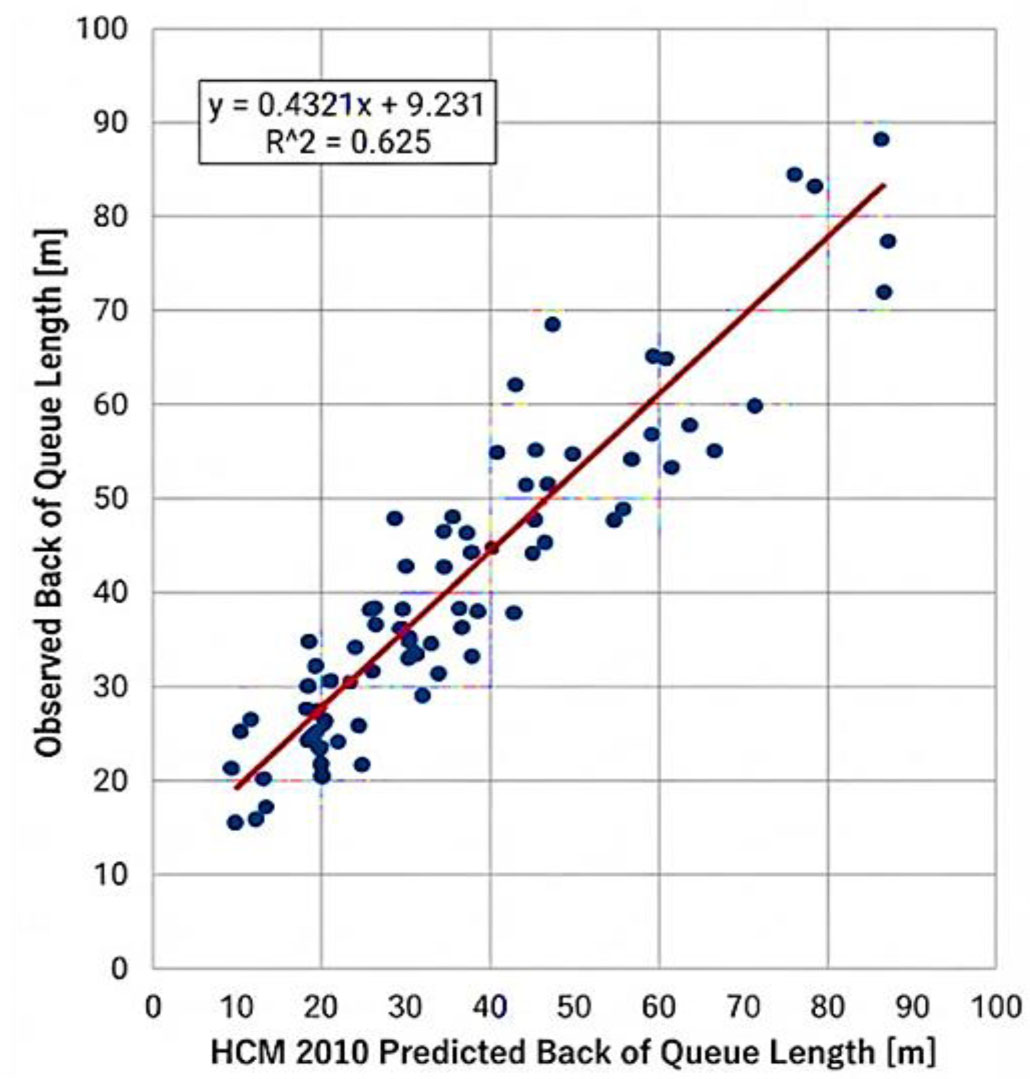
Figure 12:
Linearity of observed back of queue length and that predicted by HCM2010
Table 5:
Summary for baseline model
| Model | Sum of squares | df | Mean square | F | P-value |
|---|---|---|---|---|---|
| Regression | 5736355.381 | 5 | 1,147,271.076 | 647.55 | <.0.001) |
| Residual | 201839.119 | 114 | 1770.518 | ||
| Total | 5983194.500 | 119 |
Table 6:
ANOVA results for overall model significance
| Model | R | R2 | Adjusted R square | Std. error of the estimate |
|---|---|---|---|---|
| 1 | 0.783 | 0.613 | 0.565 | 18.235 |
Table 7:
Regression coefficients for baseline land-use variables
| Variables | Estimate | Std. error | Significance | 95% Confidence interval | |
|---|---|---|---|---|---|
| Lower bound | Upper bound | ||||
| Commercial | 30.402 | 1.345 | .000 | 27.765 | 33.038 |
| Education | 29.359 | .653 | .000 | 28.08 | 30.64 |
| Recreational | 14.152 | 5.945 | .000 | 2.50 | 25.80 |
| Institutional | 19.234 | .552 | .000 | 18.15 | 20.31 |
| Resident | 20.153 | 1.221 | .001 | 17.76 | 22.54 |
Table 8:
Final regression coefficients and multicollinearity diagnostics
| Independent variables | Coefficients | Std. error | t-value | Sig. (p-value) | VIF |
|---|---|---|---|---|---|
| Constant | 115.200 | 12.450 | 9.253 | .000 | - |
| Residential density | 28.450 | 4.120 | 6.905 | .000 | 1.42 |
| Commercial density | 105.120 | 8.340 | 12.604 | .000 | 2.15 |
| Institutional density | 22.100 | 3.560 | 6.208 | .001 | 1.68 |
| Recreational land use | 21.800 | 4.800 | 6.108 | .000 | 1.24 |
| Educational land use | 29.150 | 3.200 | 6.609 | .001 | 2.08 |
| Mixed use | 42.600 | 5.150 | 8.271 | .000 | 2.45 |
Table 9:
Modell summary (refined)
| Model | R | R2 | Adjusted R square | Std. error of the estimate |
|---|---|---|---|---|
| 2 | 0.916 | 0.84 | 0.82 | 15.42 |
Table 10:
ANOVA results for the refined regression model
| Model | Sum of squares | df | Mean square | F | Sig. |
|---|---|---|---|---|---|
| Regression | 4,988,083.380 | 6 | 831,347.23 | 98.87 | 0000 |
| Residual | 950,111.120 | 113 | 8,408.06 | ||
| Total | 5,98,3194.500 | 119 |
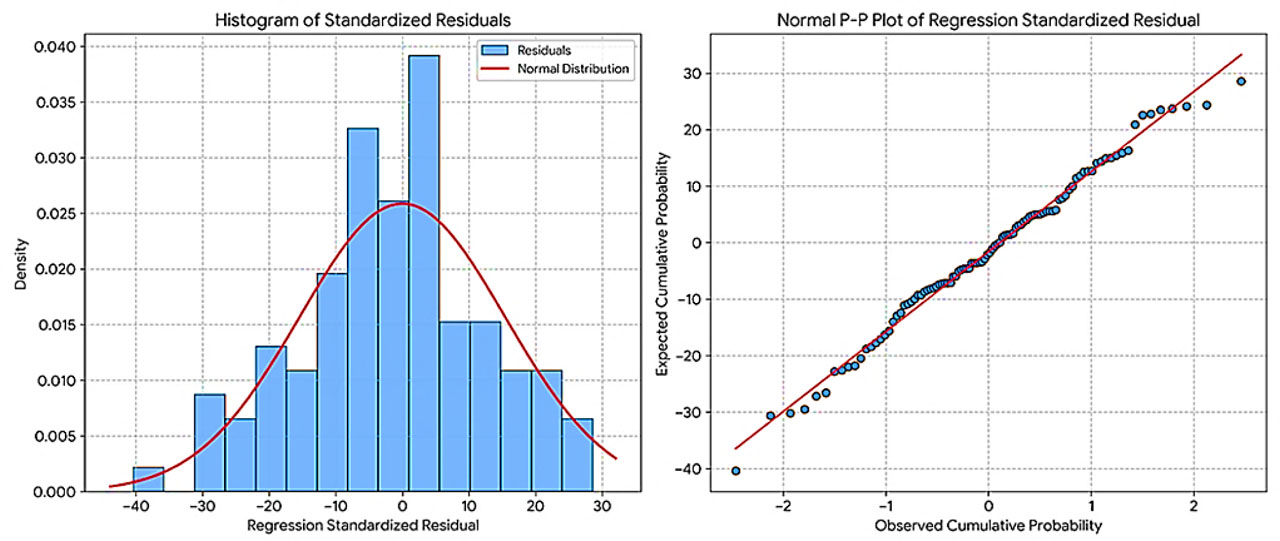
Figure 13:
Diagnostic plots for regression residuals: (left) Histogram of standardized residuals; (right) Normal P-P plot