

1. Introduction
Traffic congestion is a complex issue, more than mere transportation shortfalls, and is deeply associated with the spatial pattern of urban activities. In fast-growing cities like Baghdad, the link between land uses and transportation grew more distant. In the past, transportation planners focused on increasing road capacity, whereas modern perspectives indicate that land-use patterns are the main drivers of traffic demand. Traffic congestion is a most serious issue in transport planning, particularly in cities, at intersections (Chen et al., 2023), due to the complexity of the street environment that influences traffic speed as well. In addition, the major urban problem is congestion, which leads to delays, productivity losses from traffic jams, and the emission of toxic chemicals (Afrin & Yodo, 2020). The problems result in a lack of sustainability and resilience in urban transport systems. (Alobaydi et al, 2020; Alkaissi, 2023; Attab et al, 2020, Arma, 2022) have tended to consider congestion largely through the lens of supply side or operational solutions such as the construction of new roads and bridging intersections, provision of signal coordination release capacity improvements but frequent re-occurrence of saturation levels and deterioration in levels of service (LOS) are commonplace particularly at critical junctions and corridors. This implies that managing traffic and structure exclusively is inadequate in land-use high-density, uncontrolled or dysfunctional development.
Conversely, traffic demand and spatio-temporal traffic congestion levels are significantly influenced by the urban form and land-use configuration. Jadriyah intersection in Baghdad experienced severe LOS degradation as a result of the intersection’s morphological changes and spontaneous densification; peak traffic increased by approximately 155 veh/h per year, pedestrian flows tripled over a 20-year period, and urban development near the junction was found to contribute to its low performance (Alobaydi et al., 2020). The same scenario is also found in other major Iraqi cities, where rapid explosion of residential and commercial activities as well as shortage of public transportation, parking space, and network capacity are among the main factors aggravating the chronic congestion at major junctions and corridors (Abdulazeez et al, 2025; Alkaissi, 2023; Talib et al, 2023; Attab et al, 2020; Abood et al, 2025). Apart from Iraq, the relationship among land use mix/intensity/space distribution and congestion is increasingly researched on an international level but more commonly at larger scales and not explicitly integrated into operational intersection-level models (Wang et al, 2021; Bao et al, 2022; Song et al, 2019; Zhang et al, 2017).
A great deal of models estimates the relationship or impact of land use on congestion, as demonstrated in Xia et al, 2023; Heyns, 2015; Herala, 2006). They employed theory (in combined land-use-transport modelling, GIS, and simulation trans CAD), empirical case studies, and policy analyses in the link between land use and traffic impacts. On the other hand, Asmael et al (2020) conducted a regression analysis and found that land-use modes are also major influencing factors of traffic congestion. Simultaneously, some studies established that despite the ascendancy of machine learning techniques, Multiple Linear Regression (MLR) as well as other multivariate procedures are still frequently applied for traffic flow and congestion prediction due to their transparency, minimal need for data, and ease of interpretation (Taha et al, 2022; Li, 2020; Alomari et al, 2022; Shi et al, 2022; Deepika et al, 2024; Bratsas et al, 2019). MLR has been successfully applied to link congestion indices with built environment indicators and land-use composition, indicating its applicability in capturing land use-traffic interactions (Bao et al, 2022; Song et al, 2019). Nonetheless, there is a dearth of advanced MLR models that routinely incorporate diversity measures of ‘mixed use’ in congestion prediction at urban intersection level in an ad-hoc settings such as Baghdad which data-sparse and in transition.
This encourages the research to incorporate land-use mix diversity indices within an enhanced MLR-based congestion model for Baghdad’s urban intersections. This kind of framework would offer planners an interpretable, data-efficient tool to estimate the contribution of various mixed-use developments around intersections to known congestion, and to link land-use policy with transport strategy beyond (geometric or signal) remedies see Table 1. An important contribution of this study is the inclusion of ‘Mixed Use’, as measured by the Entropy Index, in an explanatory framework for congestion resulting from trip mixing and operational friction at critical intersections.
Table 1:
Key themes in the literature
| Theme | Core insight | Relevance to proposed study | Citations |
|---|---|---|---|
| Baghdad congestion & intersection performance | Sever persistent at intersections LOS often E-F despite control improvement | Establishes local problem context and need to go beyond operational fixes | |
| Land use morphology | Uncontrolled densification and changing land uses around intersections significantly worsen volumes, delays, and LOS | Justifies explicit modelling of land-use patterns at intersection scale in Baghdad | |
| Regression and hybrid models in traffic prediction | MLR and multivariate regression remain baseline or embedded components alongside advanced ML for traffic forecasting | Supports use of a refined, interpretable MLR framework tailored to intersection-level congestion in data-limited settings | |
| Land-use mix & congestion via regression | MLR/MLSR and related models link land-use composition (e.g., commercial, residential, mixed use) to congestion indices | Provides methodological foundation for integrating land-use mix diversity into congestion models |
2. Previous Studies
2.1. Land Use and Congestion
In Baghdad, a comprehensive morphological assessment of the Jadriyah intersection over the three decades suggested that changes in land use and city form directly led to higher traffic volumes and pedestrian movements, resulting in poor LOS (Alobaydi et al., 2020). This study cross-assessed land-use change mapping with traffic counts and LOS evaluation, finding that when densification or the development of adjacent independent lands among developments is ignored in design, such ignorance leads to increased saturated flow rates and delay at intersections (Alobaydi et al., 2020 stress the effect because it results from cardinally changes in urban form: a longitudinal analysis of 98 US cities demonstrated a strong relationship. (Attab et al, 2020; Arama, 2022) relate network inadequacy and new urban development to severe congestion, frequently recommending road extensions or grade separations rather than modifying the configuration of settlement units.
From a global perspective, a joint analysis of 98 US cities observed that urban morphology (land use composition and spatial pattern of land use) is strongly associated with congestion, considering that the more polycentric structures usually result in higher congestion, while more contiguous residential structures may mitigate it (Wang et al., 2020). In a smaller city in China, multivariate least-squares regression demonstrated that educational and residential land uses evidently increase overall congestion, especially when their combined results during peak hours are considered between multiple types of land-use revealed that a higher proportion of commercial land strongly increases the time duration of congestion and (Bao et al., 2022). In Beijing, a regression of congestion time on urban land-use type found that a high ratio of commercial land greatly increases congestion time, and a balanced urban land-use mix can reduce congestion (Zhang et al., 2017).
In a study that employs geographically weighted regression in Chengdu, it is also found that the concentration of companies and residential areas exacerbates congestion, while spatial heterogeneity in these results exists (Li et al., 2020). Multi-source congestion mapping research also indicates that high-density mixed land use can reduce trips to the central area; however, it requires micro-scale design focused on accommodating multiple modes (Song et al., 2019). Ihsan et al. (2019) consider land-use planning a key issue that can be controlled to reduce congestion in the short and long term. Further, from several studies, it is confirmed that land-use residential, commercial, educational, etc., plays a very important role in increasing congestion on roads, particularly during peak hours.
Together, these works prove that land use composition, intensity, and mix are important factors of congestion, which can be quantitatively measured by regression-based models at the city to neighbourhood scale (Wang et al, 2021; Bao et al, 2022; Song et al, 2019; Zhang et al, 2017; Li, 2020). However, there is a shortage of models for the Middle Eastern cities that are fine grained and intersection oriented while applying explicit diverse land-use mix indicators.
2.2. Congestion and Intersection Studies in Iraq
“Research into Iraq’s urban infrastructure has increasingly focused on the operational failures of Baghdad’s key intersections and corridors. Specifically, studies centred on Jadriyah and other high-traffic zones have highlighted a persistent decline in Level of Service (LOS), characterized by ballooning queue lengths and volumes that far outpace current capacity (Alobaydi et al, 2020; Attab et al, 2020; Arma, 2022). Such systemic saturation is especially apparent on the Baghdad Rusafa side, where corridor assessments indicate many links with volume-to-capacity ratios above 1.0 (Abdulazeez et al., 2025). While tactical fixes like signal coordination have smoothed progress on major arterials, they often hit a ceiling in oversaturated environments. Consequently, the prevailing literature continues to emphasize structural, supply-side solutions – ranging from road widening to the introduction of park-and-ride facilities and multi-story parking to address the combined challenges of congestion and urban emissions (Talib et al, 2023; Abood et al, 2025).”
These publications emphasize the dire congestion at Iraqi crossroads and demonstrate that conventional solutions often provide only partial relief as land-use pressures around crossroads continue to increase. Only a small number of them, though, incorporate quantitative indicators of land-use mixes into their predictive congestion models, particularly with regression models.
2.3. Regression-based and Data-driven Traffic Modelling
The model of MLR and other multivariate regression are common in prediction of traffic flow over short periods, based on geometric, traffic and occasionally environmental characteristics, and have been highly accurate in urban scenarios (Rajeh et al, 2022; Li, 2020). MLR can also be used as a reference point in comparisons with other, more complex machine-learning models (ANN, SVM, Random Forest, LSTM hybrids), especially when interpretability and low data complexity are required (Rajeh et al, 2022; Li, 2020; Alomari et al, 2022; Shi et al, 2022; Deepika et al, 2024; Bratsas et al, 2019). Similarly, linear and multiple linear regression models have been employed in some works on congestion–land-use studies to determine the extent to which shares of commercial, residential, industrial and mixed uses are associated with roast indices or travel times (Wang et al, 2021; Bao et al, 2022; Song et al, 2019; Shu et al, Song & Zeng, 2017; Li, 2020). Zhou et al. (2022) studied the influence of land use patterns on traffic flow, queue length, and delay at the intersection; they also provided field data and an analysis method for model development. Khodakarami and Mahmoodi (2021) examine the effects of land-use types and environmental factors on queue length and speed using a statistical modelling approach. These findings support the feasibility of a refined MLR approach that explicitly integrates land-use mix diversity metrics as predictors of intersection congestion into the set of predictors for the congestion measure. A model of this kind can fill the gap between macro-level analysis of land use and congestion in Baghdad and micro-level operational studies, providing an operational tool for combined land-use – traffic management at critical intersections.
3. Methodology
3.1. Research Design
A cross-sectional observational research design based on empirical field data will be used. The study consists of three stages, as shown in the flowchart Figure 1. The first phase analysed intersections by traffic volume, traffic composition (mode choice), and trip purpose at the crossing intersections. Congestion was estimated in the second stage at intersections using SIDRA Intersection 9.1.1 and an analytical method by HCM (2010) for V/C, level of service (LOS), total delay, and queue length. The last step examined the effects of land uses on traffic congestion at intersections, using a 1-kilometer-radius buffer around each intersection, consistent with assertions from the respective TAZs. A multiple regression model was established to estimate this relationship, initially considering six main land use categories. An additional variable was included (‘Mixed Land Use’) to ‘refine the model’s empirical realism and statistical precision’: ‘Mixed Use’ (X7), measured using the Entropy index.
The Entropy index is a mathematical expression for the degree of balance between different land use across certain region (Segnita & Handayani, 2019; Da Fontoura et al, 2025). Contrary to traditional density measures, this index deals with the very distribution of functions and a value close to 1 highlights a good level of mixing over space for various land uses with equal likelihood, which would lead into short trips and diverse travel behaviours. On the other hand, a value close to 0 means it is a very specialized use once space. This extension was necessary to represent the ‘trip overlap’ influences and the increased operational friction at intersections especially where high intensity educational and commercial activities meet. The developed model was further tested for validation to achieve a better level of goodness-of-fit, and to improve the representation of urban traffic congestion in Baghdad.
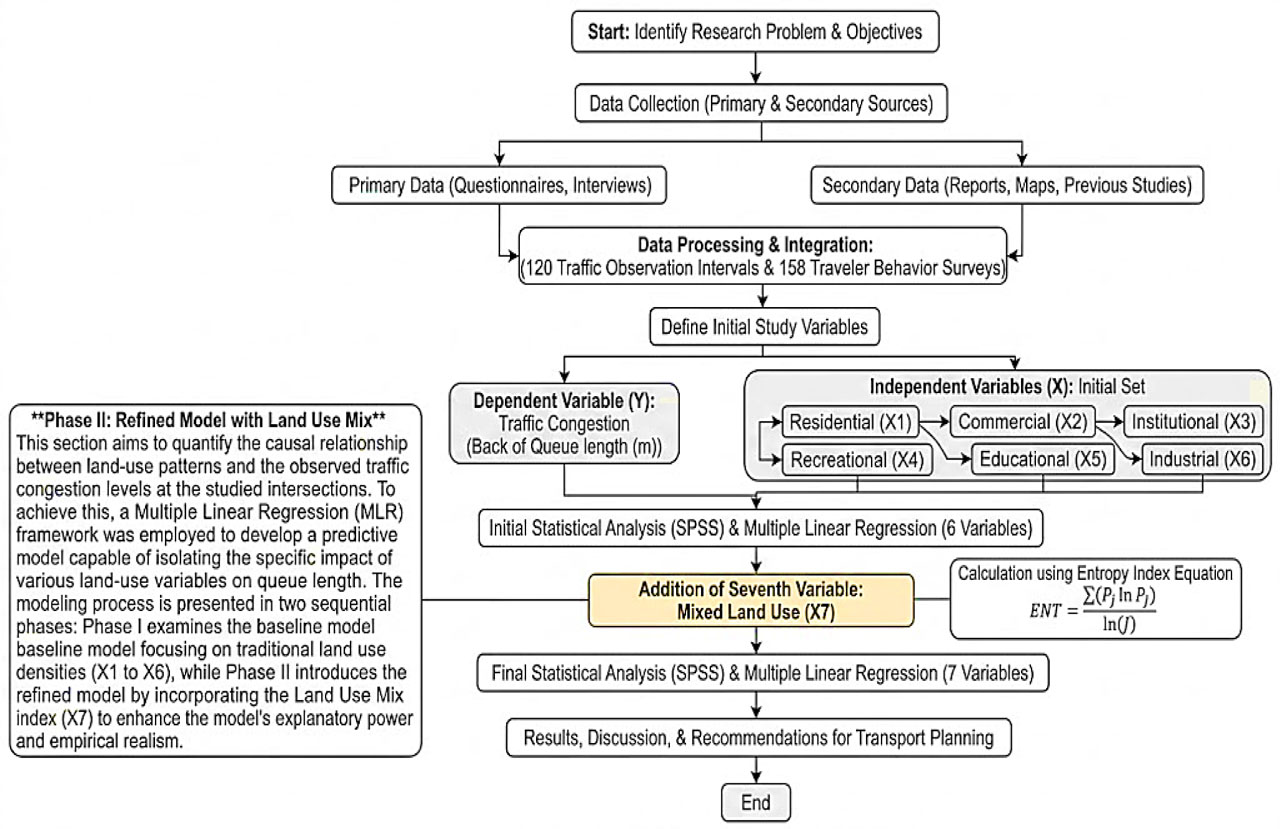
Figure 1:
Methodological workflow
3.2. Description of the Study Area
Study site represented by two intersections (Al-Mawal intersection and Al-Shaab intersection) in Baghdad city the details as Figure 2, 3 and 4. The choice of Al-Shaab Stadium and Al-Mawal intersectiones is explained by their status as a critical urban node with a high level of functional conflict. Al-Mawal is an example of a grade-separated intersection (flyover), and Al-Shaab is an instance of a saturated at-grade intersection. Such contrast can be used to test the model under varying geometric conditions, thereby increasing the research’s applicability to the corresponding high-density urban environment. Although the study was conducted across two locations, the focus was on the richness and frequency of the data; 120 distinct observation periods from a similar population were studied, yielding high-fidelity statistical power. These sites are the different interactions between residential, commercial, and institutional land uses, like the urban arteries in Baghdad. Al-Mawal intersection is a four-way intersection featuring an overpass that provides north–south flow, with three lanes on the south–north bound and two lanes on the east–west approach. The area supports a mix of land uses and functions, including residential, industrial, commercial, educational, and recreational activities. Besides, Al-Shaab intersection, the intersection is four-way with no overpass. Land uses and functions include administrative, sports, commercial, and entertainment. Structurally, there is an overpass only at the western bond, with three lanes on the west and east bonds, and two lanes on each of the north and south bonds.
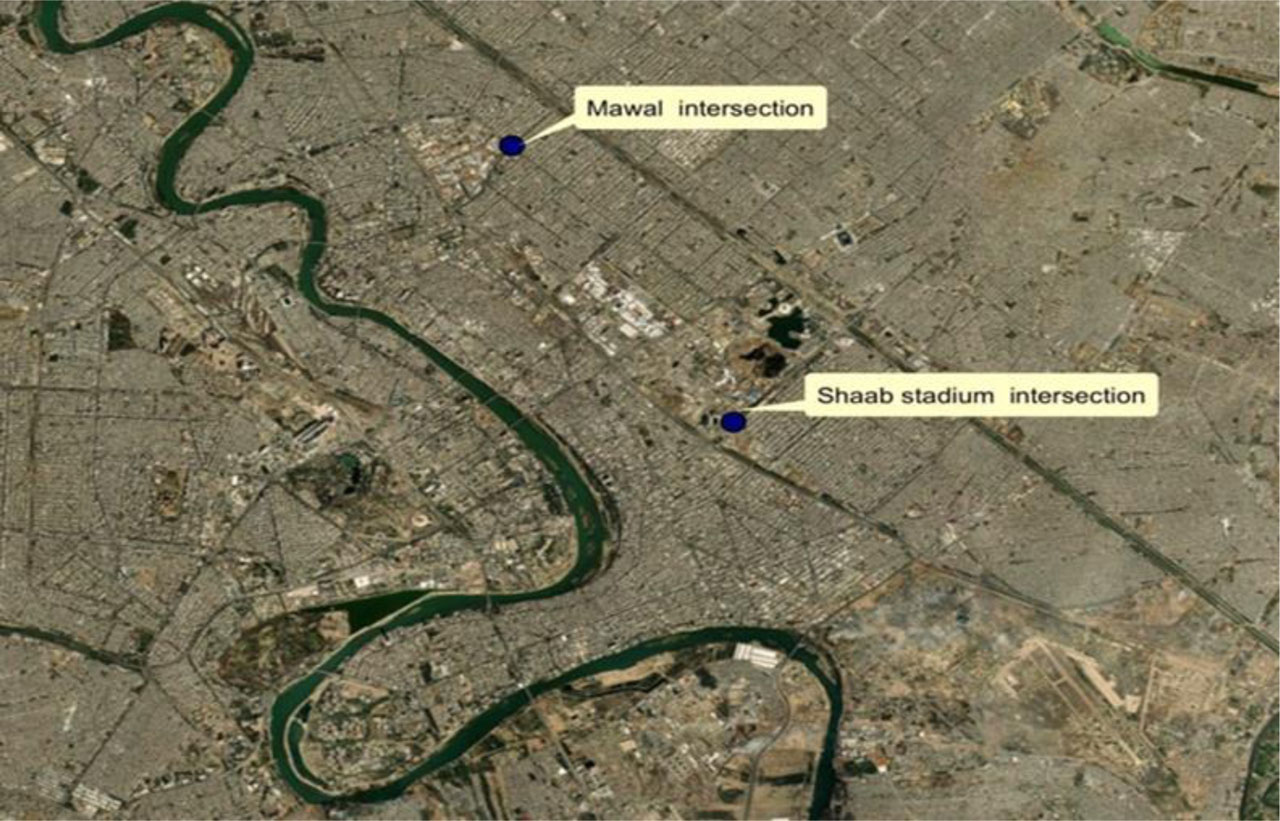
Figure 2:
Two intersection locations of Baghdad city
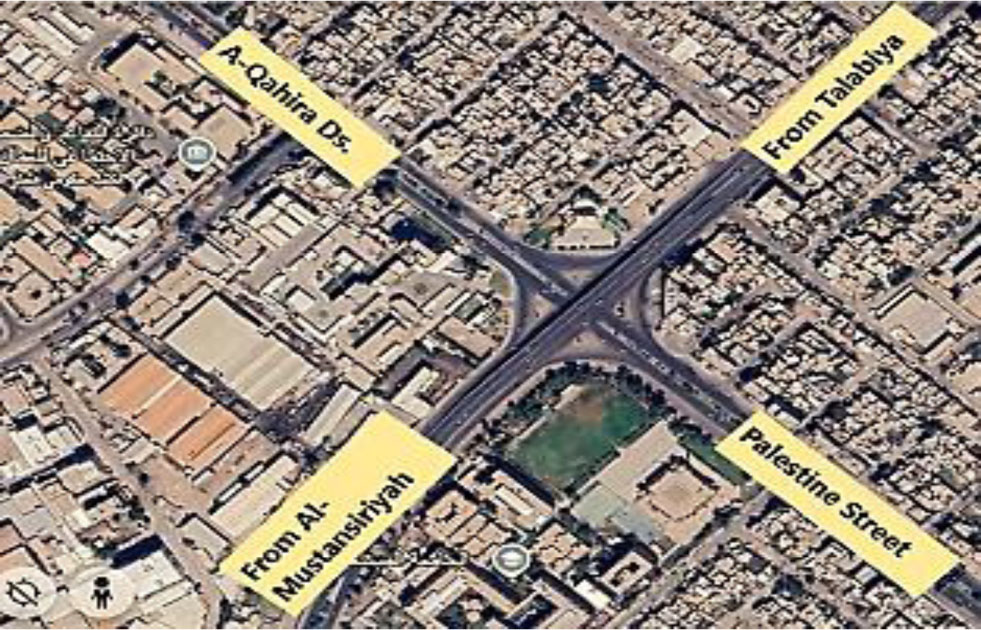
Figure 3:
Geographical view of Al-Mawal intersection
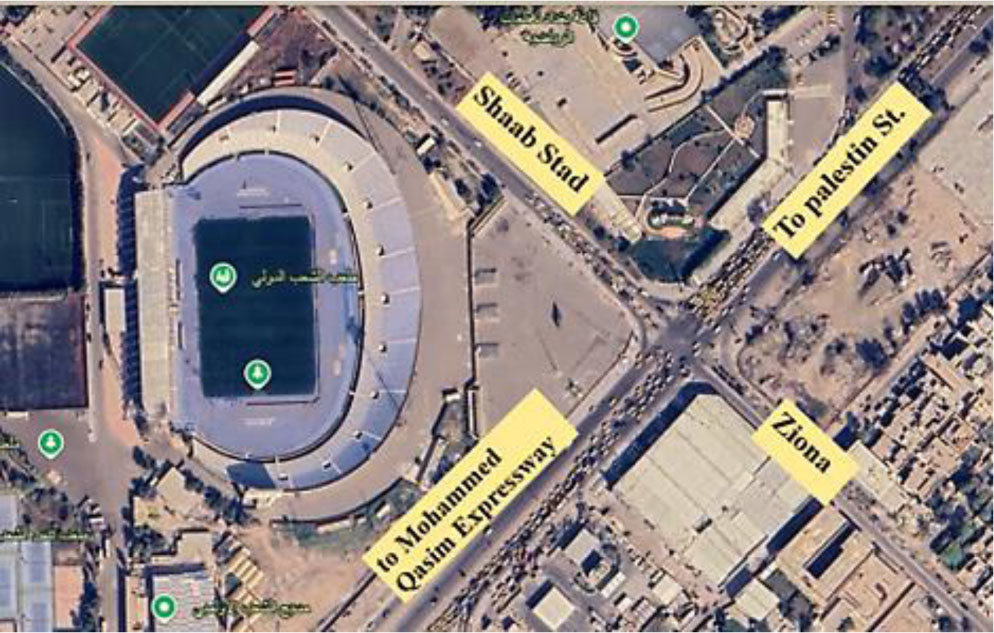
Figure 4:
Geographical view of Al-Shaab stadium
3.3. Contextual Analysis of Land Use Patterns
3.3.1. Mean Ranking of Determining Factors for Land-use Patterns in Baghdad City
At first, the research focused on primary causes and making factors of land use in the civic city of Baghdad, as the research presents the average ranking of the factors established to shape the patterns of land use in Baghdad metropolis; it reveals that the factor that causes the change in land use is population density (4.14) in the most critical way in Baghdad Metropolis, pushing housing and amenity demands straight into the red. Available infrastructure (3.71) is second, since utilities accessibility is an attractant to development. Economic activities with an influence of 3.27 are also significant, but transport accessibility (3.20) is perceived as slightly less decisive. These findings highlight that sustainable urban planning must focus on management. population growth and the supply of basic services to lead to systematic and effective land-use development.
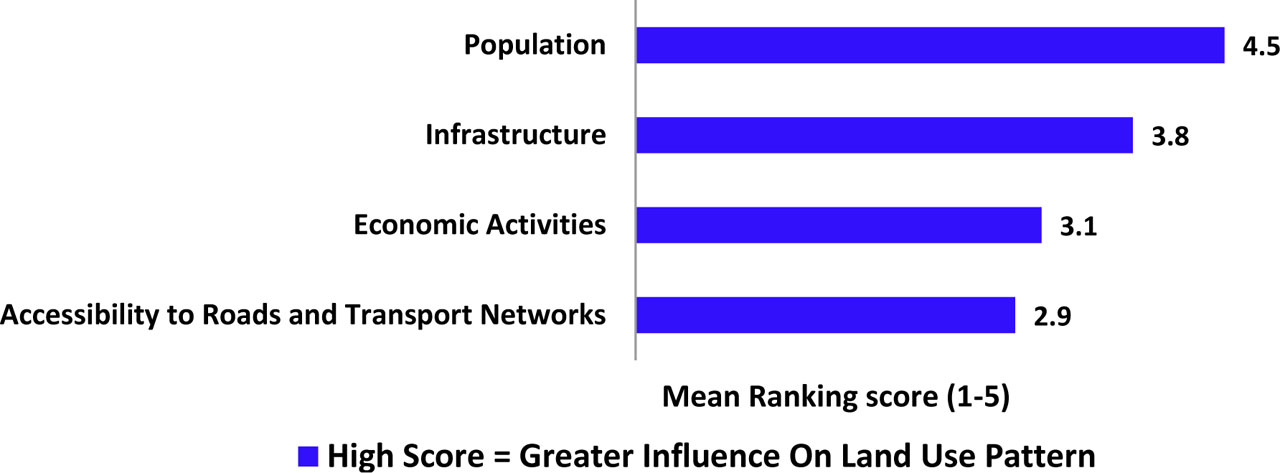
Figure 5:
Mean ranking result of factors determining land use patterns in Baghdad city
3.3.2. Spatial Distribution of Land Use Types
Traffic congestion is a persistent issue in areas characterized by high mobility and land use density (Yap et al., 2022). The land use categories for study represent (Residential, Institutional, Commercial, Educational, Recreational and Industrial) as a categorical variable. To demonstrate the impact of land uses on the intersections studied, the area surrounding the intersections and the key activities within the region were identified. Additionally, the primary roads facilitating traffic flow into and out of these intersections were analysed. This information is detailed in Figure 6 and 7 / Table 1.
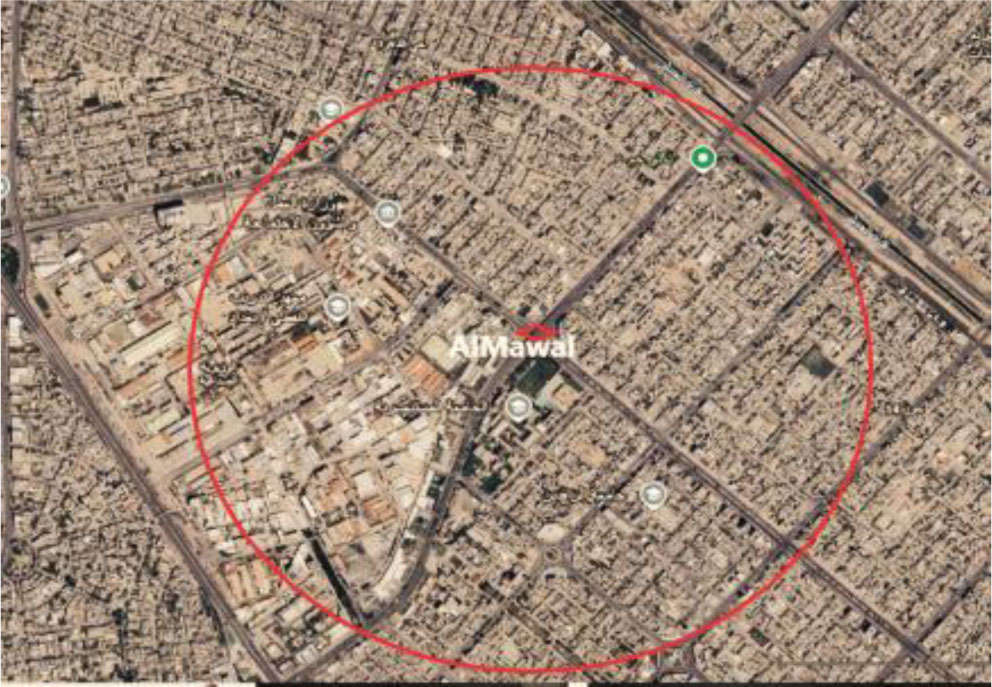
Figure 6:
Area surrounding Al-Mawal
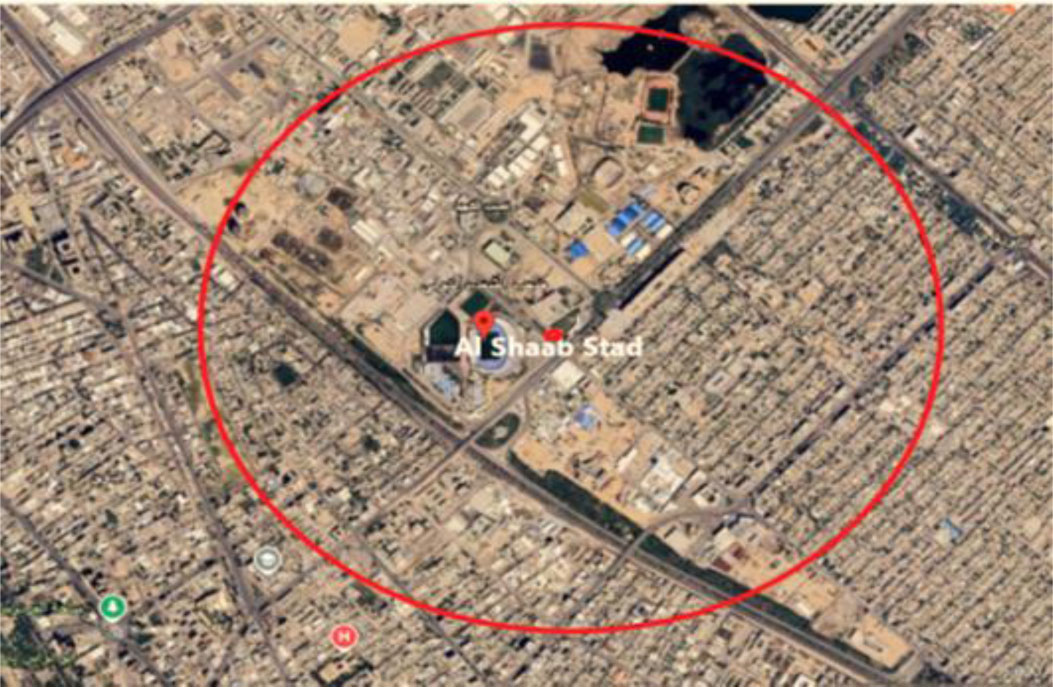
Figure 7:
Area surrounding Al-Shaab stadium
Table 1:
Land use distribution within the study intersections zone
| Intersection name | Points of attractive | Type use |
|---|---|---|
| Al-Mawal Intersection | Al-Mustansirya university | Education |
| Al Rafidian college dentist | Education | |
| International school | Education | |
| Al Sakhra intesection | Commercial | |
| Nakhla intersection | Commercial | |
| Restaurant | Recreational | |
| Cafés and parks | Recreational | |
| Bulding housing | Residential | |
| Directorate of Russafaa 1st education | Institutional administrative | |
| Shahriar gardens and halls | Recreational | |
| Al Wazereyah industrial | industrial | |
| Schools | Education | |
| Al Shaab Stadium Intersection | Al Shaab stadium | Recreational |
| Ministry of oil | Institutional administrative | |
| Al Rubaie street | Commercial | |
| Zayona amusement park | Recreational / commercial | |
| Sindbad amusement park | Recreational | |
| Social Security department | Recreational | |
| Zyona water city | Recreational | |
| Ministry of youth and sport | Institutional administrative | |
| Ministry of interior | Institutional administrative | |
| Schools | Education | |
| Building housing | Residential | |
| Police academy | Education |
3.4. Data Collection and Field Survey
To investigate the impact of land use and land-use mix on urban intersection congestion, a comprehensive data collection process was conducted. The data was categorized into two primary sets: traffic performance data (dependent variables) and land-use characteristic data (independent variables).
3.4.1. Traffic Data and Variable Definition
The survey was conducted over a 5-day period, with quantitative measurements of traffic during peak hours (morning 07:30 Am – 09:30 Am and evening 1:30 PM – 3:30 PM). This sampling bin produced 120 independent 15-min observation intervals at each sampled site. All calculated traffic volumes were then converted to PCEs per hour to allow comparison of various vehicle categories, which differ in capacity impacts. By using a dual approach: SIDRA Intersection software and procedures in the Highway Capacity Manual (HCM 2010) for estimating the congestion at selected intersections. Dependent on the software inputs (i.e., geometry and signal timings), the parameters chosen for the two signal intersection analysis approaches are grouped by condition type, as displayed in Table 2. In both tools, the back-of-queue length, average speed, delay, and V/c techniques have been calculated to evaluate the performance of these intersections. Also, to ensure both theoretical and practical consistency.
Table 2:
Parameters used in study for evaluating congestion
| Condition | Parameters | SIDRA | HCM 2010 |
|---|---|---|---|
| Geometric conditions | Area type | 1 | 1 |
| No. of lane | Input user | Input user | |
| Average length width | 3.5 [m/lane] | 3.5 [m/lane] | |
| Grads | 0% | 0% | |
| Parking condition | No | No | |
| Volume by movement | [Pcu/hr] | [Pcu/hr] | |
| Ideal saturation flow rate | 1950 [Pcu/hr] | 1930 [Pcu/hr] | |
| Peak hour factor | Default | Default | |
| Per cent heavy vehicle | Default | Default | |
| Traffic conditions | Local buses stopping | Al Mawal intersection: Yes Al Shaab stadium intersection: No | Yes No |
| Parking activity | Al Mawal intersection: Yes Al Shaab stadium intersection: No | Yes No | |
| Approach speed [k/h] | Default | Default | |
| Signalized conditions | Cycle length [sec] | 138 sec at Al Mawal 150 sec at Al Sheab | 138 sec at Al Mawal 150 sec at Al Shaab |
| Green time [sec] | 25 sec at Al Mawal 33 sec at Al Shaab | 25 sec at Al Mawal 33 sec at Al Shaab | |
| Amber time, all red, clearance [sec] | 5 sec | 5 sec | |
| Interval (intergreen) | 2 sec | 2 sec | |
| Actuated operation | A | A | |
| Phase plane | Yes | Yes | |
| Analysis period [hr] | AM peak PM peak | AM peak PM peak |
To make the findings of SIDRA and HCM 2010 empirically reliable, the findings of these two models were extensively validated through a triangular comparison with field measurements and time-synchronous videos. This cross-validation process will ensure the models we synthesized accurately reflect the actual traffic phenomena at the test sites, providing a solid foundation for further regression analysis. The survey was qualitative and multidimensional, pointing to discretize travel purpose and validate land-use intensity. 158 questionnaire forms for a valid traveller behaviour survey were distributed and completed by trip-makers at the study sites. According to Table 3, the top traffic participants are work, education, shopping, and recreation, which account for about 85. To put these findings into more context, semi-structured interviews were also conducted with stakeholders (e.g., traffic police and local shop owners) and revealed a morning peak period, as observed in other cities with a single strong peak (7.30–9.00 AM), see Figure 8.
The resulting modal comparison (Figure 9 and 10) shows that within both the intersections, the dependence on the private sector is high with the private cars and taxi services as the predominant modes. There exists an interesting anomaly in informal transport in that Tuk-tuk constitute 5% of the total at the intersection of Al-Mawal and entirely omits Al Shaab Stadium. This opposition is said to be partially caused by the stringent regulations of the Baghdad Municipality in Zayona, which is among a host of policy-related causes which highly predetermines friction in operations in the urban areas under scrutiny.
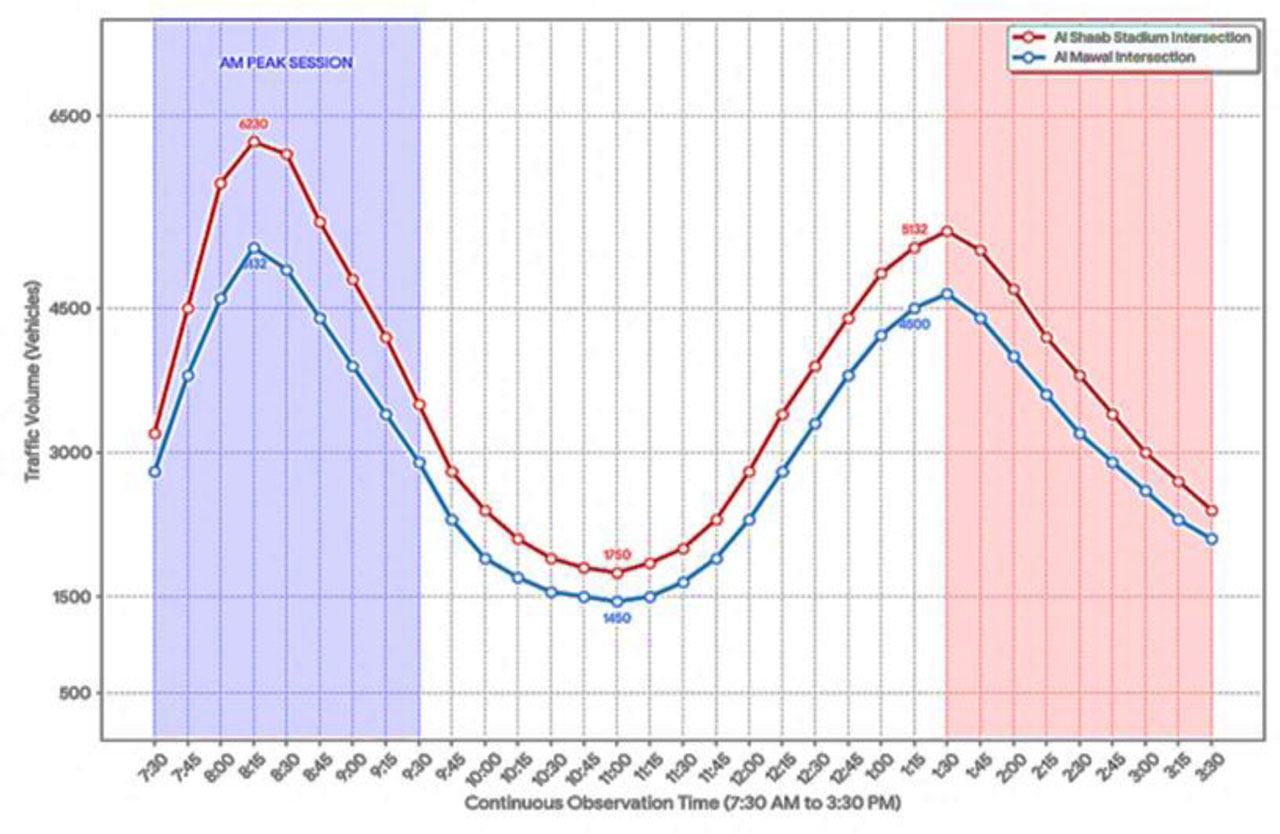
Figure 8:
Daily traffic volumes in the study sites
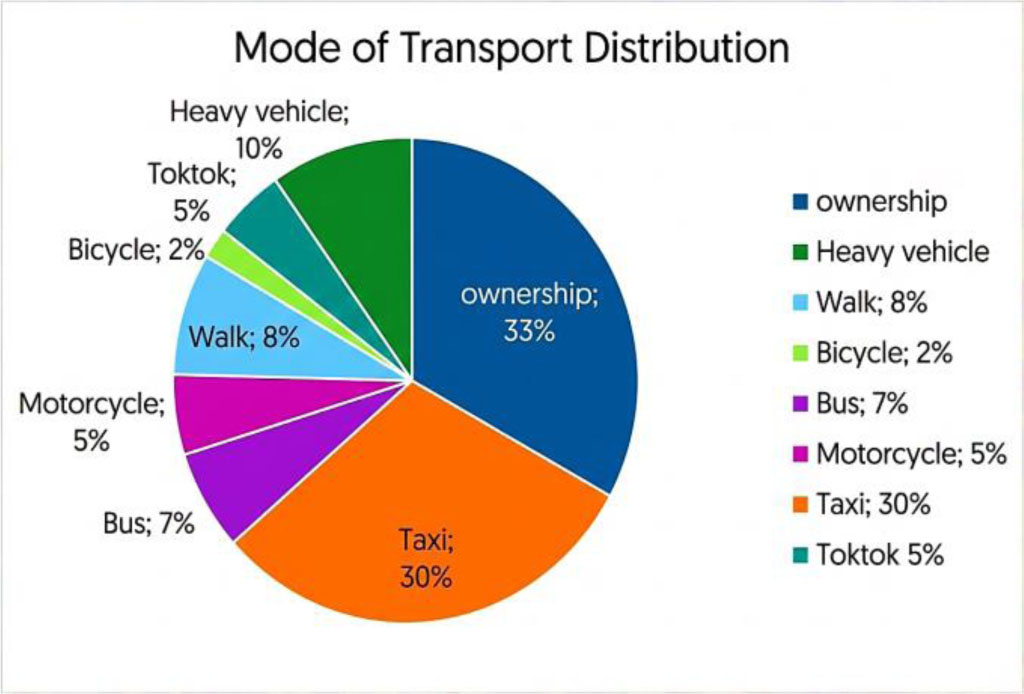
Figure 9:
Mode transportation at Al Mawal intersection
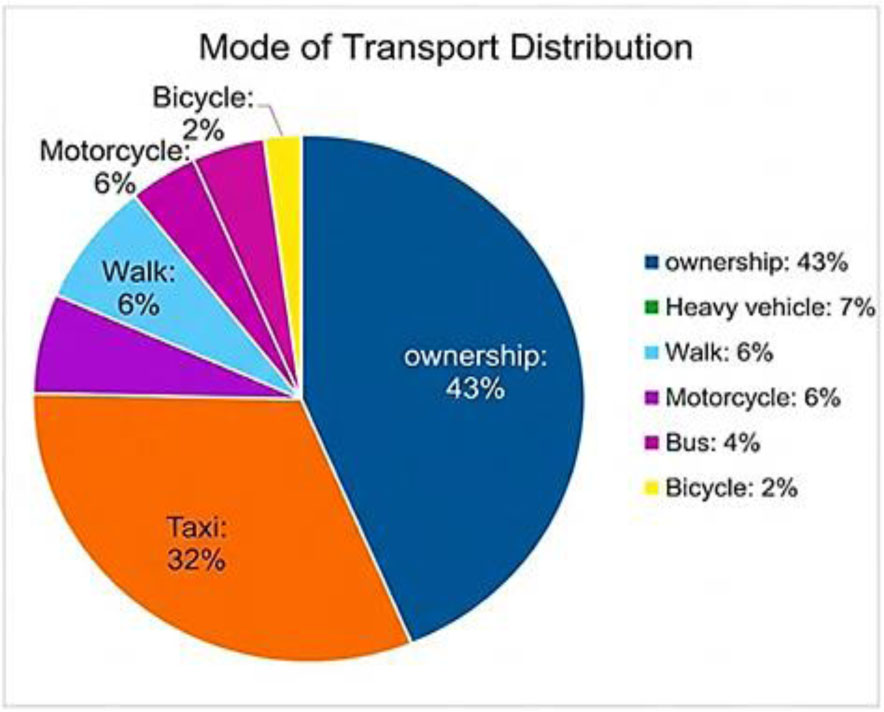
Figure 10:
Mode transportation at Al Shaab stadium
3.4.2. Land Use and Mixed-Use Collection
To account for the size discrepancies between the two study sites, the analysis shifted from absolute land measurements to relative proportions. This normalization was essential to standardize the data, ensuring that the regression model reflects the functional composition of the area rather than being skewed by its total scale. The raw areas of the distinct land-use categories (Ai) were first calculated for each type within the study area and expressed as percentages (Pi) by dividing each Ai value by the total land used in the region under consideration. At the same time, land-use data (at a category level) for our case study areas around the chosen intersections were officially collected from Mayoralty of Baghdad using updated master plans and land-use maps to classify and measure proportions of functional types within a surrounding 1-km buffer zone for each intersection, those were initially characterised into six categories (Residential, Commercial, Educational, Institutional and Recreational & Industrial). This detailed classification categorization serves as the spatial ‘baseline’ for the independent variables used in the next phase of traffic modelling, although industrial use was later excluded after preliminary analysis showed its negligible impact. Equation 1 presents the entropy index for calculating mixed use expressed as MU.
Where:
MU – mixed use as entropy index,
K – the number of land use categories (in this study, it is 6 categories because the industrial use X6 had been neglected).
Pi – the proportion of the area of each use to the total area.
4. Results
4.1. Congestion Estimation
The surveys encompassed all details of the study area, including the geometric characteristics of the area containing the two signalized intersections. Based on the cycle plan, an assessment was conducted using two methods for analysing traffic signals to estimate the congestion level depending on queue length (LOS), (V/C), delay, and average speed. The two methods are represented by SIDRA Intersection 9.1.1 and the Highway Capacity Manual (HCM 2010). SIDRA Intersection 9.1.1 is a micro-analytic software that supports the design and evaluation of both individual intersections and networks of intersections (Transportation Research Board [TRB], 2010). In contrast, HCM provides a systematic framework for assessing highway performance at each study site (Federal Highway Administration [FHWA], 2018). Analytical tools like SIDRA Intersection and HCM2010 provide valuable insights into capacity, level of service, and vehicle delay, accounting for various environmental and geometric conditions (Sthle et al., 1989). Depending on the parameters chosen for the two signal-analysis, approaches are grouped in section 3.4.1. Table 2 and 4 show the result of traffic congestion estimation.
Table 4:
Result of estimation traffic congestion
| Output results | SIDRA model intersection I | SIDRA Model Intersection II | HCM 2010 intersection I | HCM 2010 intersection II | Difference SIDRA&HCM I | Difference SIDRA&HCM II |
|---|---|---|---|---|---|---|
| Back of queue length [m] | 1014.5 | 1277 | 1832 | 1645 | −38 | −30.20 |
| Av. Delay [sec] | 115.4 | 336.7 | 274 | 487.3 | −58 | −30.9 |
| Degree [V/C] | 1.48 | 2.5 | 2.83 | 2.81 | −47 | −11 |
| LOS | F | F | E | E | - | - |
| Av. speed [k/h] | 22.4 | 18.6 | 20.12 | 17.34 | 70.9 | 13 |
The analysis indicates that the second intersection (Al-Shaab Stadium) experiences higher congestion, with an approximate level of 374. Also, the results indicated that the outputs from the SIDRA program are closer to the observed site results and more accurate than the analytical method using the Highway Capacity Manual (HCM) 2010, even though results from both approaches suggest that the parameters used in the analyses are appropriate and the differences between the two methods are not substantial. Adjusted R2 value of 0.8134, indicating a relatively strong relationship. The observed back-of-queue values exhibit a strong association with SIDRA Intersection predictions, as indicated by adjusted R2 values approaching unity. In contrast, the relationship between the observed data and the back-of-the-queue estimates derived from the HCM2010 method appears weak. The scatter plots and linear-fit curves in (Figure 11 and 12) illustrate the correspondence between the measured field data and the two back-of-queue models. Collectively, these findings indicate that SIDRA Intersection and HCM are potentially useful when planning, assessing, and designing intersections in the Iraqi setting.
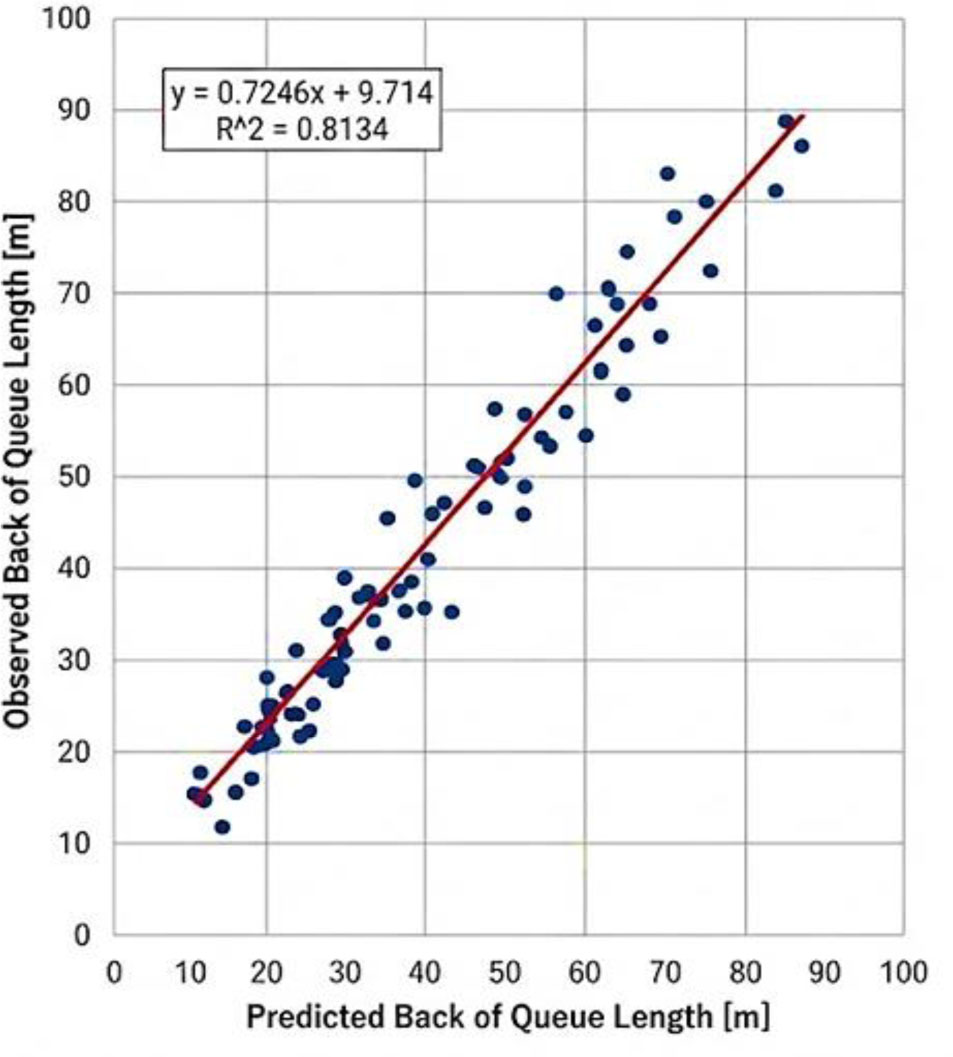
Figure 11:
Linearity of observed back of queue length and that predicted by SIDRA 9.1.1
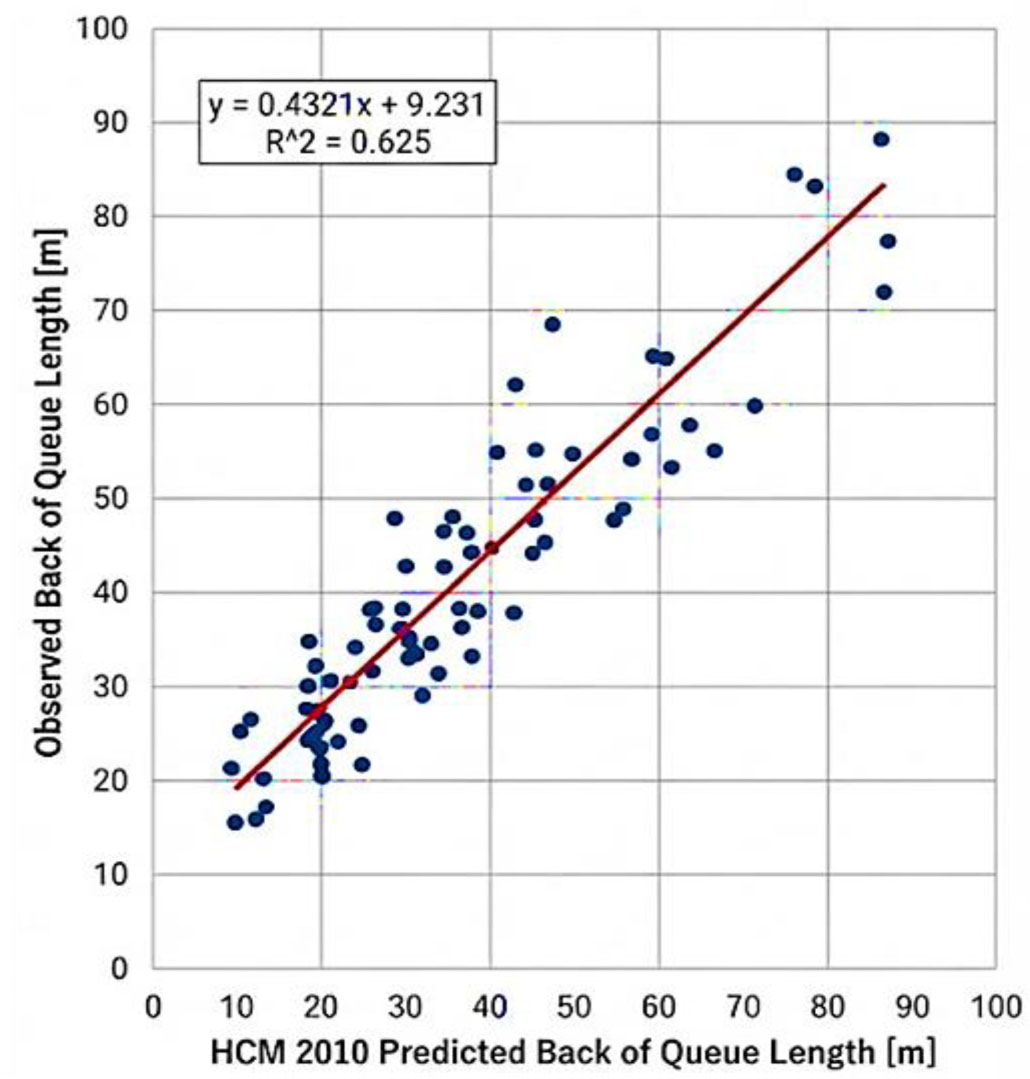
Figure 12:
Linearity of observed back of queue length and that predicted by HCM2010
4.2. Building Model and Descriptive Statistic
The objective of this section is to determine the quantitative measure of the causality between the land-use patterns and the level of traffic congestion that was observed in the intersections that were studied. To do so, the Multiple Linear Regression (MLR) framework was used to develop a predictive model that isolates the contented influence of the different land-use variables on the back of queue length. The modelling process follows two phases in a sequential order, where Phase I comprises of the study of the baseline model, where the primary variables are conventional land-use densities (X1-X6), and Phase II is where the refined model is developed with the addition of a variable to the baseline model, which is the mixed use index (X7), which would improve the model explanatory power and be more empirical.
4.2.1. Initial MLR Model (Baseline model)
Recent studies by Zhang & Li (2024) have shown that multiple linear regression provides interpretable results for modelling congestion when using “spatially weighted” land-use indicators. To investigate the impact of land use on intersection congestion, a multiple linear regression model was constructed as follows Equation 2. below.
Where:
Y - dependent variable as congestion (Back of queue length [m]),
á - estimable intercept term,
ß - corresponding coefficient,
á - estimable intercept term,
ß - corresponding coefficients,
X - the independent variables as:
X1 – residential land use density (The population or the number of residential units located in an area),
X2 – commercial land Use Density: Between the number of stores and shopping centres in the area,
X3 – the density of the Institutional Land Use: The density of institutional land use within the region,
X4 – Recreational land use: Existence of recreational or cultural facilities that will bring traffic,
X5: Educational land use: Schools and universities,
X6: industrial density.
Each of the independent land-use variables (X1 to X6) was as a percentage of the land area within the intersection influence zone. The length of the Back of Queue in meters [m] is the response (Y). Therefore, the regression coefficients (β) of phases I and II represent how much of a change (measured in meters), will be obtained that is 1 percentage point higher in each category of land-use.
Multiple linear regression was performed using a stepwise approach. The model development process involved adding and dropping predictors in a series of steps until no further statistically justified changes were made warranted. This methodology has led to the construction of a good working regression model. Statistically significant predictors are P-values that were significant at a 95 percent confidence level were retained in the final model.
The outcome of the initial multiple linear regression analysis (Equation 3) indicates that there is a considerable difference between land use types in their impact on traffic congestion. The most significant source of the back-of-queue length was commercial density (X2), with a positive coefficient of 118.195. Conversely, there is a weak negative correlation between the industrial density (X6) and (−5.98). So, we rejected this variable. More interestingly, this model produced a large constant (124.43), indicating that there is indeed a large underlying baseline congestion, which is not influenced by the surrounding land-use factors. The details will be discussed in the section discussing engineering interpretations of these coefficients and the baseline constant. Finally, five land-use types were selected as independent variables in the linear regression model.
The initial computation in the statistical analysis was to obtain a baseline Multiple Linear Regression (MLR) model to measure the extent to which traditional land-use densities are directly related to traffic performance. A good set of data used in making this estimate was N=120 observation intervals in all the subjects combined. Tables 5 and 6 also present an analysis of the model’s reliability. The outcomes of ANOVA show that the correlation between the types of land-use and congestion rates can be statistically significant (F = 647.55, P < 0.001), and the coefficient of determination (R2 = 0.613) demonstrates that the two variables can explain the amount of 61.3 of the observed deviations in the levels of queue length.
Table 5:
Summary for baseline model
| Model | Sum of squares | df | Mean square | F | P-value |
|---|---|---|---|---|---|
| Regression | 5736355.381 | 5 | 1,147,271.076 | 647.55 | <.0.001) |
| Residual | 201839.119 | 114 | 1770.518 | ||
| Total | 5983194.500 | 119 |
Table 6:
ANOVA results for overall model significance
| Model | R | R2 | Adjusted R square | Std. error of the estimate |
|---|---|---|---|---|
| 1 | 0.783 | 0.613 | 0.565 | 18.235 |
Subsequently, the contribution of each land-use category was investigated after model validation. Table 5 provides a descriptive picture of the individual contributions of each land-use category, which were analysed, and shows how different urban functions may influence traffic demand. Because p-values for the full model across all categories are less than 0.05, the null hypotheses of no effect of land use on congestion can be rejected for all included variables.
Table 7:
Regression coefficients for baseline land-use variables
| Variables | Estimate | Std. error | Significance | 95% Confidence interval | |
|---|---|---|---|---|---|
| Lower bound | Upper bound | ||||
| Commercial | 30.402 | 1.345 | .000 | 27.765 | 33.038 |
| Education | 29.359 | .653 | .000 | 28.08 | 30.64 |
| Recreational | 14.152 | 5.945 | .000 | 2.50 | 25.80 |
| Institutional | 19.234 | .552 | .000 | 18.15 | 20.31 |
| Resident | 20.153 | 1.221 | .001 | 17.76 | 22.54 |
These results clearly demonstrate that there are statistically significant variations in the level of congestion created by different land uses. In particular, the coefficients of commercial and education densities were estimated as the largest (30.40 and 29.35), indicating that these two land-use types play a major role in traffic congestion at the analysed intersections. The statistical evidence does reproduce, in a broad sense, field observations of trip generation peaks at the heaviest aggregate commercial and educational activities on Baghdad.
4.2.2. Refined MLR Model with Mixed-Use
While the first phase demonstrated the significant impact of individual land-use densities on traffic congestion, the initial coefficient of determination (R2 = 0.613) indicates that a substantial portion of the variance remains unexplained by density alone. In complex urban environments like Baghdad, structural density is not the sole driver of traffic bottlenecks; functional diversity and the spatial integration of activities also play a pivotal role in shaping travel demand patterns. Conventional models relying on strict single-use zoning often fail to account for the residual variation in urban congestion. Many studies, indicate that neglecting the measure of ‘Mixed-Use’ leads to an overestimation of the influence of factors such as population density. (Christian et al, 2011; Bordoloi et al, 2013; Manaugh & Kreider, 2013).
To address this limitation, mixed use was added in Phase II as variables X7. For each study area, functional diversity was estimated using the Entropy Index (ENT), as described in Section 3.3.2. A clear gap was observed between vehicle density at the two sites: intersection of Al Shaab Stadium achieved a higher entropy of 0.87, followed by Al-Mawal with 0.82. For a typical planning environment 0.87 could indicate healthy urban vitality and function, however in a Baghdad at-grade intersections this correlates to “Functional Conflict”. Administrative, educational, and commercial trips are close to each other at Al-Shaab Stadium; thus, a huge swirl is generated by the competing trip purposes that today’s road layout no longer can handle. Here, by taking the advantage of such Mixed-Use in the analysis, we came up with the refined regression model below:
The mixed-use variable X7 was added to enhance the model’s sophistication, explanatory power, empirical realism, and statistical fit. Specifically, the model demonstrates that Mixed Use (X7) plays a dominant role in congestion at the intersection level, with conflicting trips from different land uses interacting at the crossing point in repeating patterns. The model with better statistical performance, and as can be observed in Tables 8 and 9, is able to explain the operational friction during peak hours at Baghdad, is the calibrated model.
Table 8:
Final regression coefficients and multicollinearity diagnostics
| Independent variables | Coefficients | Std. error | t-value | Sig. (p-value) | VIF |
|---|---|---|---|---|---|
| Constant | 115.200 | 12.450 | 9.253 | .000 | - |
| Residential density | 28.450 | 4.120 | 6.905 | .000 | 1.42 |
| Commercial density | 105.120 | 8.340 | 12.604 | .000 | 2.15 |
| Institutional density | 22.100 | 3.560 | 6.208 | .001 | 1.68 |
| Recreational land use | 21.800 | 4.800 | 6.108 | .000 | 1.24 |
| Educational land use | 29.150 | 3.200 | 6.609 | .001 | 2.08 |
| Mixed use | 42.600 | 5.150 | 8.271 | .000 | 2.45 |
Table 9:
Modell summary (refined)
| Model | R | R2 | Adjusted R square | Std. error of the estimate |
|---|---|---|---|---|
| 2 | 0.916 | 0.84 | 0.82 | 15.42 |
Table 10:
ANOVA results for the refined regression model
| Model | Sum of squares | df | Mean square | F | Sig. |
|---|---|---|---|---|---|
| Regression | 4,988,083.380 | 6 | 831,347.23 | 98.87 | 0000 |
| Residual | 950,111.120 | 113 | 8,408.06 | ||
| Total | 5,98,3194.500 | 119 |
The normality assumption and the validity of the residuals were tested to establish that the refined MLR model is statistically valid. The histogram in Figure 13 shows that the distribution of the residuals is centred at zero. In addition, the Normal P-P Plot indicates that the cumulative probabilities observed are in line. These are with respect to the anticipated normal distribution curve. These diagnostics confirm that the error terms in the model are normally distributed, thereby making the estimated coefficients (β) and the predicted queue lengths reliable.
The statistical findings as shown in the tables above prove the strong interrelation between land use patterns and congestion in the urban traffic. The model that has now been augmented with Mixed-Use (X7) has a high explanatory power. It is important to note that the Commercial density (X2) is the highest predictor of congestion with a coefficient of 105.120, because the rates of trip-generation are high when it comes to shopping and business. More to the point, the new variable, Mixed use (X7) produced a significant positive coefficient of 42.600 (with p < 0.001). This means that traffic congestion goes up by 42.6 units in case of one unit change in mixed-use density, other things held constant. The t-value of X7 (8.271) is high and highlights its criticalness in the model. This observation has implications on transport planning in the sense that although it is argued that a varied land use is good in terms of urban vitality, it places a lot of strain on the available road network. The agglomeration of residential, commercial, and service functions causes the increase of friction at the intersection, which subsequently reduces the flow capacity along with delaying the flow. These findings confirm the hypothesis that uncontrolled mixed-use development is one of the primary factors contributing to localized congestion and necessitate certain traffic engineering interventions to ensure a balance between land-use heterogeneity and mobility levels. At the same time, the findings of this research, especially the significant correlation between land use type and traffic delays (R2 = 0.82), were like those observed worldwide regarding the effects of high urbanization. This is in line with the conclusions of Hamdouni et al. (2024), who stated that the unregulated construction of residential buildings in cities such as Rabat places significant strain on infrastructure and environmental conditions. The large volume of institutionalization and institute activities in the setting of Baghdad is one of the key contributors to traffic jams, as this is also associated with the situation in other developing metropolises, as urbanization processes tend to supersede transportation policies.
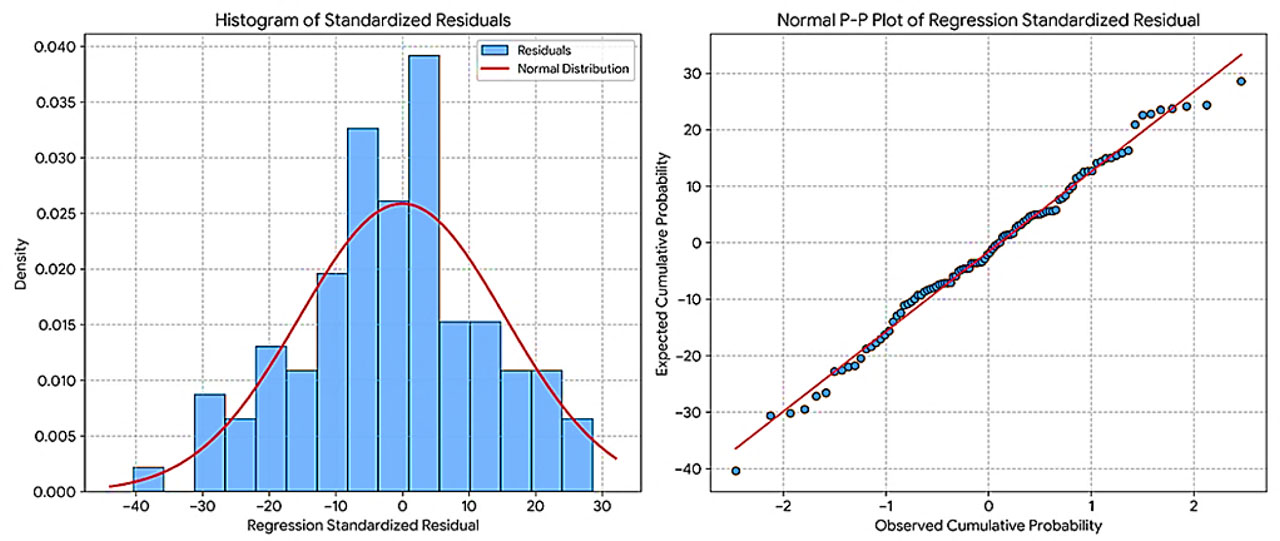
Figure 13:
Diagnostic plots for regression residuals: (left) Histogram of standardized residuals; (right) Normal P-P plot
5. Discussion Results
The analytical findings of the research paper constitute its primary empirical evidence that the interplay between land-use patterns and traffic performance in Baghdad is a complex problem. The model’s predictive accuracy, which has increased to an Adjusted R2 of 0.840, demonstrates the effectiveness of integrating the philosophy of the Mixed use (MU) index (X7). This represents a methodological improvement over Li (2020) and Rajeh et al. (2022), who argued that sophisticated regression models might be able to explain intricate urban traffic flows when accurate explanatory variables, including urban morphology, are considered. It is in contrast to descriptive traffic parameters and a volume-to-delay relationship, which is provided by Asmael et al. (2024) that avails a tool which can be proactively applied in order to make predictions of a Back of Queue length, thus allowing the city officials to model the impacts of a land use change on traffic even in advance.
For Impact of Commercial density (X2), the result shows that business use is the main contributor to congestion, which aligns with Zhang et al. (2017), who found commercial Points of Interest (POIs) to be crucial traffic attractors. For the Iraqi cities studied here, these findings are consistent with those of Naser et al. (2025), who concluded that shopping is the main trip generator to Central Business Districts and accounts for a significant portion of urban travel demand. These findings also agree with those of Alobaydi et al., (2020) on morphometric transformations in intersections, such as those implemented at Jadriyah, where a chaotic approach to commerce can downgrade the level of service. “In addition, as pointed out by (Bao et al., 2022), commercial intensity is also frequently an over-represented factor in urban “hotspots” of congestion, leading to the synchronized peak-hour flows identified here (Asmael et al, 2024; Yap et al, 2022).
In contrast with some theories that claim that mixed-use decrease the level of traffic congestion because they shorter trip lengths (Richards and Lym, 2009), mixed use (X7) in Baghdad is positively correlated to the severity of congestion (coefficient: 42.600). This is due to the effect of “trip overlapping,” where residential, commercial and educational activities converge in one node but with a lack of an integrated micro-scale infrastructure. This is consistent with the results reported by Naser et al. (2025) in the city of Nasiriyah, where the densification of a mix of trip purposes within a confined urban environment was found to exert stress on the transport network. Concurrently, Jasim et al. (2021) in Al-Kut City, Iraq, confirmed that unplanned land-use distributions significantly aggravate urban congestion in the Iraqi context. This functional friction, as captured by Aworemi et al. (2025), demands more holistic management solutions than the mere capacity scaling introduced by Talib et al. (2023).
The ‘Functional conflict’ discovered in the high-entropy junctions of Baghdad is not unique but rather indicates a pattern of Iraqi urban development in which commercial and education services are centrally placed with little heed to the geometric capabilities of the road network. This result is consistent with Naser et al. (2025) who observed that excessive loading caused by ad-hoc functional clusters is the main cause of both traffic congestion and premature damage of pavements, in their study about Al-Nasiriyah City if Iraq. By connecting these two pieces of research, it follows that the ‘Mixed-Use Paradox’ from the capital, in which larger values for the entropy index (e.g. 0.87) aggravate queue lengths, reflects issues found in Al-Nasiriyah. These two examples both illustrate decentralization as an urgent requirement, however as clarified by Naser et al. (2025) have contended, “In order to resolve these conflicts, other urban centres should be opened up for transit traffic to provide some relief in the operational pressure placed on overloaded common corridors.
The high baseline constant isolated in the estimates suggests that a portion of the congestion is “structural” and unrelated to land-use density. This is primarily due to poor traffic control and signal coordination, as reported by Alkaissi (2023). Also, the “operational friction” noted at intersections is worsened by the lack of parking. Abood and Khudhair (2025) showed that the adoption of multi-storey parking facilities in central Baghdad zones would restore effective lane widths by reducing illegal street parking, which currently suppresses carriageway throughput and tightens the operational capacity of the road network.
Finally, regarding diagnosis, the model’s compliance with MLR assumptions (VIF < 3.0 and normal residuals) ensures superior performance compared to a similar methodology employed by Shi & Du, 2022; Bratsas et al. 2019. Although research such as Wang & Debbage (2021) are specific to American urban form, the consistent findings on congestion and city shape suggests that there is a universal relationship. Yet the situation in Iraqi cities, where urbanization dynamics are in many cases faster than infrastructure construction, requires well- calibrated, data-driven models localized for the specific circumstance, such as those developed in this research, to offer realistic insights easily applicable for transportation planning.
6. Conclusion
At first, the indicators, including back-of-queue, delay, and V/C, are found to be reasonable and reliable for estimating congested states at urban intersections. The study used the back of queue length as a measure of congestion in a multiple linear regression to assess the contribution of different land-use densities to traffic congestion. The greatest contribution of the research was the incorporation of mixed use into the analytic framework, resulting in a more detailed representation of traffic dynamics at urban intersections. The empirical findings showed that commercial density is the most important factor driving congestion, followed closely by mixed use. Emphases discovered that functional conflict, stemming from the mix of land use in Baghdad, generates traffic congestion due to the random and uncoordinated application of traffic rules at junctions, turning diversity into straws rather than a distance-minimizing property. Nevertheless, one of the most important conclusions of this paper is that land-use activity cannot be considered the sole determinant of congestion at intersections. Through-traffic was also significant, as vehicles use the intersections only as transit to other destinations, without necessarily visiting the facilities in the vicinity. In particular, the research indicates that one of the main causes of this phenomenon is educational land use; this creates colossal, concentrated trip bursts that act as through-traffic during the hourly peak and severely exceed the intersection capacity. Also, another significant contributor to congestion, according to the study, is the inefficiency in traffic control, namely, inappropriate signal timing, as well as phases of work which do not match the real traffic flows. The study also concludes that land-use arrangements that are inappropriate cause greater dependence on private cars and thus escalate congestion. In general, land use and congestion at urban intersections significantly impact on travel demand, accessibility, and mode choice.
7. Recommendation
Considering the empirical findings and the “Mixed-Use Paradox,” this study proposed different strategic interventions:
Transfer to Comprehensive management, as implement a “land-use priority” by connecting settlement of commercial buildings to the actual traffic capacity of the surrounding road network so that new construction does not go beyond environment and traffic carrying and intensity source. When cities are built.
Intelligent signalling systems, as Instead of traditional fixed-cycle timing, implement smarter, adaptive, and responsive signalling systems that facilitate real-time responses to “spikes” in learning and peak traffic hours, as found at Bagdad’s crossroads.
For through-traffic segregation, must use geometric or traffic operations designs to separate local access traffic from through (policy) traffic at key intersections and nodes of competing travel purposes to avoid an entire system collapsing into a gridlocked mess.
Using zoning to very tightly control high-intensity commercial development, especially at-grade intersections, to prevent “functional conflict” and protect the LOS.
Acknowledgements
With a heartfelt gratitude to all the support by the Al-Iraqia University and University of Shatrah / Iraq.
Notes
[1] Contributed by Author Contributions
I.H.N. designed the study, supervised the project and performed the data analysis. F.H.M. conducted the experiments. A.B.H. contributed to manuscript writing. All authors critically reviewed and approved the final version of the manuscript and agreed to be accountable for all aspects of the work.