

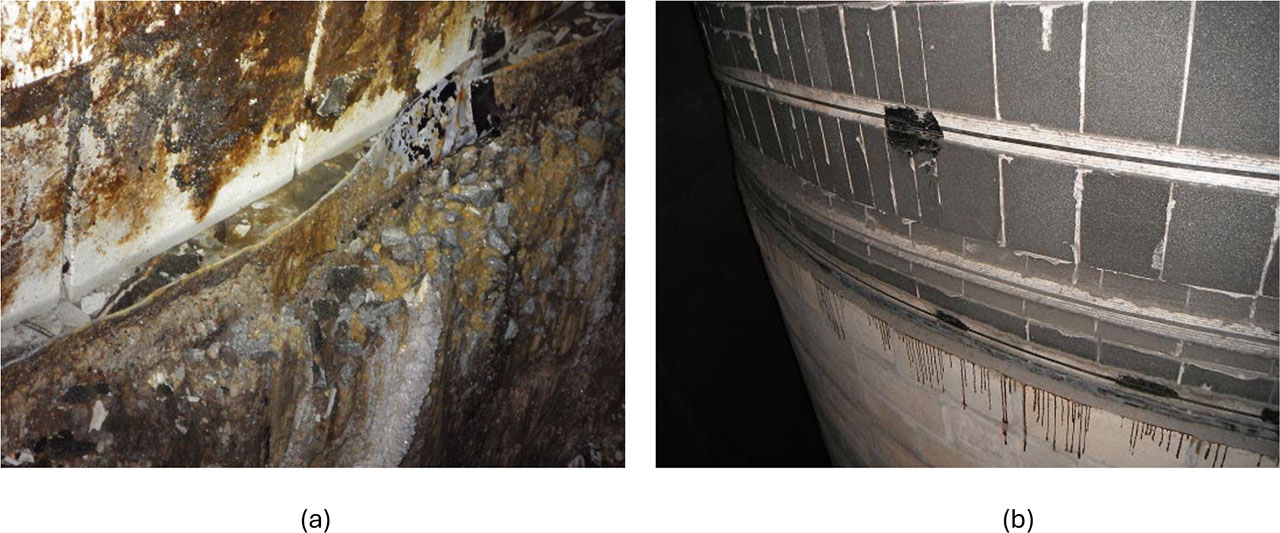
Figure 1:
Comparison of damage on the upper edge in 2020 (a) with the intact condition in 2012 (b) (Pesata, 2024)
Table 1:
Determination of the strength of individual samples along the height of the base (Pesata, 2024)
| ID / Elevation [m] | Compressive strength [MPa] | Corrected cube compressive strength [MPa] | Recalculated per ČSN EN 13791 |
|---|---|---|---|
| Z1 / + 8.0 | 29.7 | 33.4 | C 20/25 |
| Z2 / + 12.0 | 23.8 | 26.8 | C 16/20 |
| Z3 / + 16.0 | 20.6 | 23.4 | C 16/20 |
| Z4 / + 19.0 | 22.3 | 24.8 | C 16/20 |
| Z5 / + 20.0 | 22.8 | 25.7 | C 16/20 |
| Z6 / +20.5 | 18.5 | 20.6 | C 16/20 |
| Z8 / +21.0 | 13.4 | 15.1 | C 8/10 |
| Z9 / +21.0 | 14.9 | 16.7 | C 8/10 |
| Z10 / +22.5 | 14.6 | 16.4 | C 8/10 |
| Z12 / +22.5 | 13.7 | 15.8 | C 8/10 |
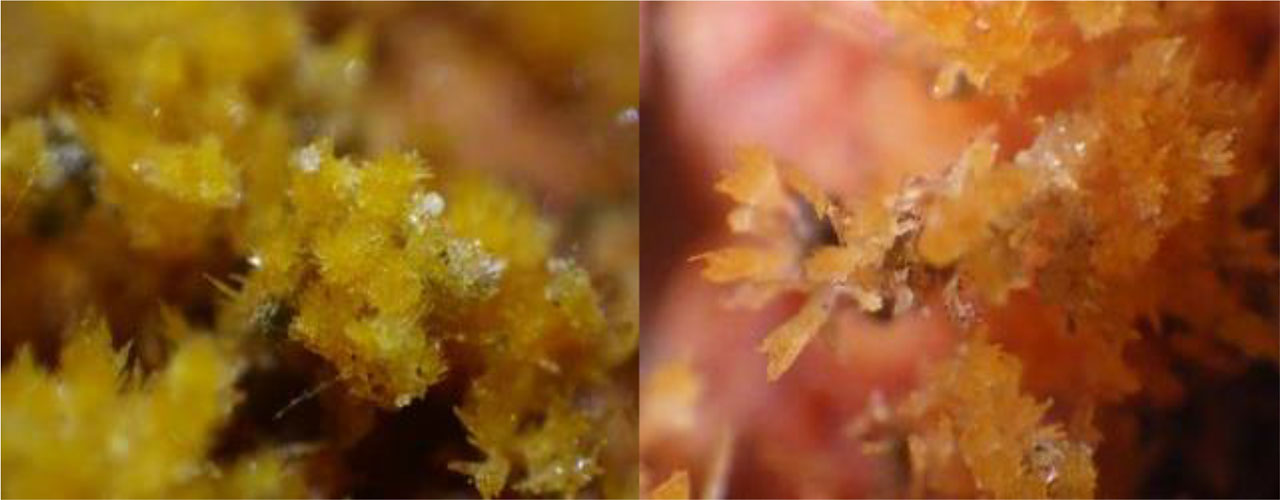
Figure 2:
Microscopic image of incrustations collected during condensate analysis (Pesata, 2024)
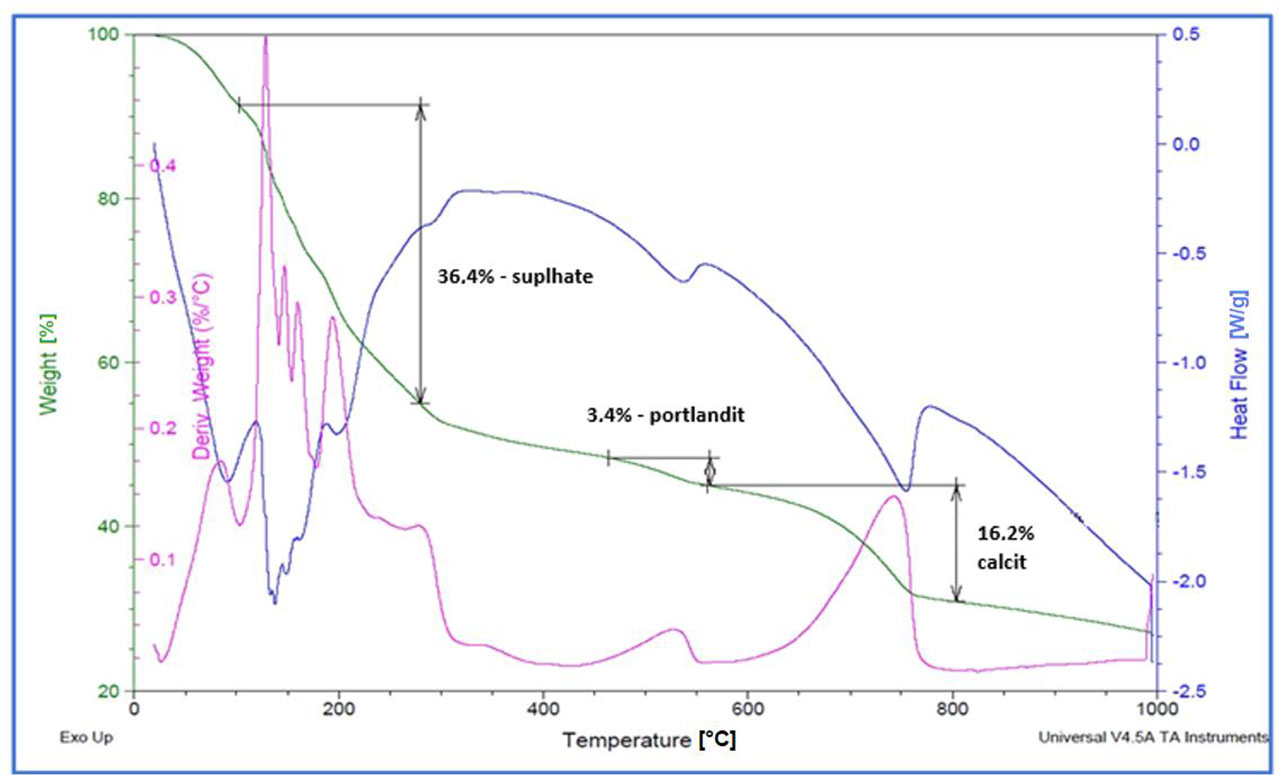
Figure 3:
The resulting reactions of the incrustation sample, as determined by a combination of DSC and TG methods (Pesata, 2024)
Table 2:
Material composition of individual samples (Pesata, 2024)
| Quantity of Raw Materials per 1 L of Mixture [g] | ||||
|---|---|---|---|---|
| Material | SSC | SV | EPX | UHPC |
| Finely ground blast furnace slag | 425 | 350 | x | x |
| Desulfurization product | 143.8 | x | x | x |
| Fly ash | 12.5 | x | x | x |
| Cement CEM I 42.5R | 12.5 | 150 | x | 650 |
| Silica sand | 1787.5 | 1500 | 1000 | 1330 |
| Water | 243.8 | 195 | x | 150 |
| Plasticizer – Glenium 300 | x | 7 | x | x |
| White microsilica | x | x | x | 70 |
| Ground limestone, grade 8 | x | x | x | 80 |
| MasterGlenium ACE 300 | x | x | x | 26 |
| CHRYSOFluid Optima 185 | x | x | x | 13 |
| Epoxy resin CHS-EPOXY 517 | x | x | 100 | x |
| Hardener Telalit 0846 | x | x | 44 | x |
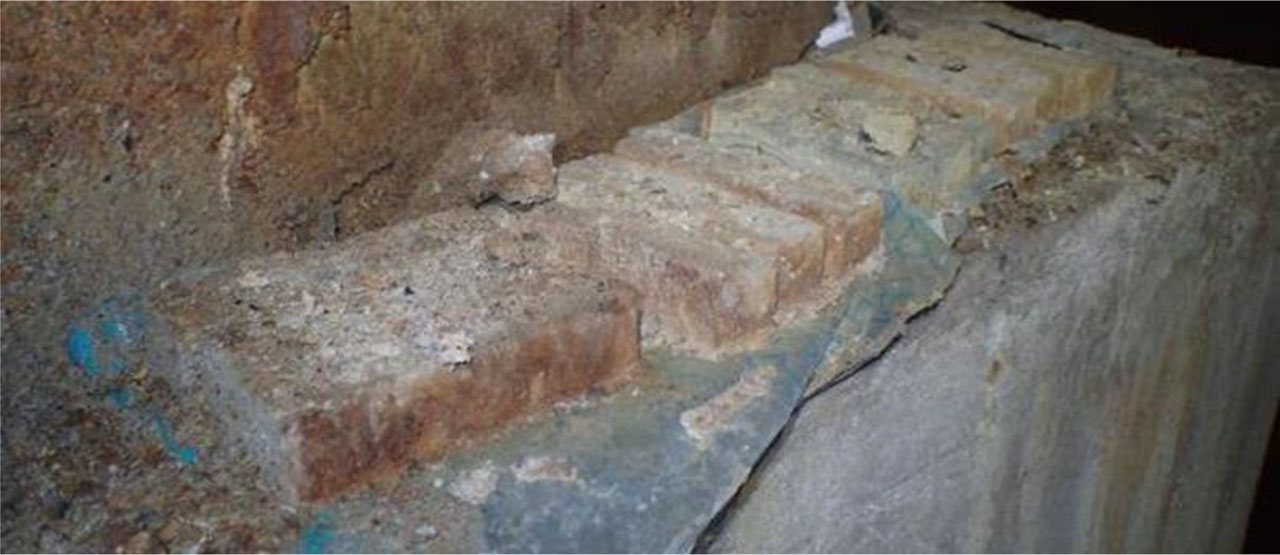
Figure 4:
View of the samples in the interspace after six months of exposure (before decontamination) (Pesata, 2024)
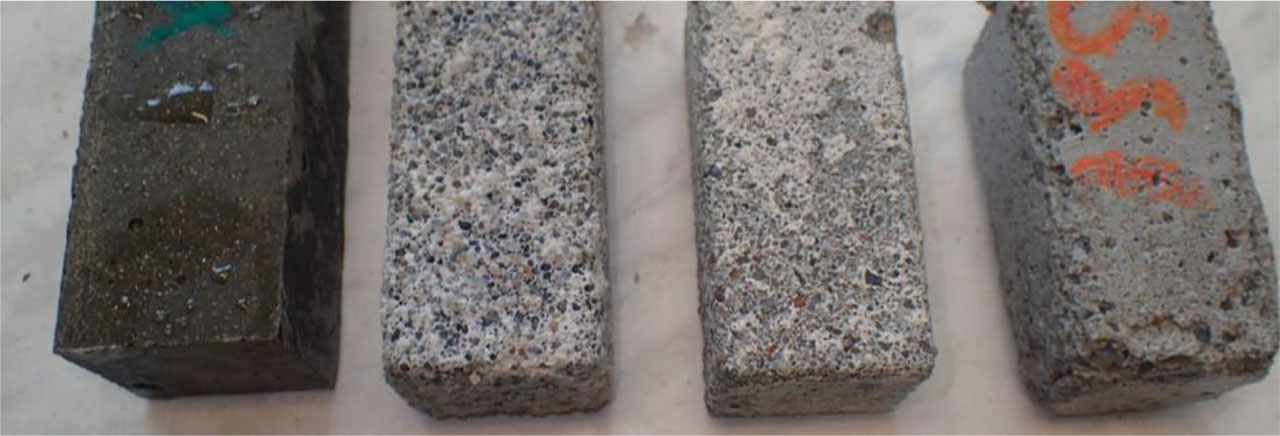
Figure 5:
Detail of beams stored in the laboratory (from left to right – EPX, SV, UHPC, and SSC) (Pesata, 2024)
Table 3:
Comparison of bending strength and compressive strength on test specimens (Pesata, 2024)
| Material Type | Reference compressive strength at 28 days | Strength in interspace after 6 months | Change in strength | |||
|---|---|---|---|---|---|---|
| Bending strength [MPa] | Compressive strength [MPa] | Bending strength [MPa] | Compressive strength [MPa] | Bending strength [%] | Compressive strength [%] | |
| SSC | 6.8 | 26.2 | 6.5 | 24.4 | −4.41 % | −6.87 % |
| SV | 12.5 | 63.1 | 11.2 | 56.4 | −16.80 % | −10.62 % |
| UHPC | 24.0 | 121.2 | 21.5 | 79.1 | −17.08 % | −34.74 % |
| EPX | 26.5 | 68.0 | 25.0 | 62.4 | −5.66 % | −8.24 % |
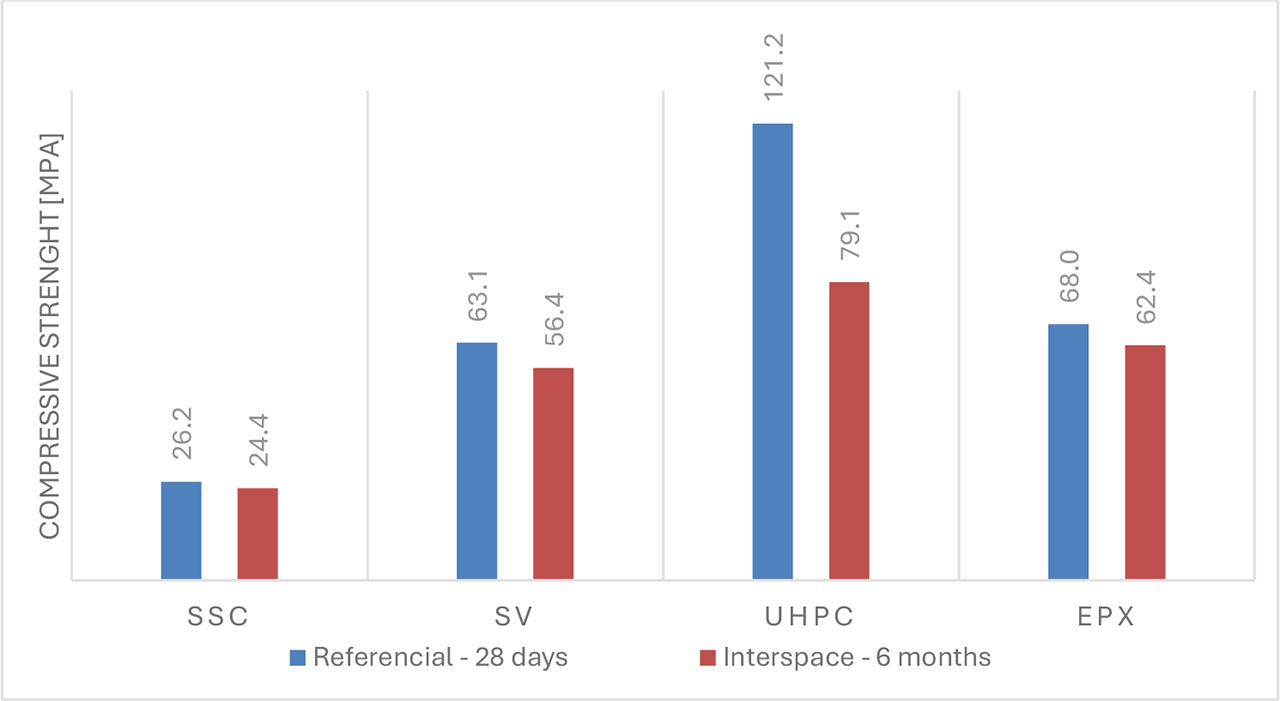
Figure 6:
Compressive strength reductions (Pesata, 2024)