

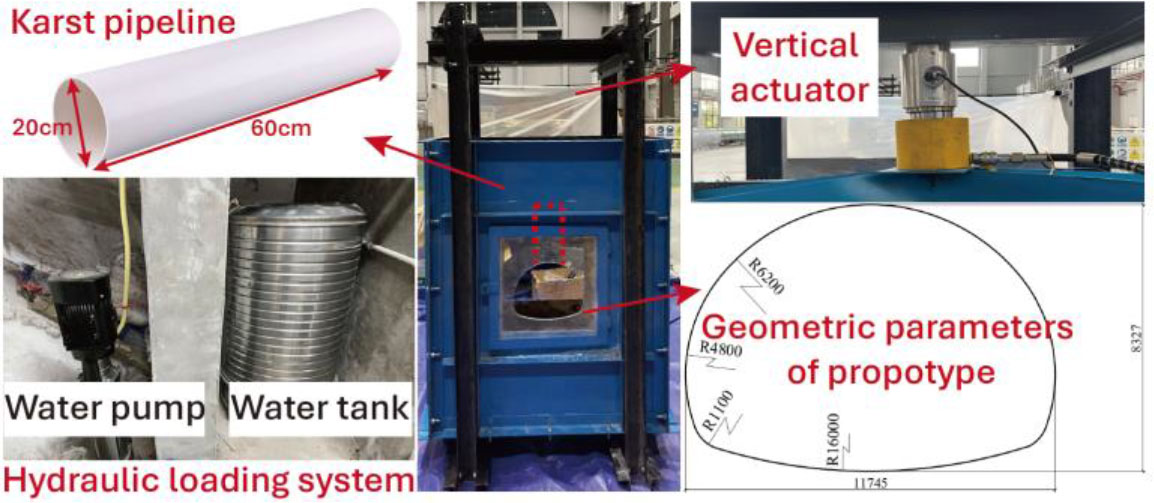
Figure 1:
Loading system of pipe-type karst water inrush disasters
Table 1:
Ratio of similar materials of surrounding rock
| Sand–binder ratio | Sand–soil ratio | CaCO3–iron powder ratio | Vaseline–silicone oil ratio | Sand–cement ratio | |
|---|---|---|---|---|---|
| Ratio | 6:1 | 2:1 | 1:6 | 1:1 | 6:1 |
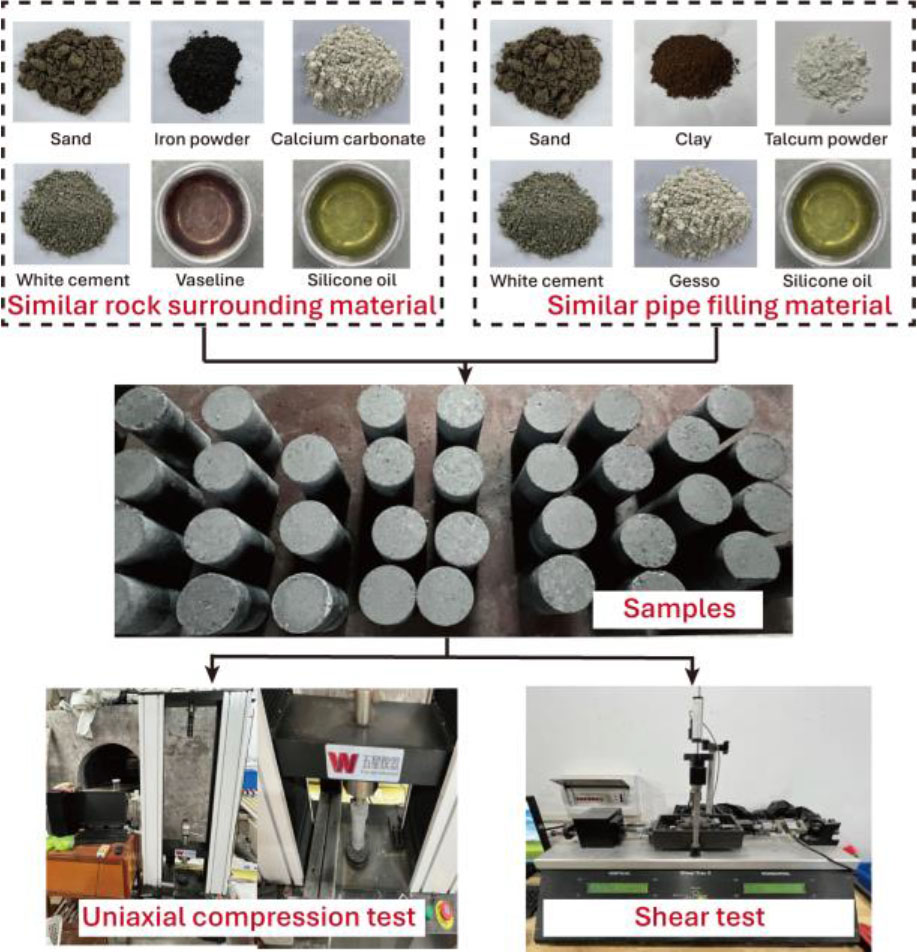
Figure 2:
Experimental procedure for determining the optimal mix proportions of the analogous materials
Table 2:
Pipe filling material ratio
| Sand–binder ratio | Sand–soil ratio | Talc–clay ratio | Gesso–silicone oil ratio | Sand–cement ratio | |
|---|---|---|---|---|---|
| Ratio | 3:1 | 5:3 | 1:2 | 1:2 | 12:1 |
Table 3:
Mechanical parameters of similar materials of surrounding rock
| Group | Specimen | Density γ [kN·m3] | Tensile strength σc [MPa] | Elastic modulus E [MPa] | Osmotic coefficient k [m/s] | Poisson's ratio μ |
|---|---|---|---|---|---|---|
| A | A1 | 19.08 | 0.56 | 182.03 | 2.35×10⁻⁷ | 0.20 |
| A2 | 19.12 | 0.61 | 188.45 | 2.40×10⁻⁷ | 0.19 | |
| A3 | 19.11 | 0.56 | 176.50 | 2.38×10⁻⁷ | 0.20 | |
| B | B1 | 19.10 | 0.54 | 180.12 | 2.45×10⁻⁷ | 0.20 |
| B2 | 19.16 | 0.57 | 181.20 | 2.42×10⁻⁷ | 0.21 | |
| B3 | 19.15 | 0.58 | 184.35 | 2.39×10⁻⁷ | 0.21 | |
| C | C1 | 19.06 | 0.59 | 187.60 | 2.32×10⁻⁷ | 0.19 |
| C2 | 19.10 | 0.56 | 179.80 | 2.48×10⁻⁷ | 0.20 | |
| C3 | 19.09 | 0.53 | 175.48 | 2.41×10⁻⁷ | 0.20 | |
| Average | 19.108 | 0.567 | 181.726 | 2.40×10⁻⁷ | 0.20 | |
| Standard deviation | 0.029 | 0.024 | 4.453 | 0.046×10⁻⁷ | 0.007 | |
| Coefficient of Variation | 0.15% | 4.23% | 2.45% | 1.92% | 3.5% | |
Table 4:
Mechanical parameters of similar materials of pipe fillings
| Group | Specimen | Density γ [kN·m3] | Cohesion c [MPa]] | Friction angle ϕ [º] | Osmotic coefficient k[m/s)] | Poisson's ratio μ |
|---|---|---|---|---|---|---|
| a | a1 | 15.97 | 0.32 | 32.09 | 6.0×10⁻⁶ | 0.26 |
| a2 | 15.88 | 0.34 | 32.55 | 5.6×10⁻⁶ | 0.25 | |
| a3 | 16.01 | 0.31 | 31.85 | 6.3×10⁻⁶ | 0.26 | |
| b | b1 | 15.92 | 0.30 | 31.92 | 5.1×10⁻⁶ | 0.27 |
| b2 | 16.12 | 0.35 | 33.01 | 6.2×10⁻⁶ | 0.26 | |
| b3 | 16.01 | 0.33 | 32.40 | 6.3×10⁻⁶ | 0.26 | |
| c | c1 | 16.18 | 0.36 | 31.50 | 6.5×10⁻⁶ | 0.25 |
| c2 | 15.75 | 0.29 | 32.15 | 5.2×10⁻⁶ | 0.27 | |
| c3 | 15.94 | 0.32 | 32.16 | 6.8×10⁻⁶ | 0.26 | |
| Average | 15.976 | 0.324 | 32.181 | 6.0×10⁻⁶ | 0.26 | |
| Standard deviation | 0.127 | 0.023 | 0.436 | 0.583×10⁻⁶ | 0.26 | |
| Coefficient of Variation | 0.80% | 7.08% | 1.36% | 9.72% | 2.72% | |
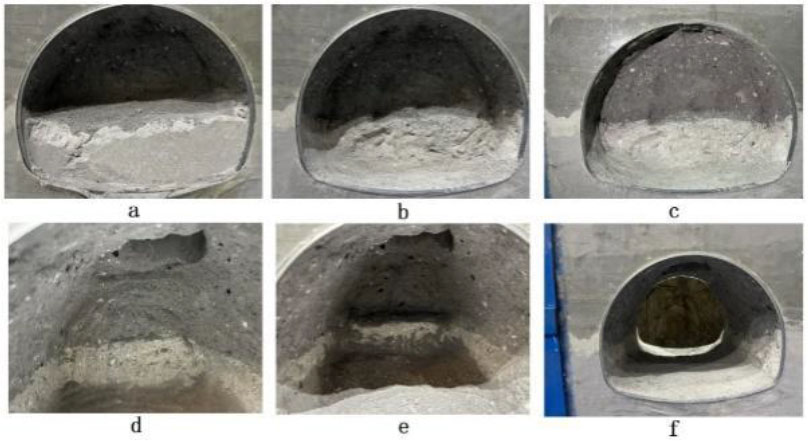
Figure 3:
Tunnel excavation process diagram
Table 5:
Water pressure loading steps and holding time conditions
| Water pressure loading step | Time [s] | Applied water pressure |
|---|---|---|
| 0 | 900 | 20kPa |
| 1 | 900 | 30 kPa |
| 2 | 900 | 40kPa |
| 3 | 1200 | 50kPa |
| 4 | 1200 | 60kPa |
| 5 | 360 | 65kPa |
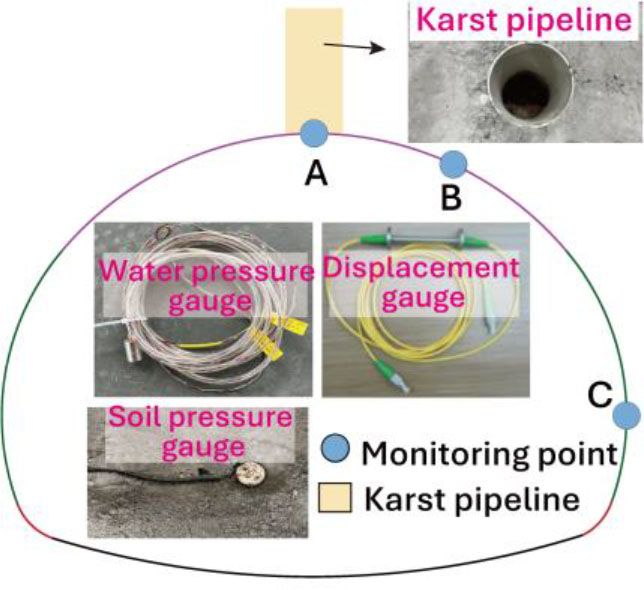
Figure 4:
Monitoring scheme of the physical model test
Table 6:
Water pressure loading and experimental phenomena record
| Water pressure loading step | Time [s] | Applied water pressure | Phenomena |
|---|---|---|---|
| 0 | 900 | 20kPa | Slight seepage was observed at the tunnel crown where it intersects the karst pipe. |
| 1 | 900 | 30 kPa | Local dripping occurred at the tunnel crown |
| 2 | 900 | 40kPa | The dripping rate at the tunnel crown increased, developing into continuous linear dripping |
| 3 | 1200 | 50kPa | The linear dripping at the tunnel crown remained stable, and the seepage water became turbid |
| 4 | 1200 | 60kPa | The seepage discharge at the tunnel crown increased significantly, accompanied by a large amount of mud and sand |
| 5 | 360 | 65kPa | Instability of the infilling material occurred, resulting in a sudden inrush of large volumes of water and infill material |
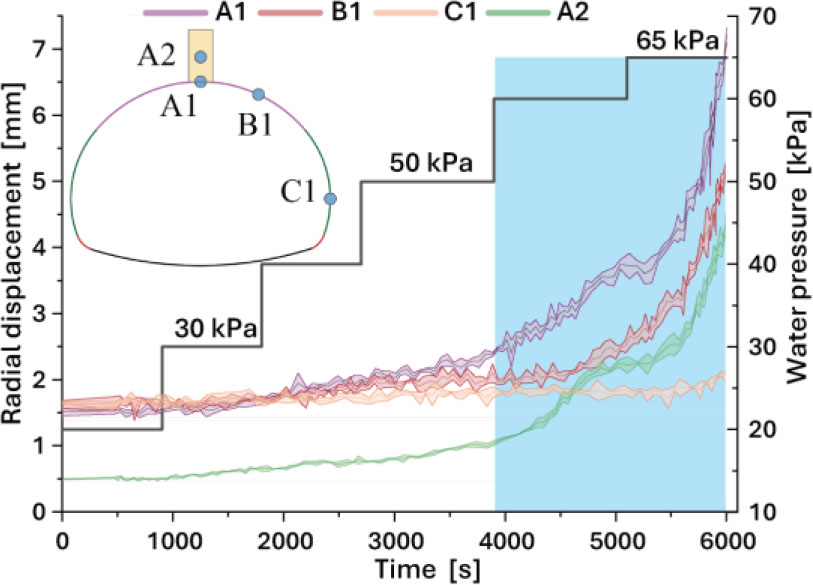
Figure 5:
Displacements evolution during the water pressure loading process
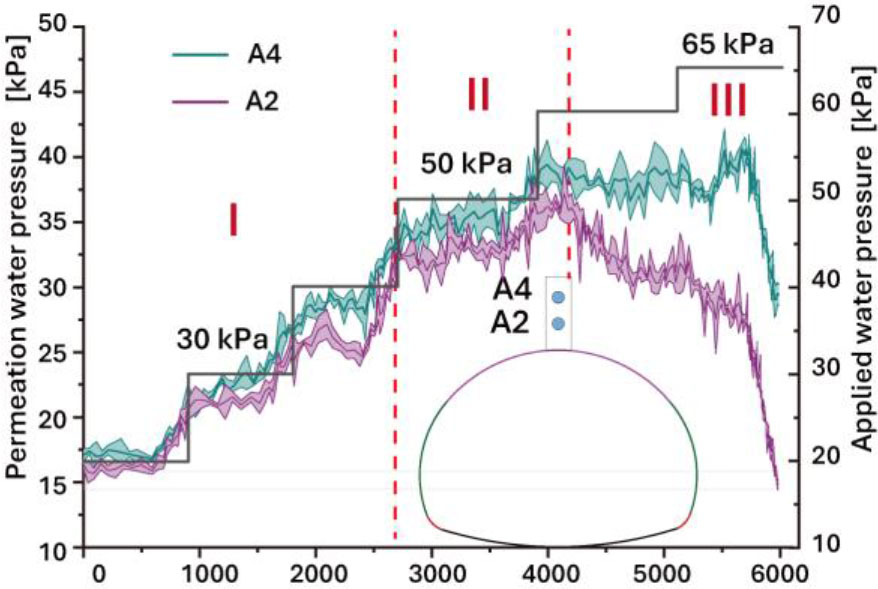
Figure 6:
Variations of permeation water pressure during the water pressure loading process
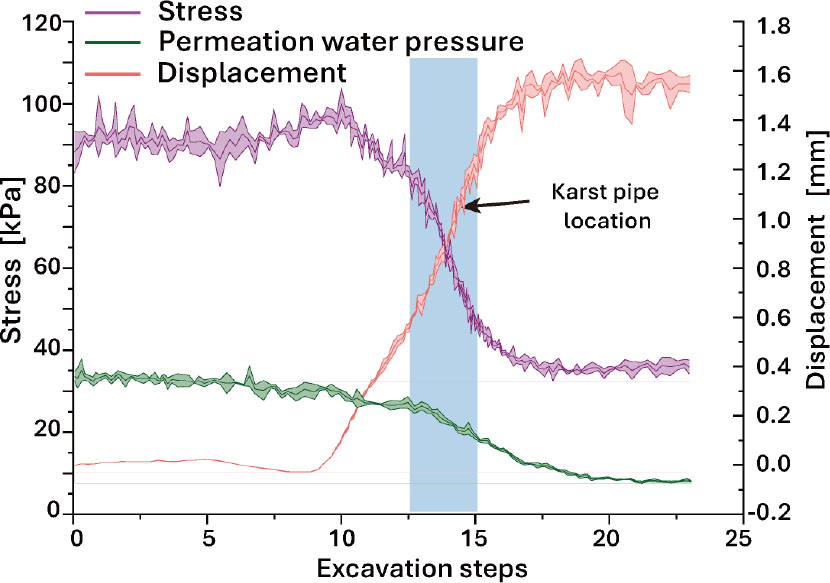
Figure 7:
Evolution of monitoring data for the infilling material during the excavation process
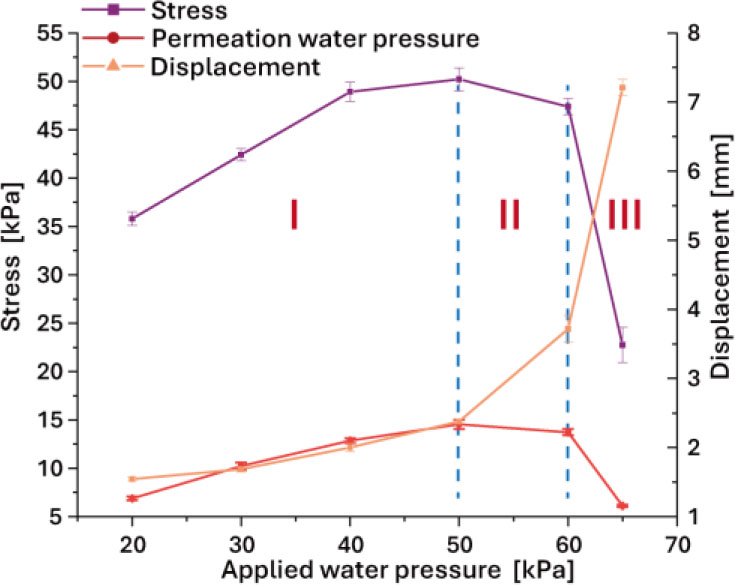
Figure 8:
Evolution curves of monitoring data for the infilling material during the water pressure loading process
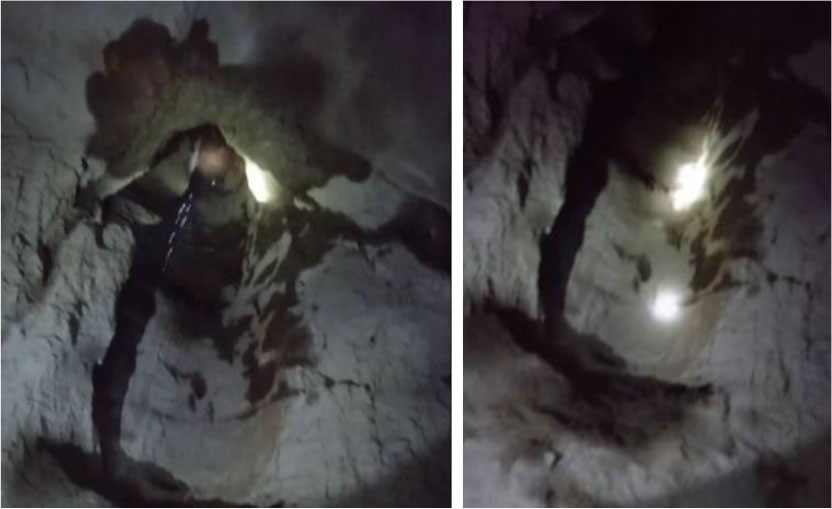
Figure 9:
Karst pipe exposed by excavation at chainage YK38+836
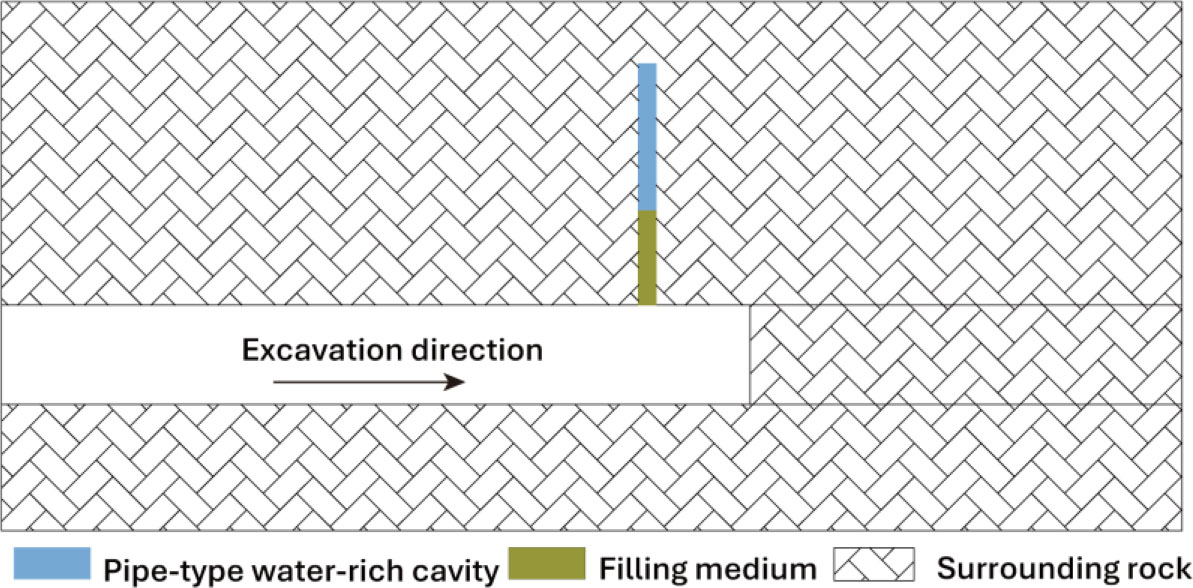
Figure 10:
Spatial distribution characteristics of the water-rich karst cavities and the tunnel as revealed on site
Table 7:
Physical and mechanical parameters of the surrounding rock and infilling material used in the model
| Elastic modulus [MPa] | Poisson’s ratio | Cohesion [MPa] | Friction angle [°] | Tensile strength [MPa] | Porosity | Permeability coefficient [m/s] | |
|---|---|---|---|---|---|---|---|
| Surrounding rock | 3000 | 0.28 | 1 | 40 | 3 | 0.18 | 1.25×10⁻⁸ |
| Infilling material | 400 | 0.35 | 0.2 | 22 | 0.05 | 0.36 | 1.85×10⁻⁸ |
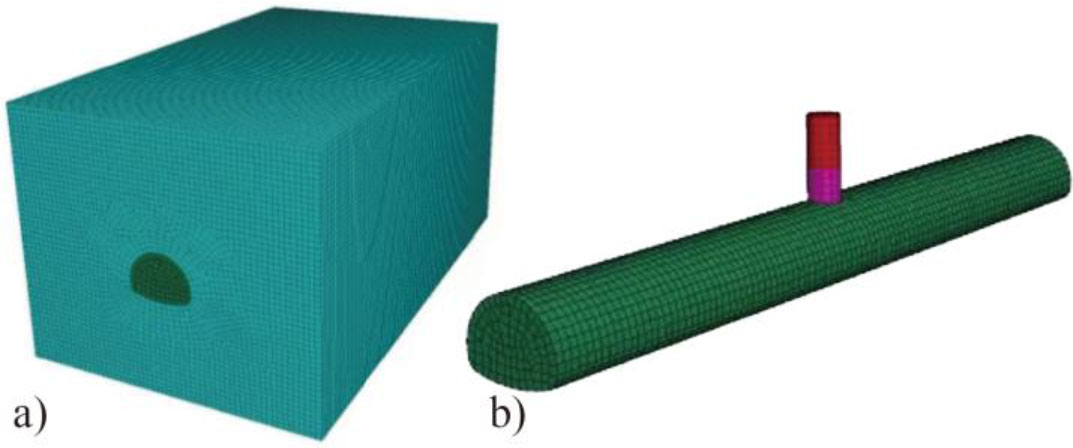
Figure 11:
a) Tunnel strata model with pipe-type water-rich structure; b) Relative position of the tunnel and karst pipe
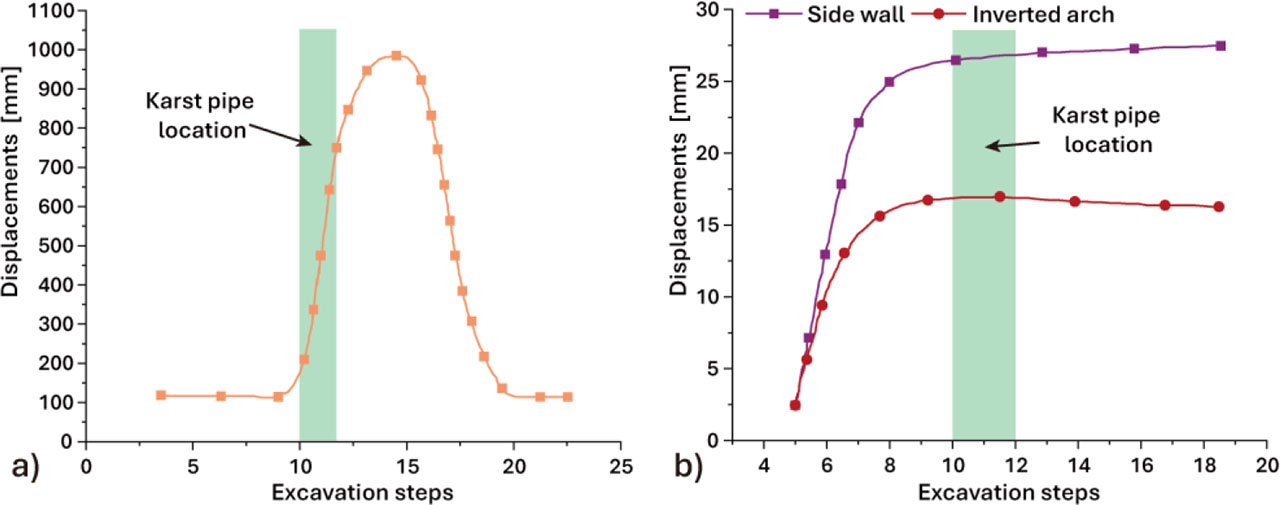
Figure 12:
Displacement variation of the surrounding rock during tunnel face excavation: a) Crown; b) Arch waist and invert arch
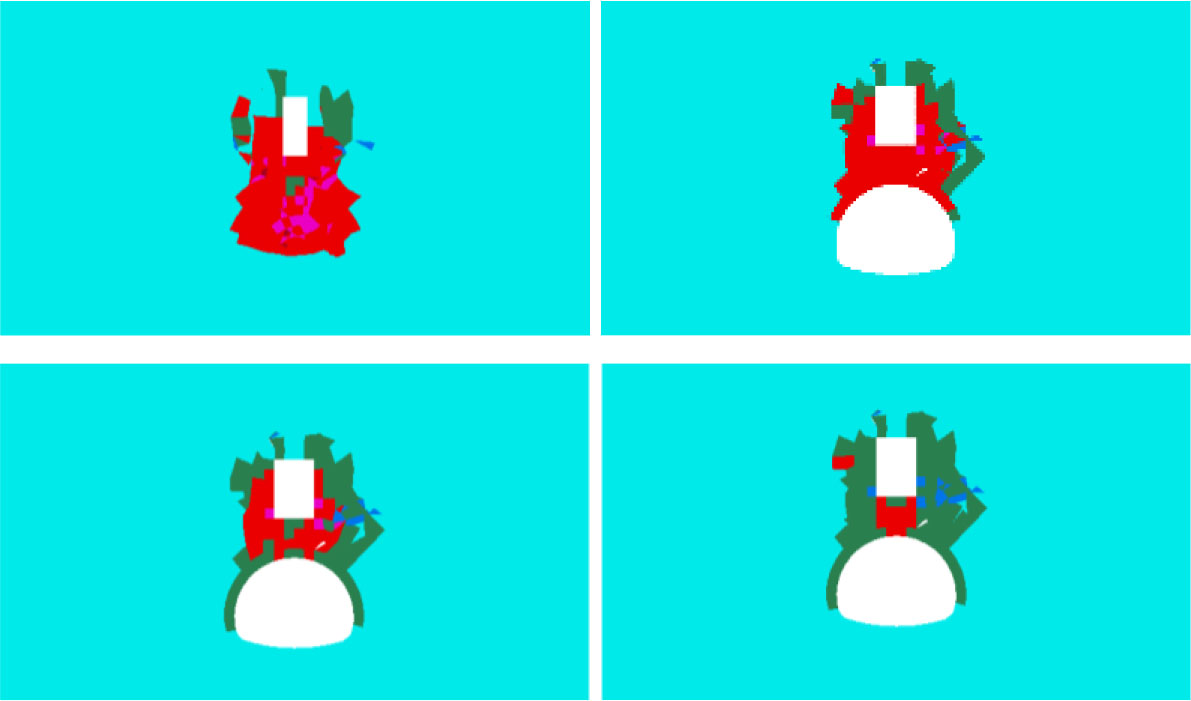
Figure 13:
Evolution of the plastic zone changes in the surrounding rock: a) Step 9; b) Step 10; c) Step 11; d) Step 12
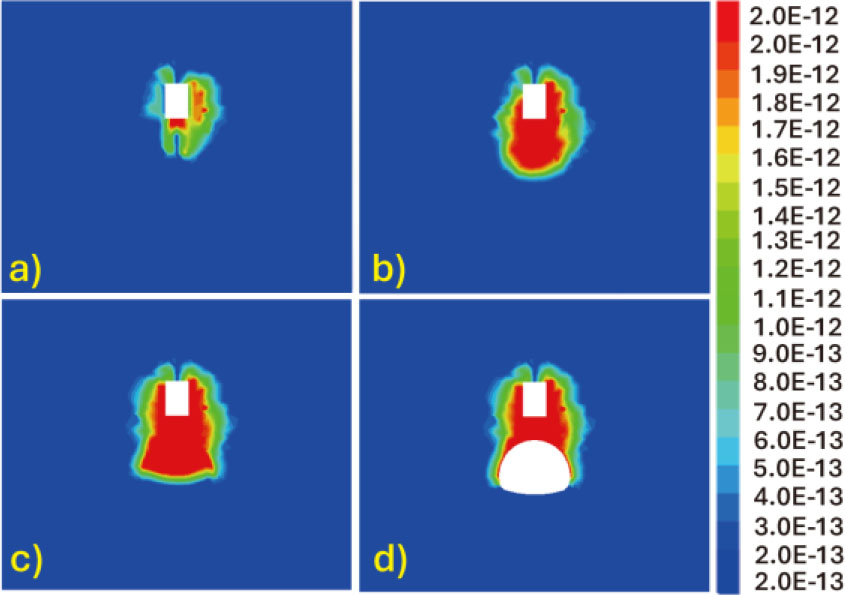
Figure 14:
Variation of permeability coefficient of surrounding rock during excavation (unit: m/s): a) Step 8; b) Step9; c) Step10; d) Step11
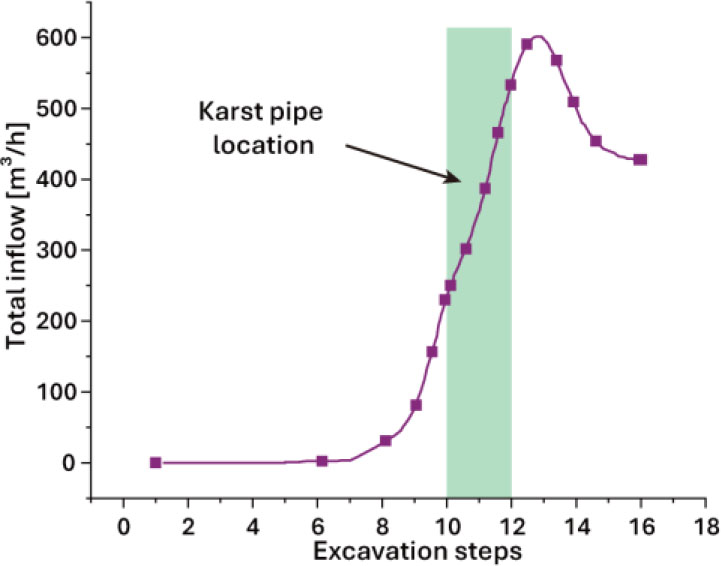
Figure 15:
Variation of water inflow into the tunnel during excavation
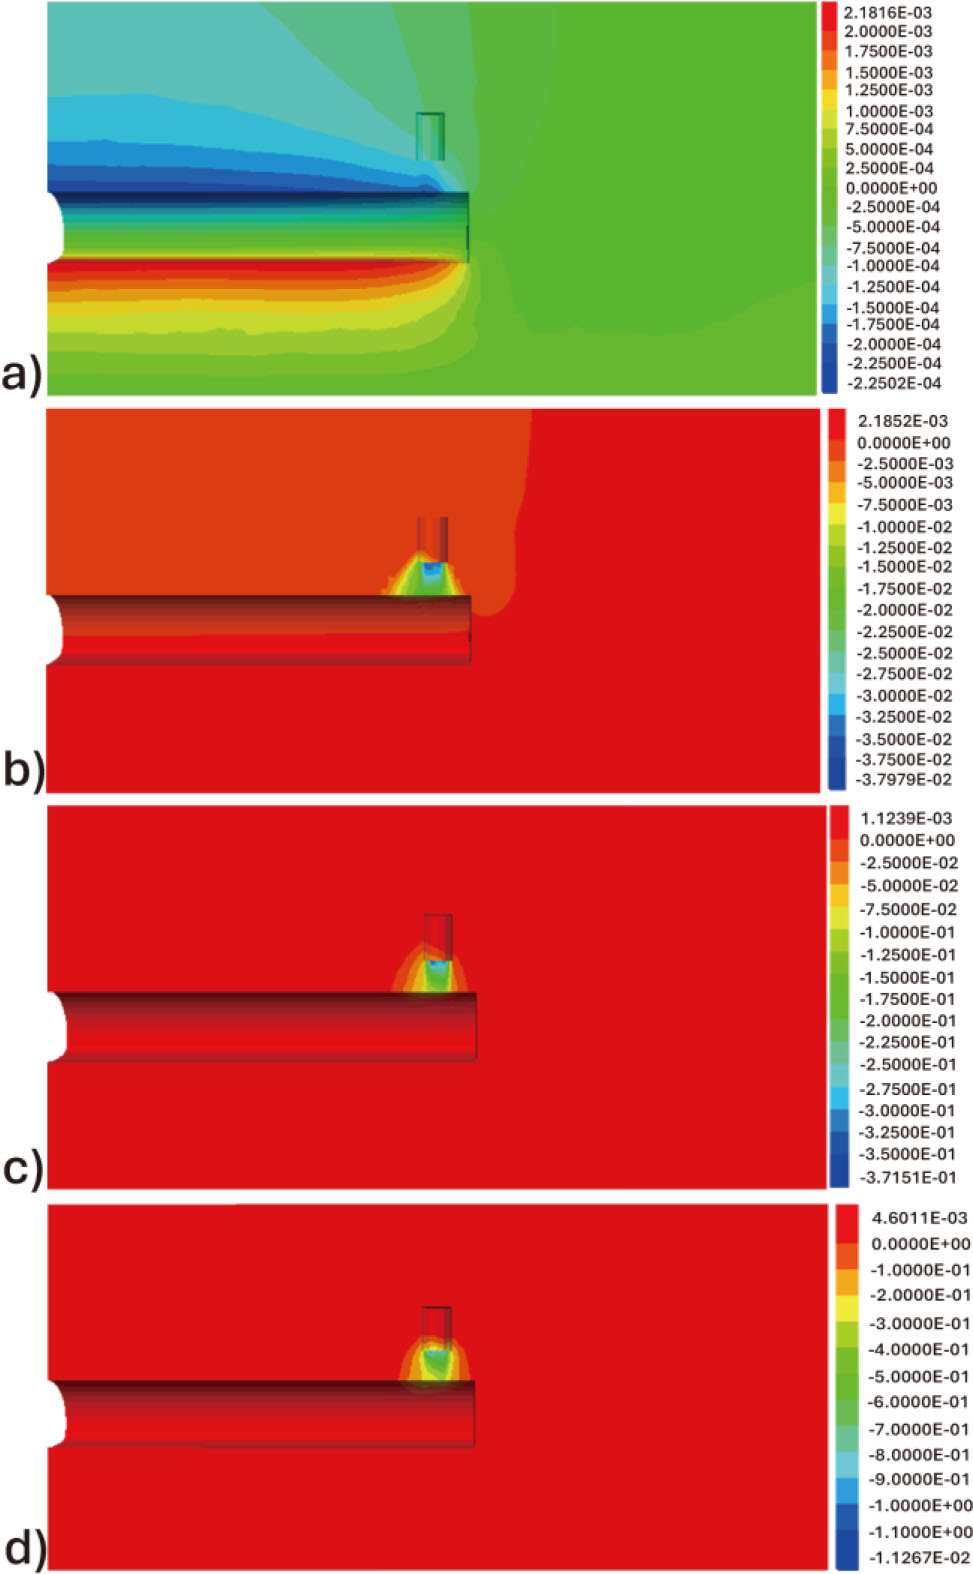
Figure 16:
Displacement variation of the tunnel surrounding rock under different water pressures (unit: m): a)0MPa; b)0.5MPa; c)1.5MPa; d) 2MPa
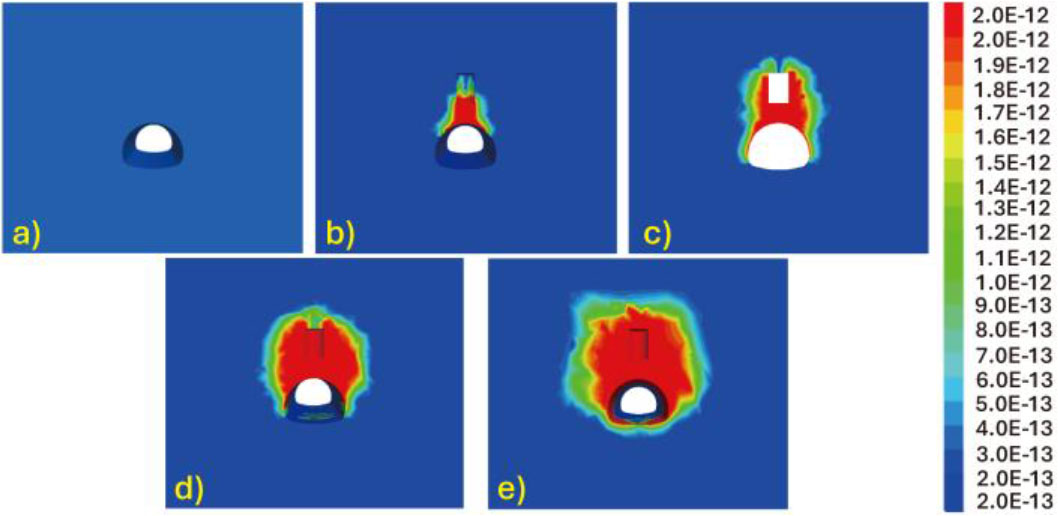
Figure 17:
Variation of the permeability coefficient under different applied water pressures (unit: m/s): a)0MPa; b) 0.5MPa; c) 1MPa; d) 1.5MPa; e)2.0MPa
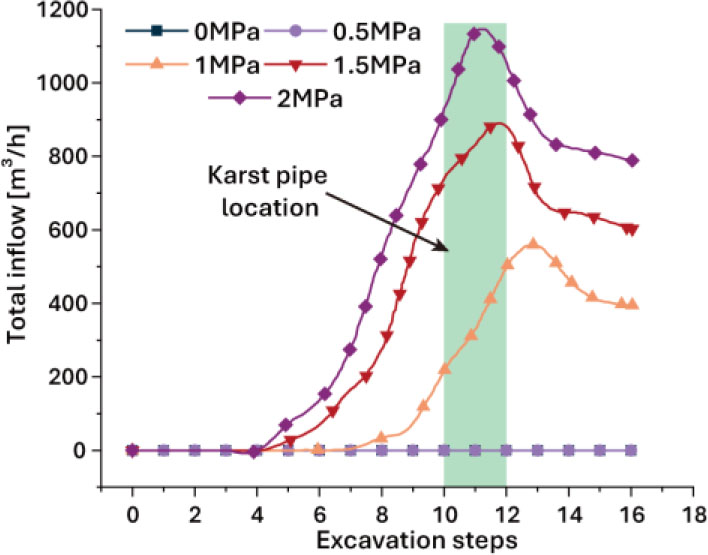
Figure 18:
Variation trend of tunnel water inflow under different water pressures
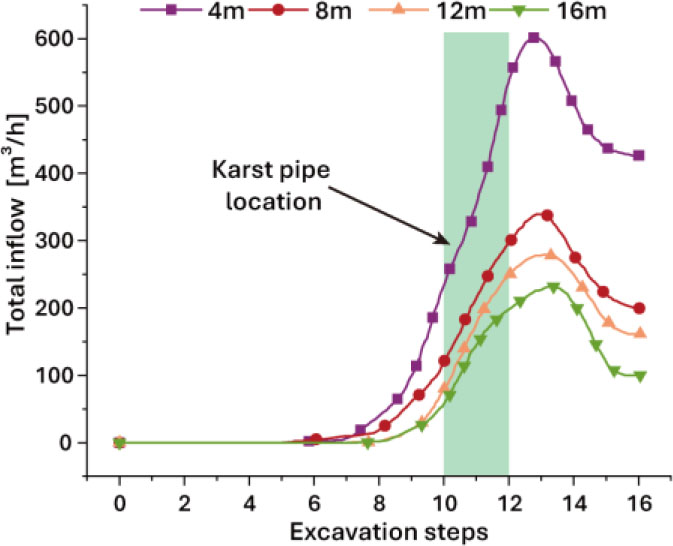
Figure 19:
Variation of water inflow during excavation under different infilling lengths of the karst pipe