

1. Introduction
In recent years, the number of highway and railway tunnels constructed in mountainous regions of central and western China has increased continuously. Correspondingly, the frequency of encountering unfavorable geological bodies such as karst during tunnel excavation has risen markedly, a phenomenon that is particularly prominent in the Yunnan–Guizhou–Sichuan region where karst geology is widely developed. During the construction of karst tunnels, various types of sudden water inrush disasters are frequently encountered, posing severe threats to construction safety and resulting in substantial economic losses (Ou X. et al., 2024; Liu N. et al., 2022).
Among all types of unfavorable karst geological bodies capable of inducing water and mud inrush disasters, pipe-type karst structures are considered the most hazardous (Li L. et al., 2016). Owing to their large water inflow capacity and the entrainment of massive quantities of mud during failure, such structures can severely deteriorate the geological conditions around the tunnel site and pose extreme risks to construction safety. Statistical analyses indicate that, among major tunnel disasters worldwide, casualties and economic losses caused by large-scale water inrush events rank among the top three (Li-ping Li. et al., 2009; Zhang Q. et al., 2011; Assi, M.H. et. al., 2025). Consequently, extensive research efforts have been devoted to investigating the failure mechanisms of water inrush disasters.
Li L. P. et al. (2010) and Vietthuc C. et al. (2016) conducted three-dimensional multi-field coupled studies on the mechanisms of water and mud inrush using physical modeling and numerical simulation techniques. Their results demonstrated that the seepage instability of karst groundwater induced by the intrusion of water and slurry is a key factor governing the occurrence of such disasters. Li Shucai et al. (2015) introduced the slice method to investigate the tunnel–karst infill–karst pipe system and established an analytical slice-based model for water-bearing infilled karst structures. However, this method relies on multiple simplifying assumptions, and its overly simplified formulation limits its applicability, making it difficult to provide effective guidance for other engineering projects. Ma Shiwei (2009), through systematic investigations of tunnel water inrush geology, proposed a comprehensive evaluation index system for unfavorable tunnel geological structures. By applying shear failure theory and thin-wall theory, the mechanisms and behavioral characteristics of water and mud inrush induced by tunnel excavation in karst strata were analyzed, and an early-warning system for tunnel water inrush geological disasters was developed. Nevertheless, such theoretical achievements are difficult to directly apply in engineering practice due to their limited practicality and applicability.
Other researchers have also conducted studies using field investigations and physical model tests. Zhenjun W. et al. (2024) developed a novel grouting material targeting the disaster characteristics of pipe-type karst water inrush. However, the lack of validation under realistic engineering conditions and insufficient understanding of the disaster evolution process have limited its practical applicability. Li Z. et al. (2025), based on a self-developed three-dimensional fluid–solid coupling experimental system, revealed that variations in the surrounding rock stress field and permeation water pressure within fractures induced by tunnel excavation are the primary causes of surrounding rock fragmentation and failure. They further proposed a water inrush early-warning method based on the coupled characteristics of seepage pressure and stress evolution. Pan D. et al. (2019), through physical model tests, proposed that the evolution of tunnel water inrush disasters induced by excavation can be divided into three stages: the initiation of group cracks, the formation of a water inrush channel, and the complete collapse of the water-resisting slab. Yang W. et al. (2019), Gao C. et al. (2021), and Li L. et al. (2024), using field monitoring, physical modeling, and numerical simulation methods, elucidated the failure mechanisms and occurrence criteria of splitting-type and exposure-type water and mud inrush disasters. Their studies indicated that water and mud inrush disasters occurring in infilled karst pipes are governed by multi-physical-field coupling mechanisms, and they conducted theoretical analyses on seepage instability failure of karst infill materials under high water pressure conditions. However, existing studies on the evolutionary law of water and mud inrush disasters—particularly those involving pipe-type karst—are still constrained by excessive model assumptions and simplified boundary conditions, resulting in significant discrepancies from real engineering scenarios.
In view of the limitations of existing studies, this paper systematically investigates the evolution process of water and mud inrush disasters in pipe-type water-rich karst structures through physical model testing and numerical simulation. Under combined excavation disturbance and varying water pressure conditions in water-rich karst cavities, precursor indicators of water and mud inrush disasters in karst tunnels—namely displacement, stress–strain response, and seepage field evolution—are established. The instability characteristics of infilled materials within karst pipes are further revealed.
2. Model design
2.1. Loading system
The model was ultimately conducted using a two-lane mountain tunnel in southwestern China as the prototype, with a geometric similarity ratio of 1:30, accounting for the experimental conditions and other factors. The cross-sectional dimensions of the tunnel prototype are shown in Figure 1. To further clarify the evolutionary characteristics of precursor information associated with pipe-type water inrush and mud outburst disasters triggered by tunnel excavation disturbance in mountain areas, a disaster early warning monitoring system was established from the perspectives of surrounding rock deformation, mechanical properties, and the variation patterns of stress and strain in the surrounding rock. Based on similarity theory (Li et al., 2025; Liang et al., 2016), the similarity ratios for Poisson's ratio, strain, and internal friction angle were set to 1:1, while the similarity ratios for cohesion, stress, elastic modulus, strength, and load were set to 1:30.
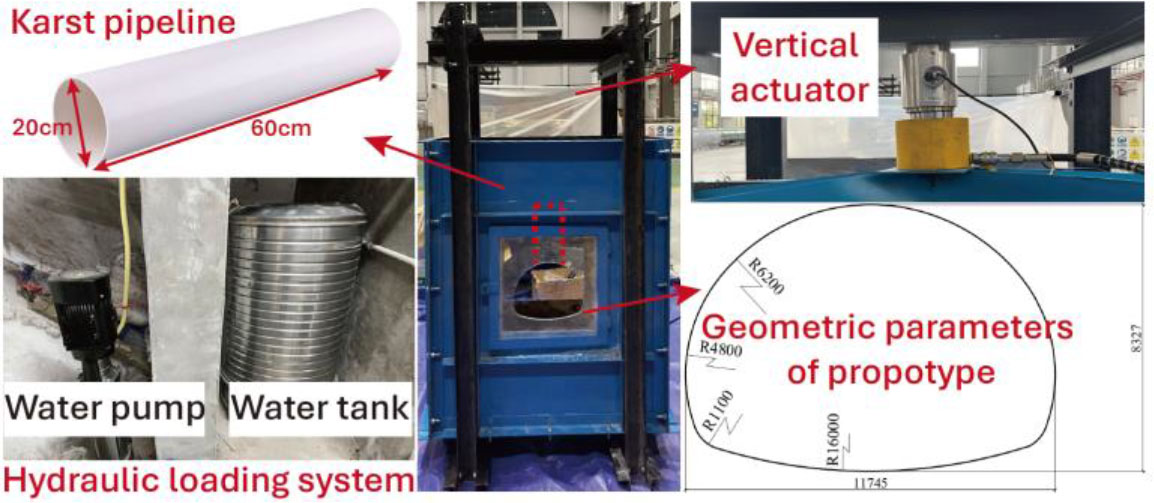
Figure 1:
Loading system of pipe-type karst water inrush disasters
The geometric parameters of the loading system for simulating pipe-type karst water inrush disasters in tunnels and the prototype structure are shown in Figure 1. The overall geometric outline of the apparatus measures 2000mm × 2600mm × 1300mm. It is constructed with 6 mm thick steel plates, resulting in a structural system with relatively high stiffness and a pressure-bearing capacity exceeding 0.3 MPa. At the central position of the tunnel arch, a PVC pipe with a diameter of 20 cm and a length of 60 cm is installed, which is filled with similar materials. Using the same mix ratio, three parallel tests were designed and carried out.
2.2. Similar materials
The model test materials consisted of aggregates and cementing agents, in which the aggregates served as the core constituent and played a primary supporting role for both the surrounding rock mass and the infilling medium. To ensure that the mechanical and hydraulic properties of the model materials satisfied the similarity requirements, plasticity modifiers, permeability regulators, and unit-weight adjusters were incorporated into the aggregate mixture according to the target material parameters. Consequently, different proportions of sand, calcium carbonate, iron powder, white cement, vaseline, and silicone oil were selected to fabricate analogous materials for the tunnel surrounding rock strata (Li S. et al., 2019,a; Tian Q. et al., 2018; Jiang N. et al., 2023). Based on the geometric similarity ratio of 1:30, nine orthogonal test conditions were designed. Through a series of uniaxial compression tests, permeability tests, and direct shear tests, the optimal mixture proportions of the surrounding rock analog materials were finally determined, as summarized in Table 1.
Table 1:
Ratio of similar materials of surrounding rock
| Sand–binder ratio | Sand–soil ratio | CaCO3–iron powder ratio | Vaseline–silicone oil ratio | Sand–cement ratio | |
|---|---|---|---|---|---|
| Ratio | 6:1 | 2:1 | 1:6 | 1:1 | 6:1 |
In addition, the infilling materials within pipe-type karst pipes exhibit pronounced seepage-induced failure characteristics under the action of water pressure in karst cavities, including material softening, particle detachment, and a reduction in overall stability. Accordingly, sand, clay, talcum powder, white cement, gesso, and silicone oil were selected to prepare analogous materials for the karst pipe infill medium (Fan H. et al., 2022; Ma C. et al., 2022; Mohammadi Z. et al., 2021). Orthogonal test conditions were designed, and uniaxial compression tests, permeability tests, and direct shear tests were conducted to determine the optimal mixture proportions of the karst pipe infill analog materials, as presented in Table 2. The experimental procedure for determining the optimal mix ratios of the two types of analogous materials is illustrated in Figure 2. The mechanical property parameters of the similar materials for the surrounding rock and the pipe-filling medium are presented in Table 3 and Table 4, respectively.
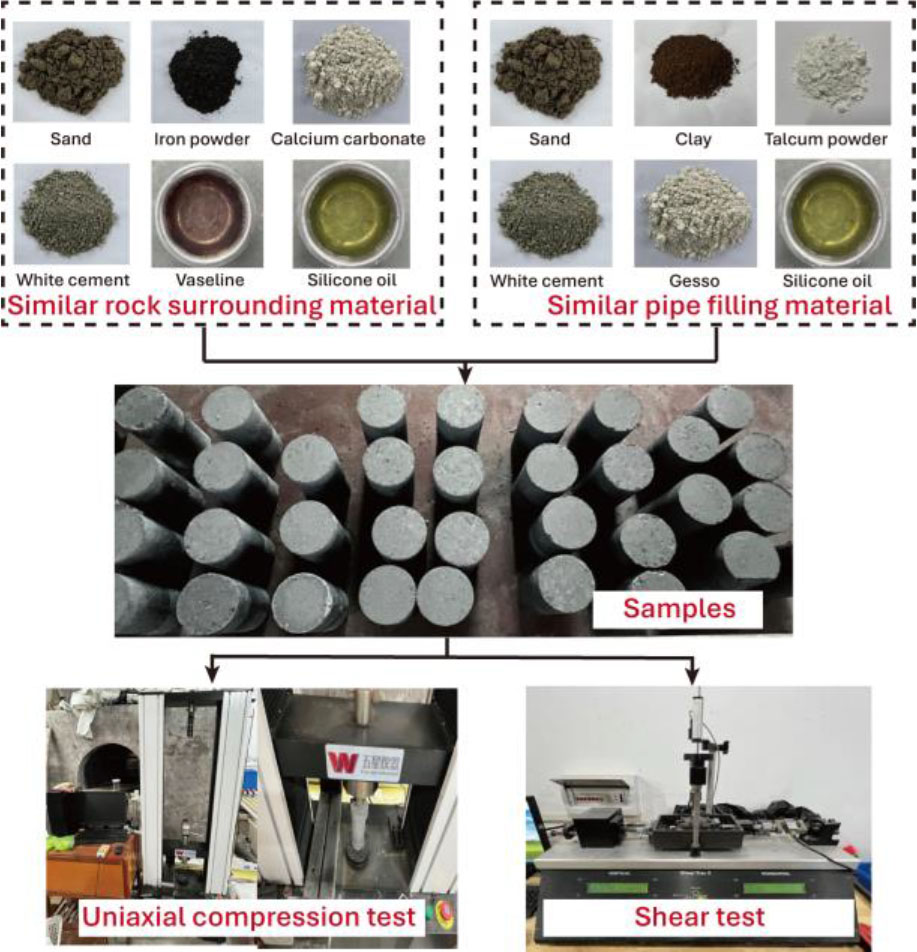
Figure 2:
Experimental procedure for determining the optimal mix proportions of the analogous materials
Table 2:
Pipe filling material ratio
| Sand–binder ratio | Sand–soil ratio | Talc–clay ratio | Gesso–silicone oil ratio | Sand–cement ratio | |
|---|---|---|---|---|---|
| Ratio | 3:1 | 5:3 | 1:2 | 1:2 | 12:1 |
Table 3:
Mechanical parameters of similar materials of surrounding rock
| Group | Specimen | Density γ [kN·m3] | Tensile strength σc [MPa] | Elastic modulus E [MPa] | Osmotic coefficient k [m/s] | Poisson's ratio μ |
|---|---|---|---|---|---|---|
| A | A1 | 19.08 | 0.56 | 182.03 | 2.35×10⁻⁷ | 0.20 |
| A2 | 19.12 | 0.61 | 188.45 | 2.40×10⁻⁷ | 0.19 | |
| A3 | 19.11 | 0.56 | 176.50 | 2.38×10⁻⁷ | 0.20 | |
| B | B1 | 19.10 | 0.54 | 180.12 | 2.45×10⁻⁷ | 0.20 |
| B2 | 19.16 | 0.57 | 181.20 | 2.42×10⁻⁷ | 0.21 | |
| B3 | 19.15 | 0.58 | 184.35 | 2.39×10⁻⁷ | 0.21 | |
| C | C1 | 19.06 | 0.59 | 187.60 | 2.32×10⁻⁷ | 0.19 |
| C2 | 19.10 | 0.56 | 179.80 | 2.48×10⁻⁷ | 0.20 | |
| C3 | 19.09 | 0.53 | 175.48 | 2.41×10⁻⁷ | 0.20 | |
| Average | 19.108 | 0.567 | 181.726 | 2.40×10⁻⁷ | 0.20 | |
| Standard deviation | 0.029 | 0.024 | 4.453 | 0.046×10⁻⁷ | 0.007 | |
| Coefficient of Variation | 0.15% | 4.23% | 2.45% | 1.92% | 3.5% | |
Table 4:
Mechanical parameters of similar materials of pipe fillings
| Group | Specimen | Density γ [kN·m3] | Cohesion c [MPa]] | Friction angle ϕ [º] | Osmotic coefficient k[m/s)] | Poisson's ratio μ |
|---|---|---|---|---|---|---|
| a | a1 | 15.97 | 0.32 | 32.09 | 6.0×10⁻⁶ | 0.26 |
| a2 | 15.88 | 0.34 | 32.55 | 5.6×10⁻⁶ | 0.25 | |
| a3 | 16.01 | 0.31 | 31.85 | 6.3×10⁻⁶ | 0.26 | |
| b | b1 | 15.92 | 0.30 | 31.92 | 5.1×10⁻⁶ | 0.27 |
| b2 | 16.12 | 0.35 | 33.01 | 6.2×10⁻⁶ | 0.26 | |
| b3 | 16.01 | 0.33 | 32.40 | 6.3×10⁻⁶ | 0.26 | |
| c | c1 | 16.18 | 0.36 | 31.50 | 6.5×10⁻⁶ | 0.25 |
| c2 | 15.75 | 0.29 | 32.15 | 5.2×10⁻⁶ | 0.27 | |
| c3 | 15.94 | 0.32 | 32.16 | 6.8×10⁻⁶ | 0.26 | |
| Average | 15.976 | 0.324 | 32.181 | 6.0×10⁻⁶ | 0.26 | |
| Standard deviation | 0.127 | 0.023 | 0.436 | 0.583×10⁻⁶ | 0.26 | |
| Coefficient of Variation | 0.80% | 7.08% | 1.36% | 9.72% | 2.72% | |
Upon determining the final mix proportions for the similar materials representing the surrounding rock and the karst pipe fillings, three additional groups of specimens (three specimens per group) were cast using this specific mix. The primary physical and mechanical properties of these specimens were subsequently tested to evaluate the stability of the casting scheme.
Table 3 presents the physical and mechanical properties of the different groups of similar surrounding rock materials prepared with the identical mix proportion. The results indicate that, for this mix proportion, the similar surrounding rock material exhibits a mean unit weight of 19.108 kN/m3, a mean tensile strength of 0.567 MPa, a mean elastic modulus of 181.726 MPa, a mean permeability coefficient of 2.4 × 10⁻⁵ cm/s, and a mean Poisson's ratio of 0.20. When utilizing this mix proportion for casting the similar surrounding rock material, the coefficients of variation (CV) for all critical mechanical parameters remain below 5%. Notably, the CV for unit weight is the lowest at a mere 0.15%, whereas the CV for the material's tensile strength is the highest, reaching 4.23%. This demonstrates that the surrounding rock material produced using this mix proportion and casting scheme possesses stable mechanical properties, thereby better ensuring that experimental results will not be subject to significant fluctuations caused by material variability.
Table 4 illustrates the physical and mechanical properties of the different groups of similar karst pipe filling materials prepared with the same mix proportion. The results reveal that, for this mix proportion, the similar karst pipe filling material has a mean unit weight of 15.976 kN/m3, a mean cohesion of 0.324 MPa, a mean internal friction angle of 32.181°, a mean permeability coefficient of 6.0 × 10⁻⁴ cm/s, and a mean Poisson's ratio of 0.26. When this mix proportion is applied for casting the similar karst conduit filling material, the coefficients of variation for all key mechanical parameters are below 10%. Specifically, the CV for unit weight is the lowest at only 0.80%. The CVs for cohesion and the permeability coefficient both exceed 5%, reaching 7.08% and 9.72%, respectively. The test results confirm that the karst conduit filling material prepared via this mix proportion and casting scheme exhibits good stability, effectively satisfying the requirements for ensuring reliable and consistent experimental outcomes.
2.3. Working conditions
In accordance with the experimental program, tunnel excavation was carried out first. The tunnel was excavated using the ultra-short bench method. The height of the upper bench was 15 cm, and the height of the lower bench was also 15 cm, with a bench length of 5.2 cm. Excavation proceeded step by step until full tunnel breakthrough was achieved. The tunnel excavation process is shown in Figure 3.
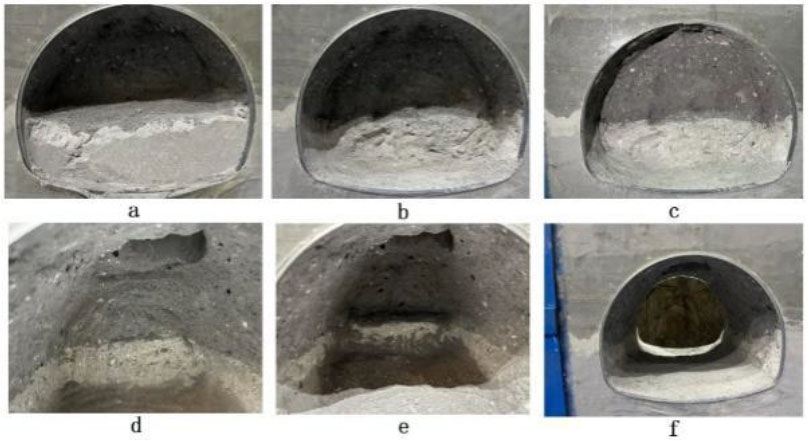
Figure 3:
Tunnel excavation process diagram
Based on the existing semi-empirical calculation formula for the critical conditions of pipe-type karst water inrush, which is derived from fracture mechanics and hydraulic theory (Li S., et al., 2019,b; Guo J. Q. et al., 2012), the critical condition for water and mud inrush under the properties of the filling medium and the geometric parameters of the water inrush pipeline in the model test was determined to be 67 kPa. Considering certain discrepancies between the model test and theoretical derivations, it was ultimately decided to first set 65 kPa as the limit water pressure. During the experimental process, the water pressure was applied incrementally in five steps to ensure adequate water infiltration. If water inrush did not occur after reaching 65 kPa, the water pressure continued to be increased until water inrush was observed. The water pressure loading steps and holding times are shown in Table 5.
2.4. Monitoring scheme
To effectively capture the evolution characteristics of the seepage pressure field and surrounding rock displacement in the tunnel site area under different water pressure conditions, three monitoring lines were arranged at the tunnel crown, shoulder, and arch waist. The monitoring line at the tunnel crown primarily focused on the seepage-induced hydraulic pressure within the karst pipe and was arranged along the vertical height of the pipe. At both the tunnel shoulder and arch waist, a total of four monitoring points were installed in the surrounding rock at radial distances of 0, 0.5, 1.0, and 2.0 times the tunnel diameter from the tunnel perimeter. These points were used to install sensors such as permeation water pressure transducers and earth pressure cells. Displacement gauges were installed at the tunnel crown, shoulder, and arch waist to monitor deformation responses during the test. The layout of the experimental monitoring points is illustrated in Figure 4.
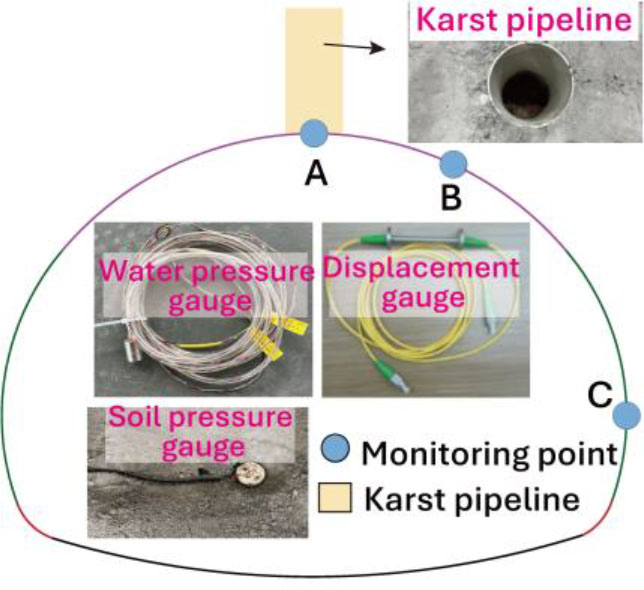
Figure 4:
Monitoring scheme of the physical model test
3. Experiment results
3.1. Experimental phenomena
During the test, the seepage behavior of the surrounding rock and the infilling medium, as well as the characteristics of water flow, were continuously observed and systematically recorded. The observed phenomena are summarized in Table 6.
Table 6:
Water pressure loading and experimental phenomena record
| Water pressure loading step | Time [s] | Applied water pressure | Phenomena |
|---|---|---|---|
| 0 | 900 | 20kPa | Slight seepage was observed at the tunnel crown where it intersects the karst pipe. |
| 1 | 900 | 30 kPa | Local dripping occurred at the tunnel crown |
| 2 | 900 | 40kPa | The dripping rate at the tunnel crown increased, developing into continuous linear dripping |
| 3 | 1200 | 50kPa | The linear dripping at the tunnel crown remained stable, and the seepage water became turbid |
| 4 | 1200 | 60kPa | The seepage discharge at the tunnel crown increased significantly, accompanied by a large amount of mud and sand |
| 5 | 360 | 65kPa | Instability of the infilling material occurred, resulting in a sudden inrush of large volumes of water and infill material |
After excavation, when the applied water pressure was increased to 30 kPa, intermittent dripping was first observed at the tunnel crown. With further increases in water pressure, the dripping rate accelerated markedly, indicating a significant increase in the seepage rate. As both time and water pressure continued to increase, seepage at the tunnel crown evolved into continuous linear dripping, and the water gradually became turbid.
When the water pressure reached 60 kPa, detachment and local collapse of the surrounding rock were observed at the intersection between the karst pipe and the tunnel crown. The water discharge increased substantially and was accompanied by a large amount of sand and gravel, exhibiting a highly turbid flow. With further increases in water pressure, the infilling material within the karst pipe became unstable. High-pressure water rapidly entered the tunnel, triggering a sudden water and mud inrush event. After a period of time, as the infilling material within the pipe was progressively washed out, the water flow gradually transitioned from turbid to clear.
3.2. Displacement
Based on the analysis of data monitored by displacement sensors installed within a range of three times the tunnel diameter, it is observed that the influence of tunnel excavation on the surrounding rock mass is confined within a two-diameter radius. However, the fillings within the karst pipe above the tunnel exhibits a high sensitivity to excavation-induced displacement. Notably, regions near the periphery of the filling medium experience more pronounced displacement fluctuations. Consequently, displacement data from representative monitoring points were extracted to construct error bars illustrating displacement variations under different hydraulic loading processes across three parallel experimental cases, as shown in Figure 5. Therein, monitoring point A1 is situated in the immediate vicinity of the tunnel, while point A2 is located at a distance of 0.5 times the tunnel diameter.
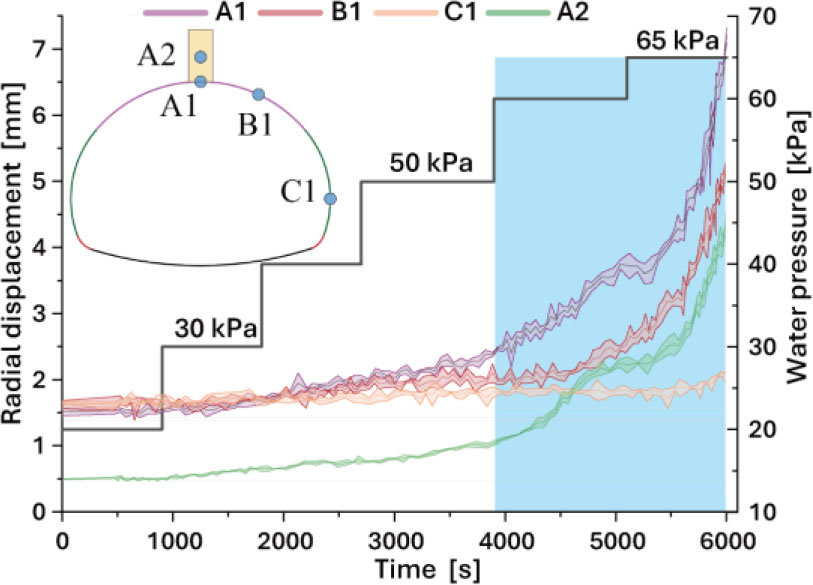
Figure 5:
Displacements evolution during the water pressure loading process
Results indicate that during the sequence of tunnel excavation and subsequent hydraulic loading, the deformation of the surrounding rock remains relatively minor. At an external water pressure of 20 kPa, the maximum radial displacement reaches 1.67 mm, whereas the maximum radial displacement at A2 is merely 0.49 mm. As the applied hydraulic pressure increases incrementally, the displacement at each monitoring point rises accordingly. Nevertheless, compared to the three monitoring points surrounding the tunnel, the data at point A2 within the karst pipe exhibits a narrower error band, suggesting a high degree of consistency in the monitoring data within the pipe across the three parallel cases. Furthermore, the evolution of displacement data across different points reveals that at a hydraulic pressure of 50 kPa, the displacement of the filling medium near the pipe wall increases significantly. The hydraulic pressure induces the migration and loss of fine particles via seepage, although the overall karst filling body maintains stability. Upon increasing the pressure to 60 kPa, the displacement rate at A2 accelerates sharply, accompanied by a significant increase in displacement at the three points surrounding the tunnel. Theoretical analysis suggests that the karst filling medium reaches a state of critical equilibrium at this stage. When the applied water pressure reaches 65 kPa, the deformation near the pipe wall surges abruptly. The fillings subsequently loses stability and enters the tunnel along with the water flow, resulting in a water-inrush and mud-gush event.
The error band width at various monitoring points shows that at low external water pressures, the error bands for the three points around the tunnel exhibit small overlaps and narrow widths, indicating stable structural deformation and high consistency across parallel tests. With further increases in hydraulic pressure, the radial displacement at the three points surrounding the tunnel (A1, B1, C1) undergoes distinct differentiation, and the error band widths expand. This phenomenon is particularly notable at a water pressure of 60 kPa, suggesting that under critical water pressure, the structure experiences non-linear deformation and unstable fluctuations. However, when the pressure reaches 65 kPa, corresponding to filling instability and massive water-mud gushing, the error bands at all monitoring points begin to narrow again. The data from the three parallel tests demonstrate that despite the higher hydraulic pressure and inherent randomness in material damage of the surrounding rock and filling media, the overall displacement trends across the different tests exhibit a high degree of similarity, confirming the reproducibility of the experiments.
3.3. Seepage Field Evolution
Figure 6 illustrates the variations of permeation water pressure at monitoring points A2 (located at 0.5 times the tunnel diameter) and A4 (located at 2.0 times the tunnel diameter) within the karst pipe across three parallel experimental groups as the applied water pressure increases. Analysis reveals that under low initial applied pressure, the evolution of permeation pressure at different monitoring points within the karst pipe remains highly consistent, characterized by narrow error bands and high reproducibility across the parallel tests.
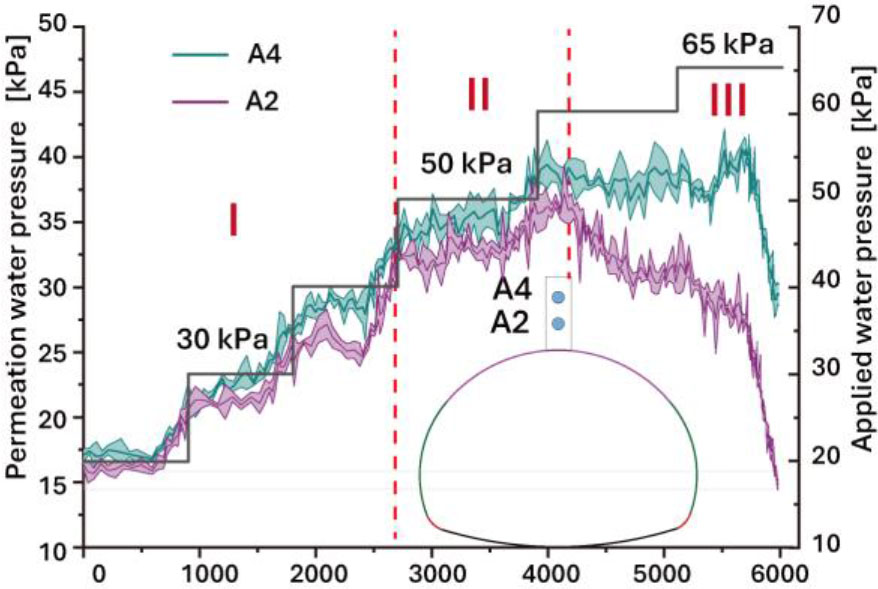
Figure 6:
Variations of permeation water pressure during the water pressure loading process
However, when the applied water pressure reaches 50 kPa, a transient fluctuation in the permeation pressure of the karst pipe fillings is observed. Concurrently, the error band of the permeation pressure at A4 (at 2.0 times the equivalent diameter) widens significantly. This indicates that under high water pressure, the fillings within the karst pipe begins to experience continuous internal erosion and loss of fine particles, which aligns with the experimental phenomena documented in Table 6.
As the pressure escalates to 60 kPa, the permeation pressure in the surrounding rock remains relatively stable, whereas the permeation pressure in the karst filling medium exhibits a downward trend with further broadening of the error bands; nevertheless, the overall developmental trajectory remains consistent. Upon reaching a critical loading of 65 kPa, the permeation pressure in both the surrounding rock and the fillings drops precipitously. This sharp decline signifies the instability of the fillings and the occurrence of a sudden water-inrush and mud-gush event, suggesting a further expansion of the inrush channels within the pipe. By monitoring the evolution of permeation pressure at various points during the hydraulic loading process using piezometers, the development of conduit-type water and mud inrush can be categorized into three distinct stages:
Stage I: Initiation of water-conducting channels. Permeation water pressure increases continuously, and the growth trends at monitoring points A2 and A4 are generally consistent. During this stage, as the external water pressure increases, permeation water pressure within the infilling material rises steadily. Seepage-induced erosion gradually enlarges flow paths within the infill, leading to the progressive development of seepage and water-conducting channels.
Stage II: Erosion and enlargement of water-conducting channels. Permeation water pressure continues to increase, while the differences in permeation water pressure between monitoring points at different radial distances gradually become more pronounced. Nevertheless, the overall trend of permeation water pressure increasing approximately linearly with the applied water pressure is maintained.
Stage III: Instability stage. During this stage, the permeation water pressure differences among monitoring points within the karst pipe continue to increase. After the applied water pressure reaches 60 kPa and is maintained for a period of time, a sudden drop in permeation water pressure occurs, signifying the instability and failure of the infilling material. This abrupt pressure release marks the onset of the water and mud inrush disaster.
3.4. Indicators during disaster evolution process
By integrating the variations in displacement, stress, and permeation pressure at the tunnel crown, data from the representative monitoring point A1 were selected to construct error band plots for the filling medium during the excavation process across three parallel tests, as illustrated in Figure 7.
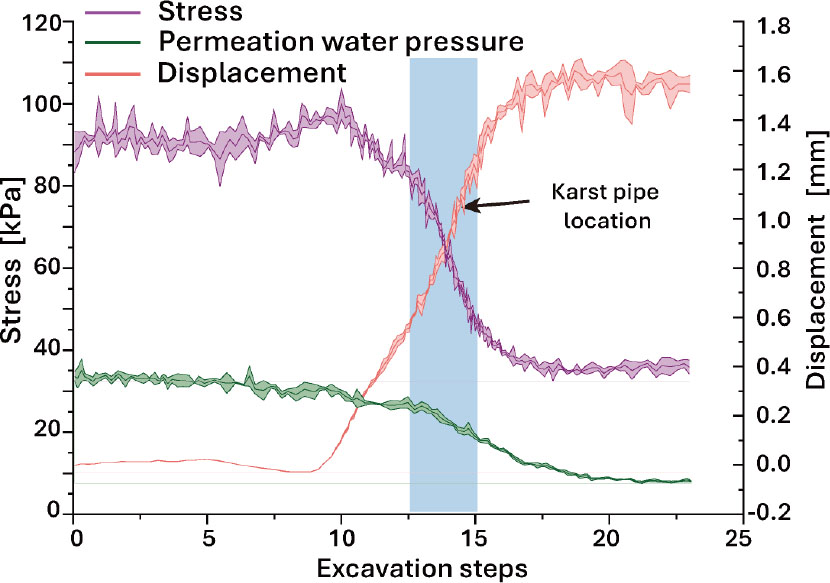
Figure 7:
Evolution of monitoring data for the infilling material during the excavation process
Results indicate that the stress within the surrounding rock is gradually released during excavation, leading to a redistribution of the internal geostress field. During this process, scattered micro-cracks develop within both the surrounding rock and the filling materials. These micro-fractures cause fluctuations in the displacement growth trend, accompanied by a slight decrease in permeation pressure. As the tunnel face approaches the zone containing the karst pipe, the vertical stress within the filling medium drops rapidly, triggering a secondary stress redistribution. Consequently, the previously dispersed cracks expand and coalesce, forming preferential flow paths for karst water. This phase is characterized by an accelerated deformation rate, a precipitous drop in permeation pressure, and a marked increase in the permeation velocity. After the excavation face passes through the influence zone of the karst conduit, the monitored data gradually stabilize.
The error bands from the parallel tests reveal a significant divergence in the evolution of surrounding rock stress, permeation pressure, and displacement during excavation. Between excavation steps 0 and 10, the displacement error band remains narrow, whereas the stress error band reaches its maximum. This phenomenon is likely attributed to the substantial variations in surrounding rock disturbance caused by manual excavation across different parallel trials. As excavation progresses and the tunnel face nears the karst conduit, the displacement error band gradually widens, while the stress error band narrows and subsequently remains stable. Following the passage of the tunnel face beyond the karst pipe longitudinal position, the error band for permeation pressure continues to contract, with values progressively trending toward a steady state.
Figure 8 presents the evolution curves of the monitoring data for the infilling material during the applied water pressure loading stage after completion of tunnel excavation. The results indicate that, during the water pressure loading phase, erosion and seepage induced by high water pressure gradually deteriorate the mechanical and hydraulic properties of the surrounding rock around fractures and the pipe infill, thereby weakening their response to further increases in external water pressure. This behavior is manifested by a continuous increase in the deformation rate as the applied water pressure rises, while the growth rates of stress and permeation water pressure gradually decrease.
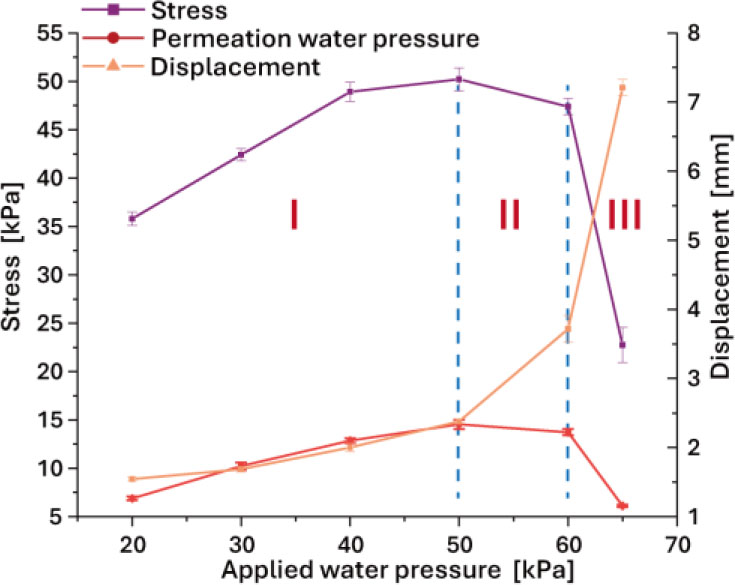
Figure 8:
Evolution curves of monitoring data for the infilling material during the water pressure loading process
With increasing applied water pressure and progressive material damage, water-conducting channels within the infilling material continuously expand and extend. Consequently, water ingress into the tunnel evolves from seepage to dripping, ultimately leading to the loss of karst pipe infilling material and the occurrence of water inrush. Under sustained high water levels and water pressure, a distinct water inrush channel is formed. In particular, when the external hydraulic head exceeds 60 kPa, stress begins to decrease and permeation water pressure drops sharply, accompanied by a rapid increase in deformation. The discharge of mud slurry from the karst pipe marks the transition of the infilling material into an unstable water and mud inrush state. The error bars derived from the three sets of parallel experimental data further demonstrate high consistency, thereby confirming the reliability and robustness of the experimental results.
The above experimental results indicate that tunnel excavation first exposes karst pipeline or reduces the thickness of the safety rock pillar between the water-rich body and the tunnel free surface. Under the action of water pressure, the pore water pressure in the rock mass between the water-rich body and the tunnel free surface continuously increases. Fine-grained filling materials are gradually eroded and carried away by water seepage, forming minute seepage channels. These changes alter the porosity and permeability coefficient of the filling materials within the karst pipeline and increase the displacement of the surrounding rock, thereby further promoting the development of huge seepage channels. Eventually, the convergence of multiple minute seepage channels leads to the formation of karst pipeline. Under such coupled effects, the rock pillar between the water-rich body and the tunnel excavation face is gradually penetrated, manifesting as pipe-type karst water inrush.
4. Numerical simulation
The prototype of this simulation test was based on the right tunnel of the referenced project, specifically the tunnel section from YK38+320 to ZK38+420. At chainage YK38+836, a karst pipe was exposed at the crown of the excavation face during tunnel advance. The pipe is approximately 10 m in length and about 5 m in width, and its infill mainly consists of clay mixed with gravel and blocky stones, as shown in Figure 9. According to the Chinese classification standard for surrounding rock, the surrounding rock in this area is classified as Grade IV. The surrounding rock near the excavation face is predominantly weathered limestone with strength ranging from strong to moderate, and well-developed joints and fractures.
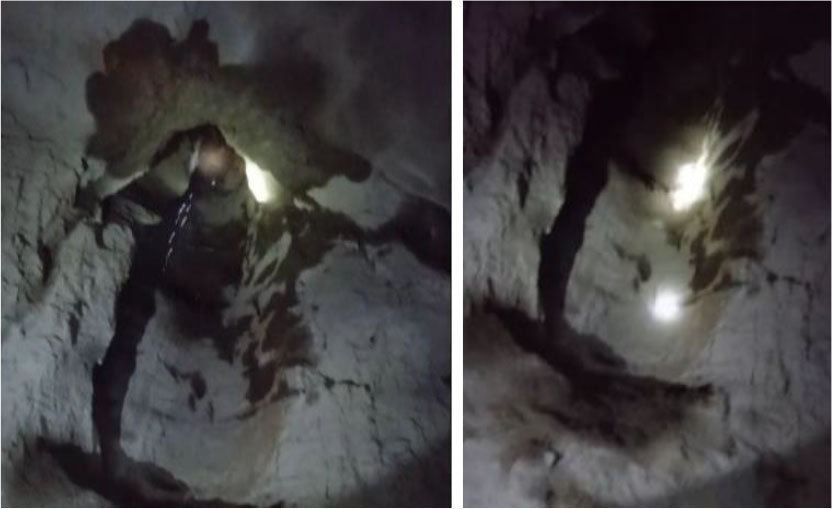
Figure 9:
Karst pipe exposed by excavation at chainage YK38+836
The geological characteristics of the site include the widespread presence of karst depressions, cavities, and faults. Multiple dissolution gullies are distributed between the depressions, together with numerous karst pipes. These pipes typically intersect the tunnel excavation face nearly perpendicularly in spatial orientation. The spatial distribution characteristics of the water-rich karst cavities and the tunnel are illustrated in Figure 10. The physical and mechanical parameters of the surrounding rock and karst pipes obtained from in situ tests are summarized in Table 7.
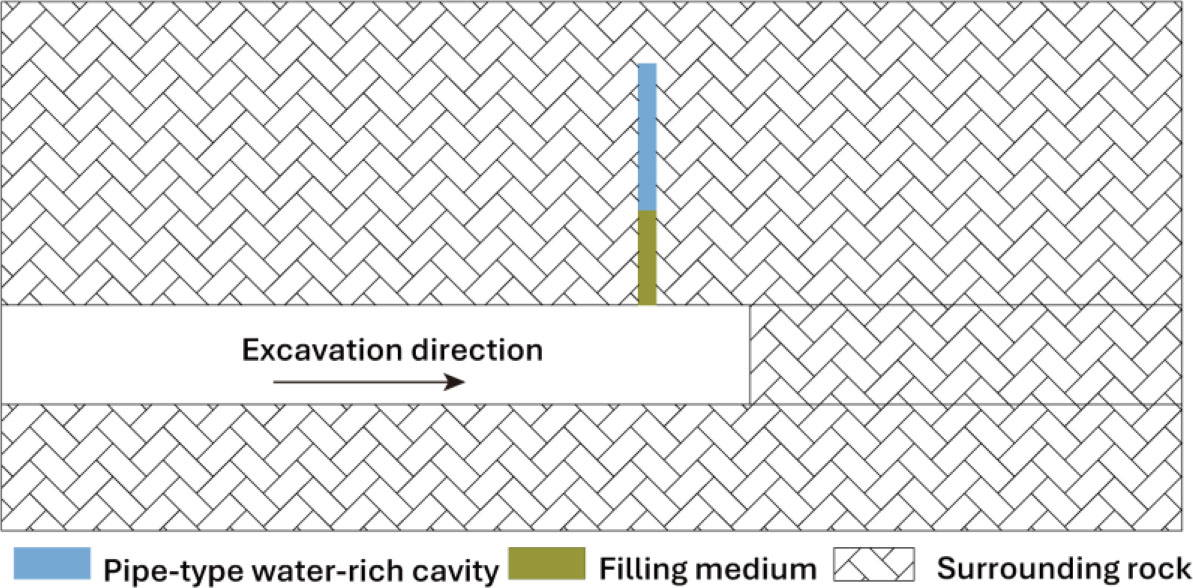
Figure 10:
Spatial distribution characteristics of the water-rich karst cavities and the tunnel as revealed on site
Table 7:
Physical and mechanical parameters of the surrounding rock and infilling material used in the model
| Elastic modulus [MPa] | Poisson’s ratio | Cohesion [MPa] | Friction angle [°] | Tensile strength [MPa] | Porosity | Permeability coefficient [m/s] | |
|---|---|---|---|---|---|---|---|
| Surrounding rock | 3000 | 0.28 | 1 | 40 | 3 | 0.18 | 1.25×10⁻⁸ |
| Infilling material | 400 | 0.35 | 0.2 | 22 | 0.05 | 0.36 | 1.85×10⁻⁸ |
4.1. Geometric model
To further investigate the spatiotemporal evolution characteristics of water and mud inrush disasters in pipe-type water-rich structures, a numerical simulation model was established using FLAC 3D. Based on the impact of tunnel excavation on the surrounding rock, the model dimensions should be no less than three times the tunnel diameter, D. In the X-direction, the model extends over three times the tunnel diameter, while in the 3D model, the tunnel profile should extend beyond this distance. Adding the tunnel dimensions, the calculated model range is 100 meters. In the Z-direction, the tunnel bottom extends to a distance of three times the tunnel diameter, making the calculation range in the Z-direction also 100 meters.
According to the site conditions, the karst pipe exposed during excavation of the right tunnel at the tunnel crown. In the model, the karst pipe is simplified as a pipe with a radius of 5 meters and a length of 10 meters. The lower part of the pipe is filled with infilling material, while the upper part of the pipe contains high-pressure, water-rich material. The numerical model is illustrated in Figure 11.
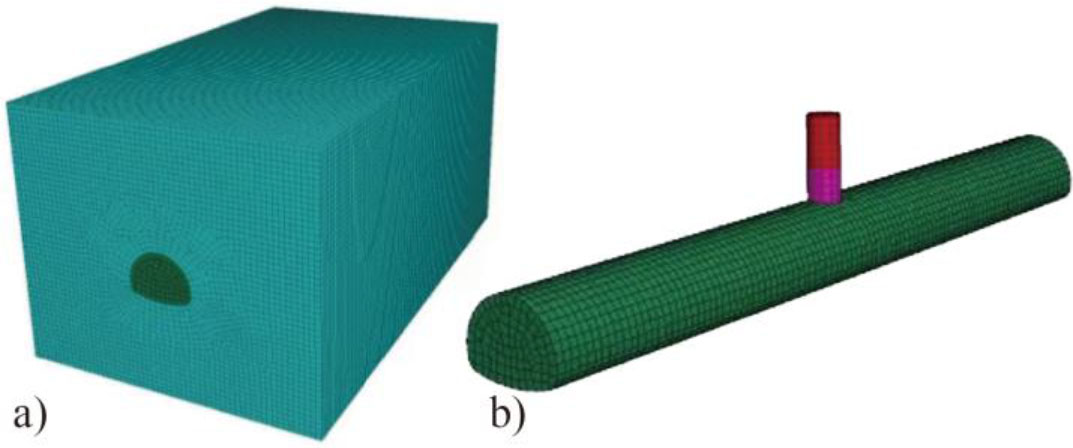
Figure 11:
a) Tunnel strata model with pipe-type water-rich structure; b) Relative position of the tunnel and karst pipe
The numerical simulation model includes a total of 331,348 elements and 285,078 nodes. The constitutive model used in the simulation is the Mohr-Coulomb elasto-plastic model, with boundary conditions set as constraints on all sides and the bottom of the model. The initial water pressure within the karst pipe is set at 1 MPa. The excavation steps for the tunnel are set at 5 meters, and after tunnel excavation, a composite lining structure is applied for support.
4.2. Boundary conditions and operating conditions
Condition 1: Based on the actual site conditions, a karst pipe with an internal water pressure of 1 MPa is present. This condition studies the water and mud inrush disaster evolution mechanism for a pipe-type water-rich structure during tunnel excavation.
Condition 2: This condition investigates the disaster evolution mechanism of water and mud inrush for pipe-type water-rich structures under varying water pressures during tunnel excavation. The water pressure gradient varies as 0 MPa, 0.5 MPa, 1 MPa, 1.5 MPa, and 2.0 MPa.
Condition 3: This condition explores the disaster evolution mechanism of water and mud inrush for pipe-type water-rich structures during tunnel excavation under different infill material lengths within the karst pipe. The length gradient of the pipe infill material is 4 m, 8 m, 12 m, and 16 m.
4.3. Evolution of the pipe filling material during excavation
4.3.1. Displacement
Under the conditions of Condition 1, as the tunnel is gradually excavated and approaches the karst pipe area, the karst pipe is encountered at the 10th excavation step. The maximum displacement of the surrounding rock at the tunnel section in the vicinity of the karst pipe during excavation is shown in Figure 12.
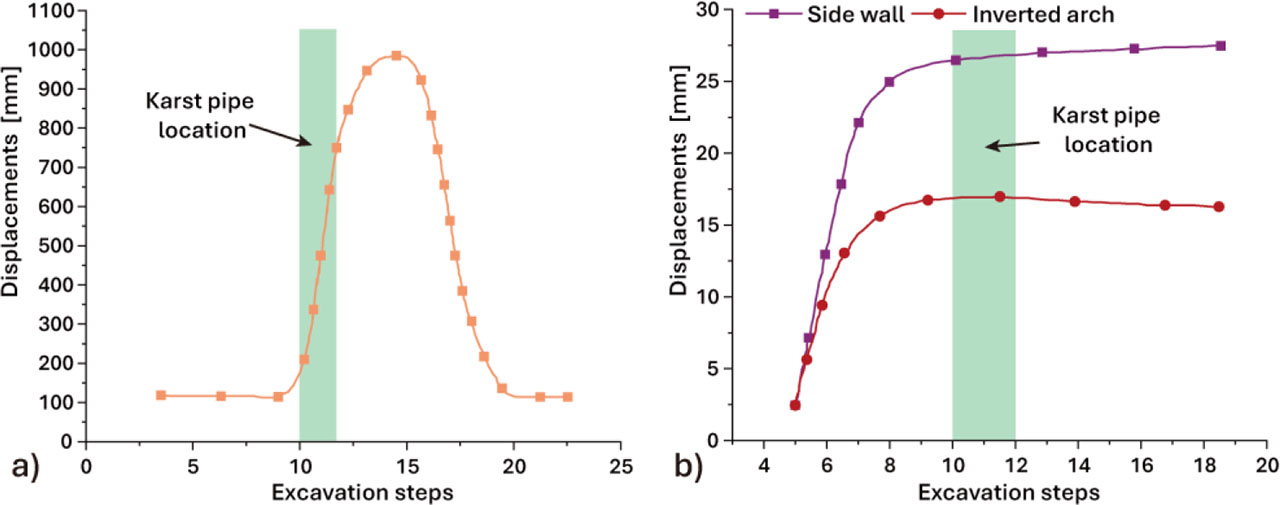
Figure 12:
Displacement variation of the surrounding rock during tunnel face excavation: a) Crown; b) Arch waist and invert arch
Prior to excavation step 7, the effect of tunnel excavation on the high-pressure zone within the karst pipe is negligible. As the excavation continues, the ongoing disturbance to the surrounding rock leads to the release of stress in the surrounding rock mass. Once this stress is released, the surrounding rock at the tunnel crown stabilizes.
Between excavation steps 7 and 13, as the tunnel excavation progresses and the high-pressure water in the karst pipe exerts influence, the stress in the surrounding rock of the karst pipe undergoes changes. As excavation approaches the top of the karst pipe, the maximum displacement of the surrounding rock at the tunnel crown increases significantly, reaching a maximum value of over 862 mm.
From excavation steps 13 to 20, the influence of tunnel excavation on the karst pipe diminishes, and the surrounding rock stabilizes, with minimal further changes.
4.3.2. Plastic zone of surrounding rock
Under the conditions of Condition 1, the variation of the plastic zone in the surrounding rock of the water-rich karst pipe section during tunnel excavation is shown in Figure 13. From the figure, it can be seen that shear failure begins to appear gradually ahead of the tunnel face starting from excavation step 9. As the excavation approaches the high-pressure water-rich karst pipe at the tunnel crown, the plastic zone in the tunnel and surrounding karst pipe gradually expands outward.
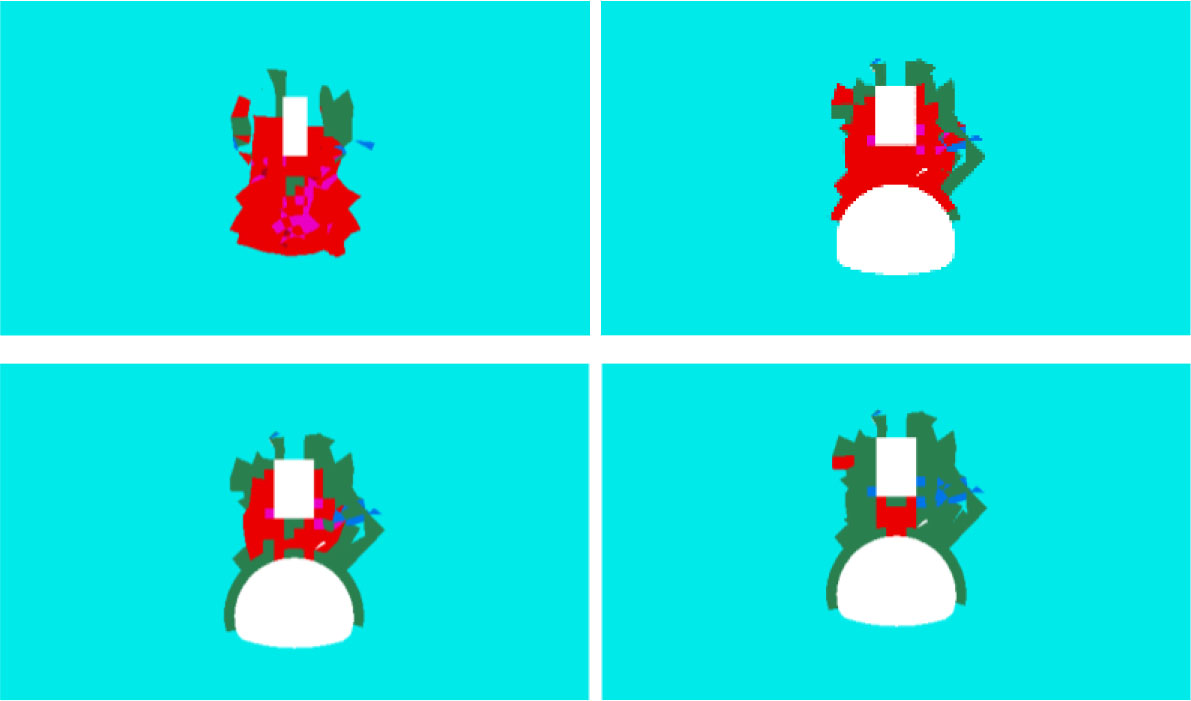
Figure 13:
Evolution of the plastic zone changes in the surrounding rock: a) Step 9; b) Step 10; c) Step 11; d) Step 12
When excavation reaches step 10, shear failure occurs in both the surrounding rock of the tunnel and the surrounding rock at the top of the karst pipe. At this stage, the infill material within the karst pipe remains relatively stable and continues to block the karst water, with a low probability of water and mud inrush.
As excavation progresses to step 11, the entire karst pipe at the tunnel crown is exposed. With continued construction disturbances, the plastic zone around the tunnel expands outward. Simultaneously, the plastic zone within the infill material of the karst pipe and the surrounding rock also increases. This causes the effective water-blocking thickness of the infill material to decrease, thereby increasing the likelihood of a water and mud inrush disaster.
By excavation step 12, the changes in the plastic zone around the tunnel and karst pipe surrounding rock are minimal. However, with the continued disturbance from tunnel excavation and the gradual expansion of seepage channels, the infill material within the karst pipe becomes increasingly disturbed by excavation and seepage from the high-pressure karst water. As the seepage channels continue to expand, a water and mud inrush disaster occurs.
4.3.3. Permeability coefficient
Under the conditions of Condition 1, the variation in the permeability coefficient of the surrounding rock in the karst pipe section during tunnel excavation is shown in Figure 14. From the figure, it can be observed that at excavation step 8, the tunnel excavation causes a change in the permeability coefficient of the surrounding rock ahead of the tunnel face, while the permeability coefficient of the karst pipe infilling material shows little variation.
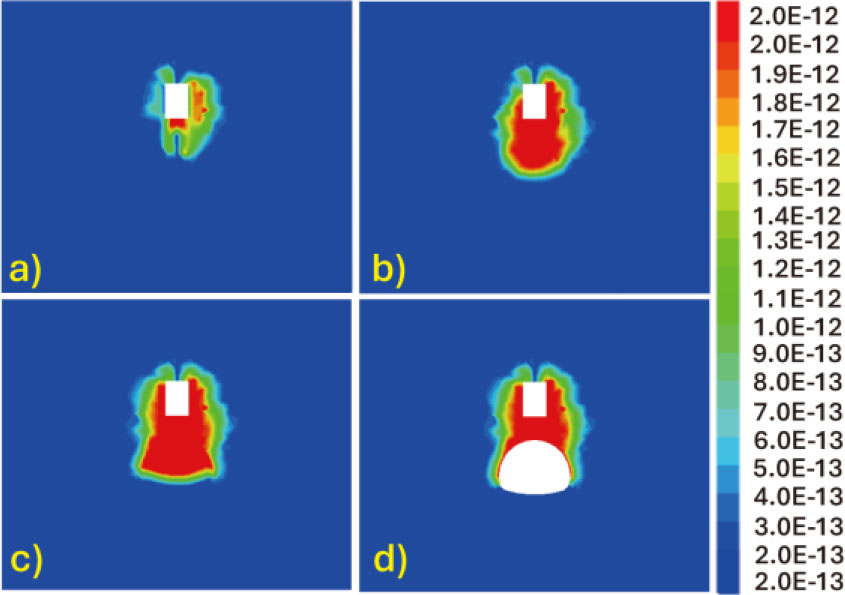
Figure 14:
Variation of permeability coefficient of surrounding rock during excavation (unit: m/s): a) Step 8; b) Step9; c) Step10; d) Step11
As the excavation progresses to step 9, the permeability coefficient of the surrounding rock ahead of the tunnel face increases by more than 10 times. The area affected by the change in permeability expands, and the permeability coefficient of the infilling material above the karst pipe also increases by 10 times. This leads to a gradual increase in water inrush into the tunnel.
When excavation reaches step 10, the area of permeability coefficient change ahead of the tunnel face continues to expand, especially in the surrounding rock near the karst pipe at the tunnel crown, where the permeability coefficient of the surrounding rock increases significantly. At this point, the karst pipe is partially exposed, and the permeability coefficient of the infilling material increases further due to both the excavation disturbance and the high-pressure water in the karst pipe. The water-conducting channels within the infill material gradually expand, and the water inrush into the tunnel continues to increase.
When excavation reaches step 11, the karst pipe is fully exposed. Under the combined effects of excavation disturbance and the infiltration of high-pressure water, the infilling material becomes unstable and fails, causing a rapid influx of high-pressure water into the tunnel, resulting in a water and mud inrush disaster.
4.3.4. Total inflow
Under the conditions of Condition 1, the water inflow into the tunnel during excavation was monitored using numerical simulation, as shown in Figure 15. During excavation steps 1 to 7, the tunnel water inflow remained within a relatively stable and low range. At this stage, the inflow was mainly derived from fissure water in the surrounding rock.
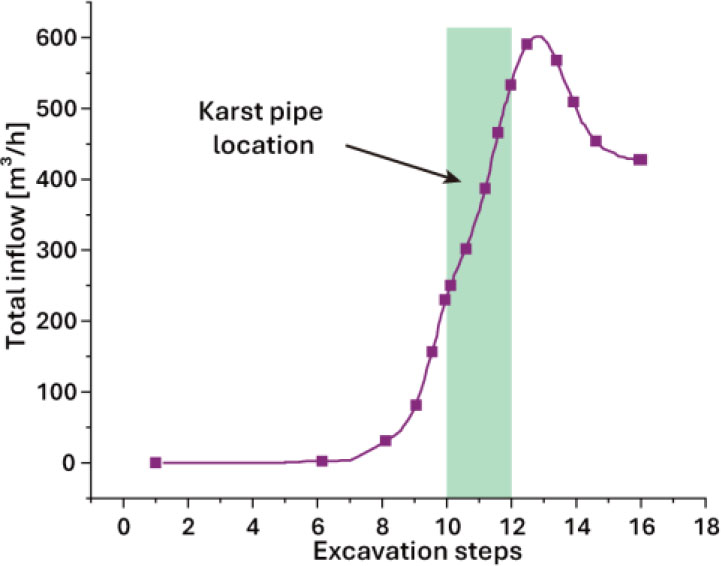
Figure 15:
Variation of water inflow into the tunnel during excavation
When excavation progressed from steps 8 to 10, the disturbance induced by tunnel excavation led to a gradual increase in the permeability coefficient of the surrounding rock. Simultaneously, the permeability coefficient in the vicinity of the karst pipe also increased, resulting in a rapid rise in tunnel water inflow. The increase in permeability of the surrounding rock around the karst pipe caused a continuous rise in permeation water pressure in the surrounding rock near the tunnel crown, which further enhanced seepage flow toward the tunnel.
As excavation advanced to steps 11 to 13, the karst pipe became fully exposed. Under the combined effects of excavation-induced disturbance and high-pressure water within the pipe, the infilling material in the karst pipe gradually deteriorated and failed. Continuous seepage erosion by high-pressure water led to a further increase in the permeability coefficient of the infilling material, promoting the formation and expansion of seepage channels. Consequently, the infilling material was no longer able to provide sufficient resistance against the high-pressure water within the pipe, ultimately triggering a sudden water and mud inrush disaster.
4.4. Evolution of pipe filling material under water pressures
4.4.1. Displacement
Under Condition 2, the displacement evolution of the karst pipe section in a pipe-type water-rich karst structure subjected to different water pressures was investigated, as shown in Figure 16. The results clearly indicate that both the displacement of the surrounding rock around the tunnel and that of the karst pipe infilling material increase with rising water pressure.
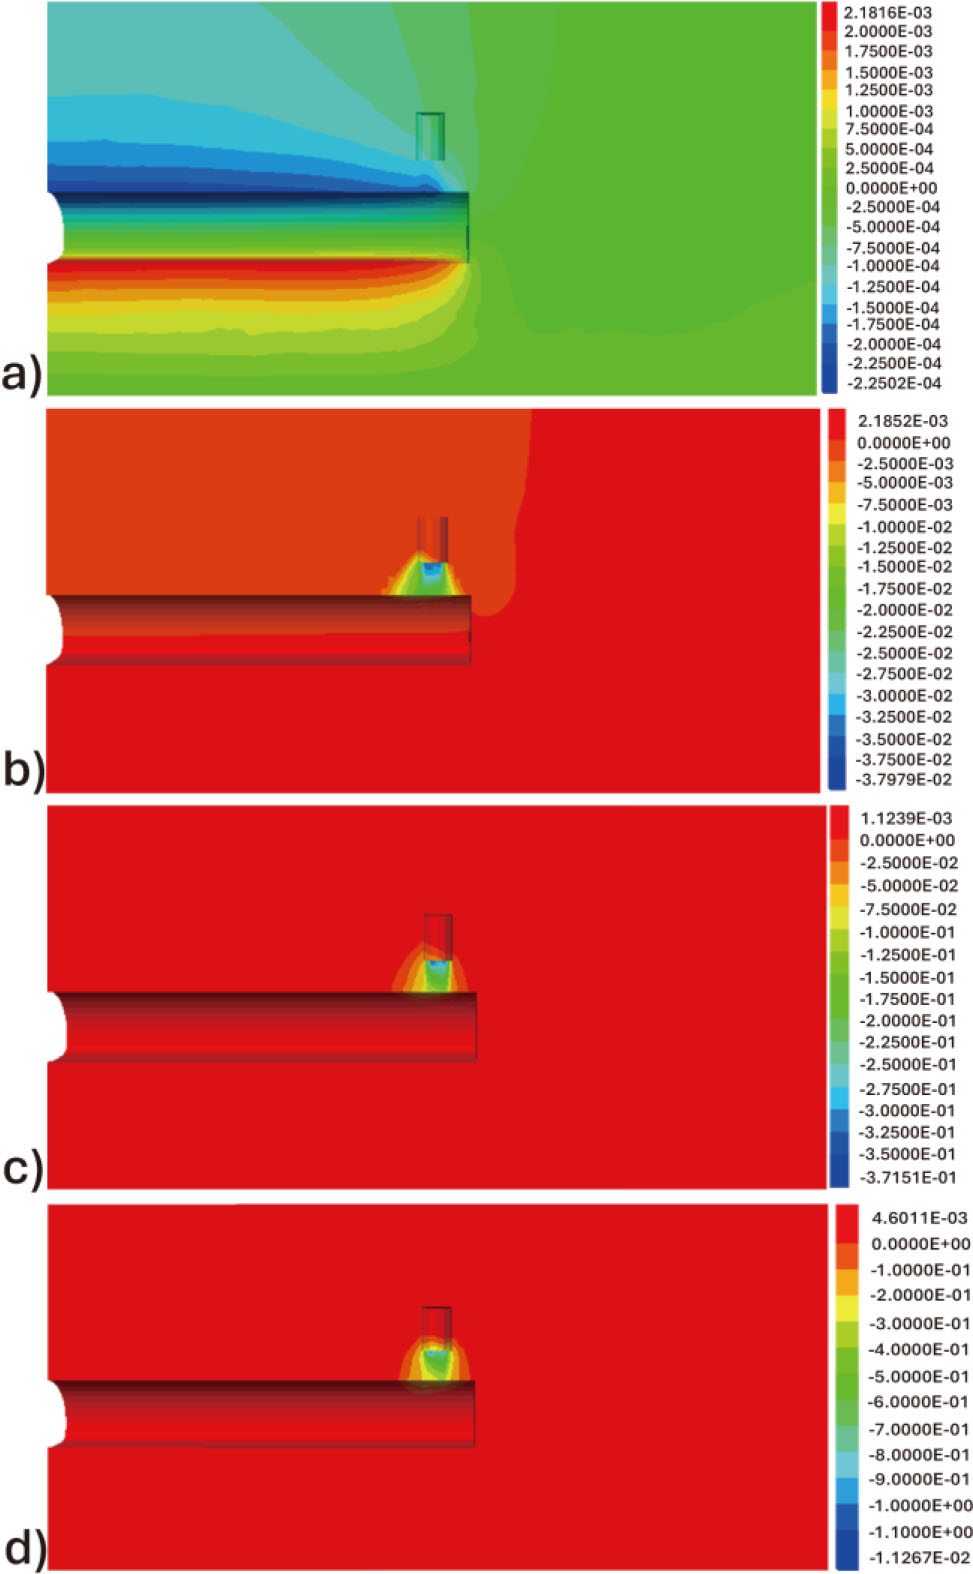
Figure 16:
Displacement variation of the tunnel surrounding rock under different water pressures (unit: m): a)0MPa; b)0.5MPa; c)1.5MPa; d) 2MPa
When the water pressure is lower than 1 MPa, after the tunnel completely exposes the karst pipe, the displacement of the infilling material remains relatively small. At this stage, the infilling material undergoes gradual seepage-induced damage but still retains a certain degree of stability, enabling it to act as an effective water barrier. Consequently, a large amount of seepage water enters the tunnel. With time, however, the infilling material is progressively eroded under high-pressure water, leading to the gradual formation of seepage channels and eventually triggering a water and mud inrush disaster.
When the water pressure exceeds 1 MPa, once tunnel excavation fully exposes the karst pipe, the infilling material within the pipe is rapidly damaged under the action of high-pressure water. As the internal water pressure in the pipe continues to increase, the vertical displacement of the infilling material increases persistently. When the water pressure reaches a critical threshold, the infilling material fractures and undergoes sliding instability, ultimately inducing a sudden water and mud inrush disaster in the tunnel.
This suggests that 1.0 MPa represents the critical water pressure derived from numerical simulations. In contrast, the critical water pressure obtained from the model tests ranges between 60 kPa and 65 kPa. According to the similarity criteria and the 1:30 geometric similarity ratio employed in the experimental design, the extrapolated critical water pressure for the prototype under this condition should be 1.8 MPa to 1.95 MPa. This discrepancy is primarily attributable to the inconsistent geometric dimensions of the karst conduits.
Based on the similarity principle, the prototype of the karst conduit in the model test has a radius of 1.5 m and a length of 18 m, dimensions that were constrained by experimental conditions such as the size of the test chamber. Conversely, the numerical simulation was conceptualized based on actual engineering site conditions, with a conduit length of 10 m and a width of approximately 5 m. Notably, both configurations satisfy the critical water pressure conditions calculated using established theoretical formulas (Li et al., 2019,b; Guo et al., 2012).
4.4.2. Permeability coefficient
Under Condition 2, the variation in the permeability coefficient of the karst pipe section under different water pressures was investigated, as shown in Figure 17. Under varying water pressure levels, as the tunnel excavation progressively exposes the karst pipe, the permeability coefficient of the surrounding rock around the karst pipe at the tunnel crown exhibits an increasing trend.
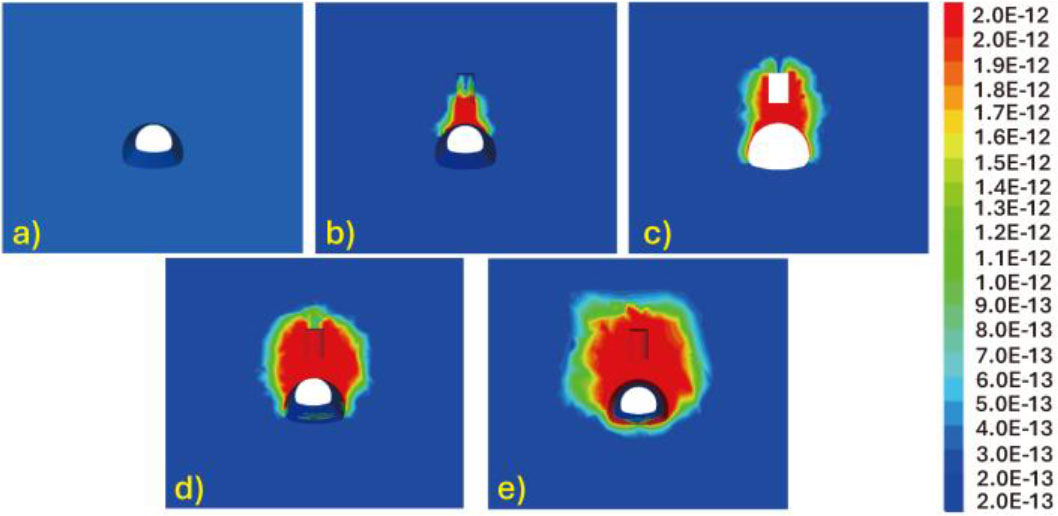
Figure 17:
Variation of the permeability coefficient under different applied water pressures (unit: m/s): a)0MPa; b) 0.5MPa; c) 1MPa; d) 1.5MPa; e)2.0MPa
When the water pressure is lower than 1 MPa, excavation-induced disturbance causes partial damage to the infilling material within the karst pipe, leading to a gradual increase in its permeability coefficient. However, the strength of the infilling material remains sufficient to provide effective water-sealing capacity under this pressure level. As a result, seepage inflow into the tunnel increases, but no water and mud inrush disaster occurs.
In contrast, when the water pressure exceeds 1 MPa, the strength of the infilling material within the karst pipe becomes insufficient to maintain structural stability under high hydraulic loading. Consequently, the permeability coefficient of the infilling material increases more rapidly, accompanied by sliding instability of the infill. This process ultimately leads to the occurrence of a water and mud inrush disaster in the tunnel.
4.4.3. Total inflow
Under Condition 2, the variation in tunnel water inflow from the karst pipe section under different water pressures was investigated, as shown in Figure 18. The results indicate that when the water pressure is lower than 0.5 MPa, the karst-related water inflow into the tunnel is very small and can be considered negligible. At this stage, tunnel inflow mainly originates from fissure water in the surrounding rock and does not induce a water and mud inrush disaster.
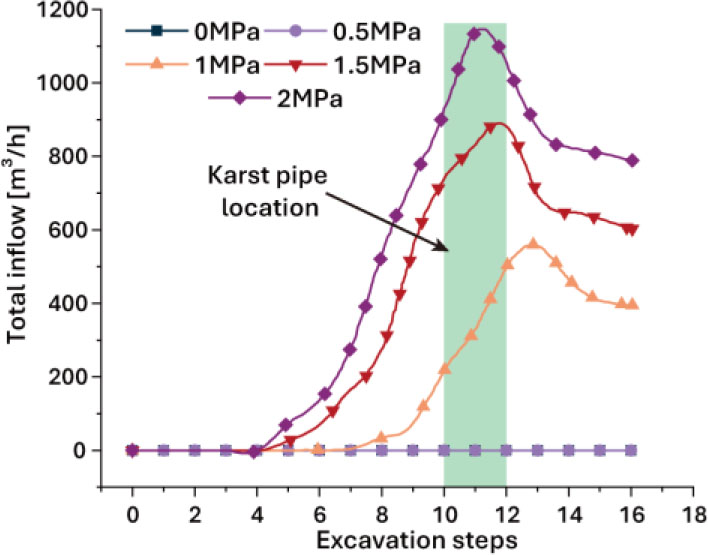
Figure 18:
Variation trend of tunnel water inflow under different water pressures
When the water pressure exceeds 1 MPa, as tunnel excavation progressively advances toward the karst pipe and ultimately exposes the karst infilling material, the tunnel water inflow increases continuously. The closer the excavation face approaches the karst pipe, the more pronounced the increase in water inflow becomes. Moreover, with increasing water pressure, the magnitude of tunnel inflow further increases. Higher water pressure not only intensifies the water inflow but also advances the initiation time of water and mud inrush disasters, indicating that elevated hydraulic pressure significantly accelerates the occurrence of catastrophic inrush events.
4.5. Evolution of pipe filling material with different filling lengths
Under Operating Condition 3, the variation in tunnel water inflow under different infilling lengths of pipe-type karst pipes was analyzed, as shown in Figure 19. The results indicate that, for different infilling lengths of the karst pipe, the tunnel water inflow decreases progressively with increasing infill length, thereby reducing the likelihood of severe water and mud inrush disasters.
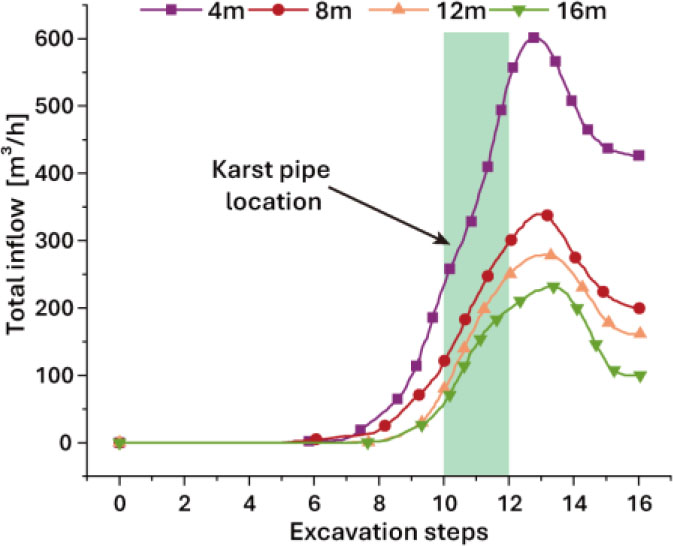
Figure 19:
Variation of water inflow during excavation under different infilling lengths of the karst pipe
When the infilling length of the karst pipe is 5 m, water inflow into the tunnel begins to appear at excavation step 6. Although the initial inflow is relatively small, it increases continuously as tunnel excavation advances. Once the karst pipe is fully exposed, the tunnel water inflow rises sharply, ultimately triggering a water and mud inrush disaster. In contrast, as the infilling length of the karst pipe increases, the tunnel water inflow during excavation is significantly reduced. This effectively enhances the water-blocking capacity of the infilling material and greatly lowers the risk of water and mud inrush disasters during tunnel construction.
5. Conclusion
This study systematically investigates the evolution mechanisms and key controlling factors of water and mud inrush disasters in tunnels under pipe-type water-rich karst conditions by integrating physical model tests, numerical simulations, and site-specific engineering backgrounds. The main conclusions are summarized as follows:
1) Pipe-type water-rich karst water and mud inrush disasters exhibit a typical progressive–catastrophic instability behavior. Tunnel excavation disturbance induces gradual stress release and microcrack initiation within the pipe infilling material. Under high hydraulic pressure, seepage channels continuously propagate and expand. When the water pressure reaches a critical range (approximately 1.0 MPa), the infilling material rapidly transitions from a stable seepage state to global instability, ultimately triggering a water and mud inrush disaster.
2) A sudden order-of-magnitude increase in permeability serves as a key quantitative criterion for disaster initiation. During the disaster incubation process, the permeability coefficients of both the surrounding rock and the infilling material increase by more than one to two orders of magnitude relative to their initial states, exhibiting pronounced acceleration prior to failure. Compared with displacement and stress responses, permeability evolution is more sensitive to the critical instability state and can be regarded as a primary indicator for identifying pipe-type water and mud inrush hazards.
3) Water pressure and infilling material scale exert significant threshold and attenuation effects on disaster evolution. Higher water pressure leads to faster growth of tunnel water inflow and earlier initiation of water and mud inrush events. Conversely, increasing the length of the pipe infilling material from short to medium–long scales significantly reduces tunnel inflow and markedly lowers the probability of catastrophic failure. Multi-parameter monitoring results further indicate strong coupling among displacement acceleration, abrupt pore pressure drop, and rapid permeability increase prior to disaster occurrence, providing a quantitative basis for engineering early-warning systems.
Acknowledgements
2020 Key Science and Technology Project of the Transportation Industry—Research on Key Technologies for Mechanized and Intelligent Expansion of Highway Tunnels (2020-ZD2-003); National Natural Science Foundation of China (52078089, 52274176); Yunnan Provincial Key Research and Development Program (202203AA080006); Science and Technology Demonstration Project for Safe and Intelligent Construction of Fengjian Expressway in the Three Gorges Reservoir Area [(2021)581]; Chongqing Talents Program for Leading Talents in Entrepreneurship and Innovation (CQYC20220302517); Chongqing Municipal Natural Science Foundation Innovation Development Joint Fund (CSTB2022NSCQ-LZX0079.
Notes
[1] Contributed by Author Contributions
H. L. finished the conceptualization, funding acquisition, methodology, software, investigation of the manuscript. Z. L. finished the writing, visualization, resources, editing, data curation of the manuscript, conceptualization and resource of the manuscript. Y. W. finished the data curation. J. W. finished the data curation, writing of the manuscript, formal analysis and software. W. F. finished the supervision. H. Z. finished the data curation and visualization. All authors critically reviewed and approved the final version of the manuscript and agreed to be accountable for all aspects of the work.