

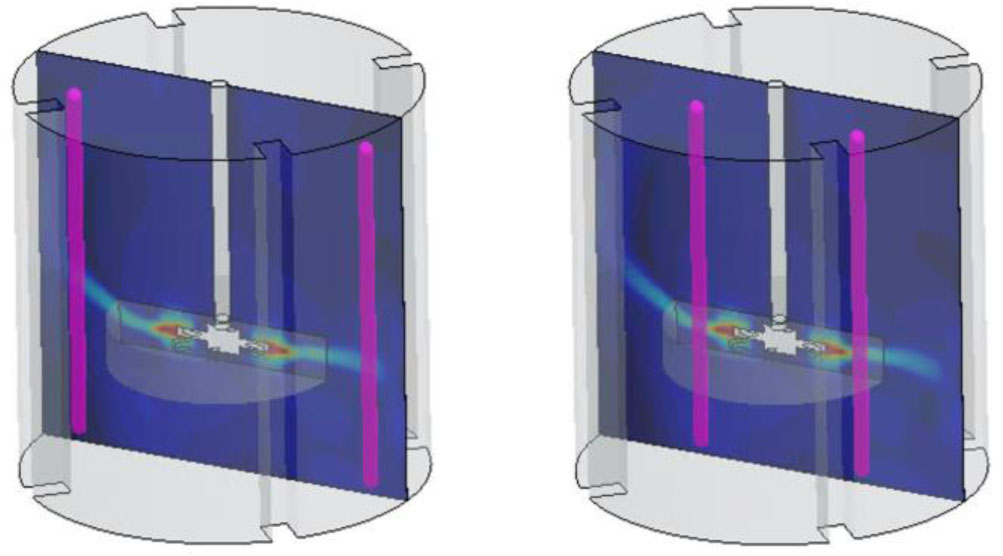
Figure 1:
Line-probes (in purple) used to extract the axial profiles of the radial velocity components in STAR CCM+
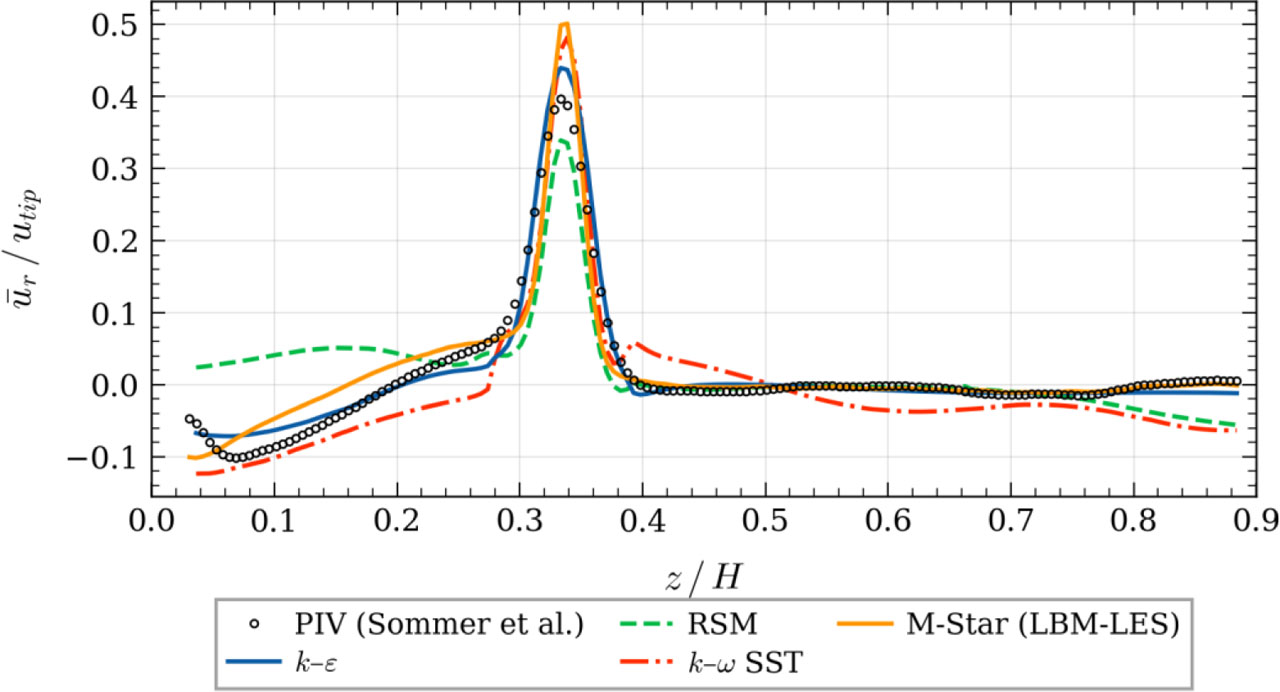
Figure 2:
Normalized radial velocity profiles at 2r/Dt = 0.44, Ω = 650 rpm
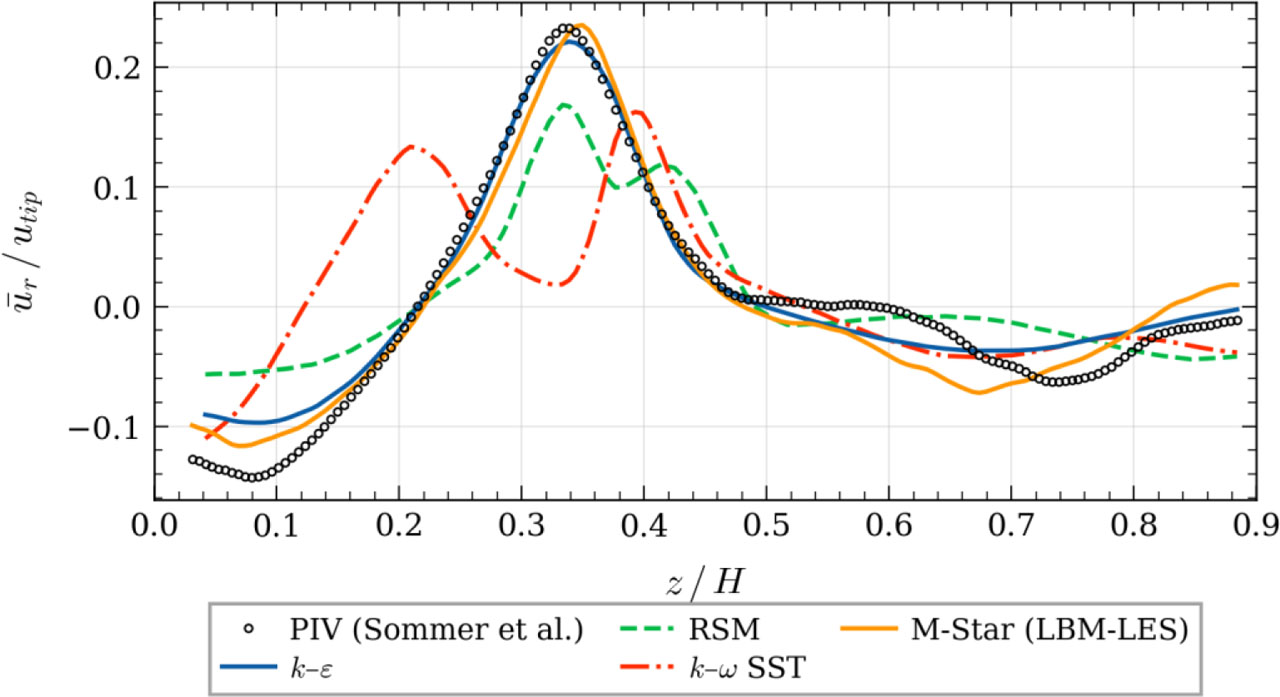
Figure 3:
Normalized radial velocity profiles at 2r/Dt = 0.80, Ω = 650 rpm
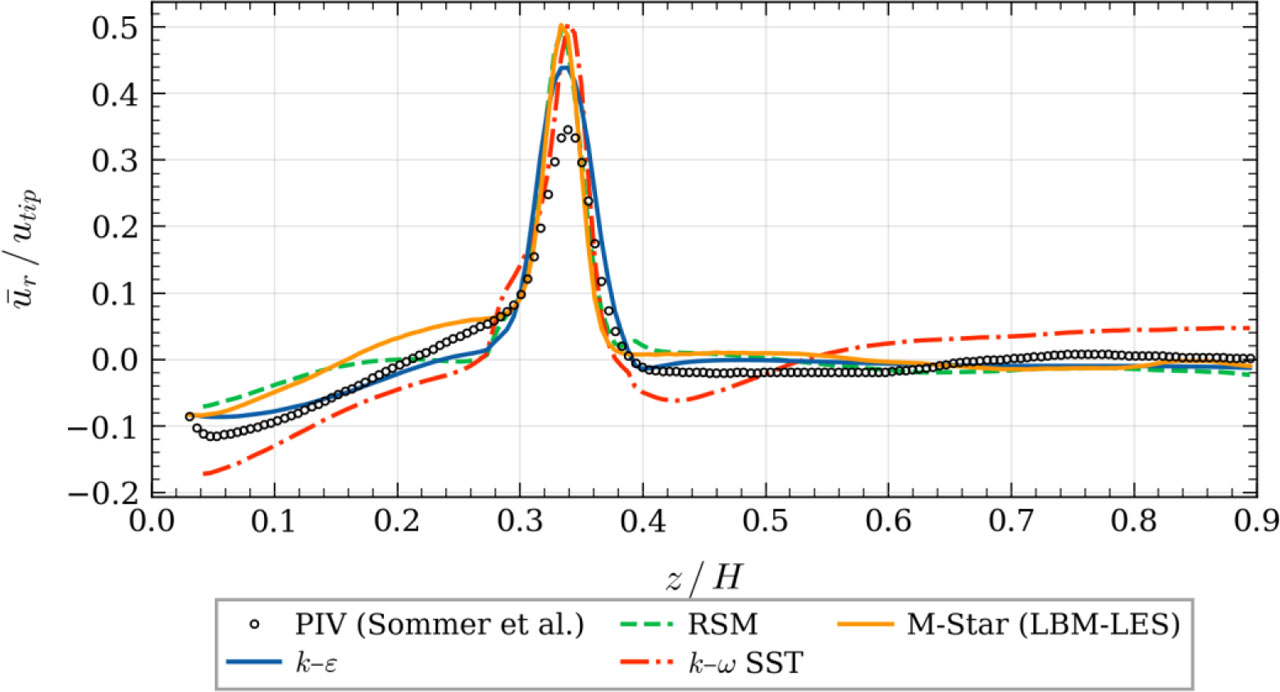
Figure 4:
Normalized radial velocity profiles at 2r/Dt = 0.44, Ω = 1500 rpm
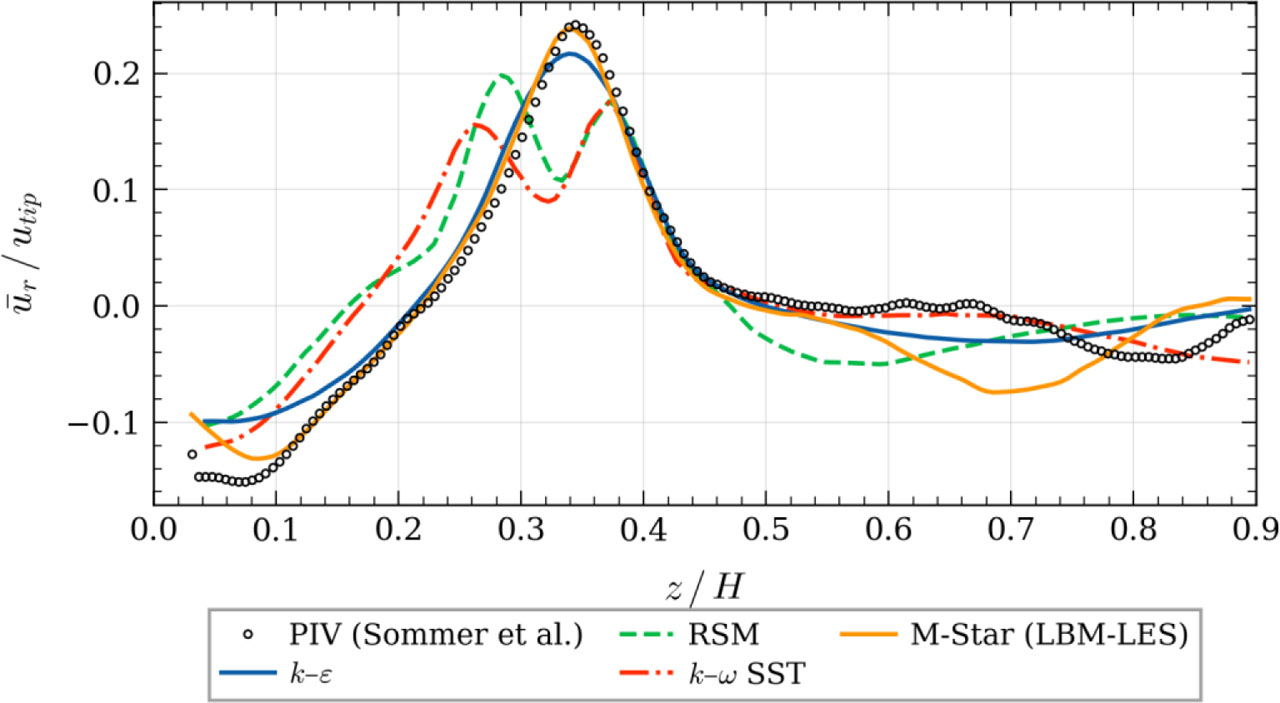
Figure 5:
Normalized radial velocity profiles at 2r/Dt = 0.80, Ω = 1500 rpm
Table 1:
NRMSD of the normalized radial velocity ūr/utip for each CFD model, radial position, and impeller speed
| Condition | k–ɛ | RSM | k–ω SST | M-Star LBM |
|---|---|---|---|---|
| 650 rpm, 2r/Dt = 0.44 | 0.035 | 0.116 | 0.081 | 0.056 |
| 650 rpm, 2r/Dt = 0.80 | 0.051 | 0.119 | 0.213 | 0.058 |
| 1500 rpm, 2r/Dt = 0.44 | 0.065 | 0.080 | 0.094 | 0.079 |
| 1500 rpm, 2r/Dt = 0.80 | 0.057 | 0.127 | 0.112 | 0.072 |
| Average | 0.052 | 0.110 | 0.125 | 0.066 |
Table 2:
Peak normalized radial velocity and relative error for each CFD model
| Condition | PIV peak | k–ɛ | RSM | k–ω SST | M-Star |
|---|---|---|---|---|---|
| 650 rpm, 0.44 | 0.397 | 0.440 (+10.8%*) | 0.339 (−14.5%) | 0.482 (+21.5%) | 0.501 (+26.3%) |
| 650 rpm, 0.80 | 0.232 | 0.221 (−4.9%) | 0.168 (−27.6%) | 0.162 (−30.1%) | 0.235 (+1.1%) |
| 1500 rpm, 0.44 | 0.347 | 0.439 (+26.6%) | 0.492 (+42.1%) | 0.505 (+45.6%) | 0.503 (+45.2%) |
| 1500 rpm, 0.80 | 0.242 | 0.217 (−10.4%) | 0.198 (−18.0%) | 0.175 (−27.7%) | 0.239 (−1.4%) |
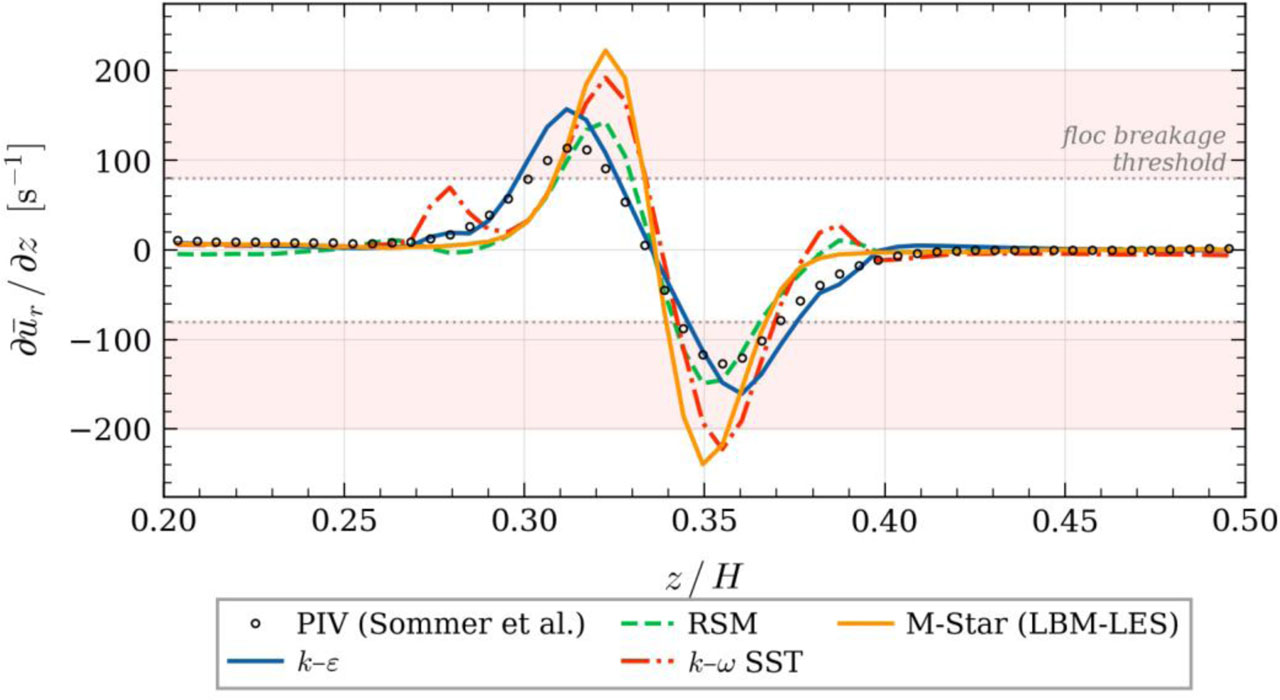
Figure 6:
Velocity gradient profiles ∂ūr/∂z [s−1] at 2r/Dt = 0.44, Ω = 650 rpm
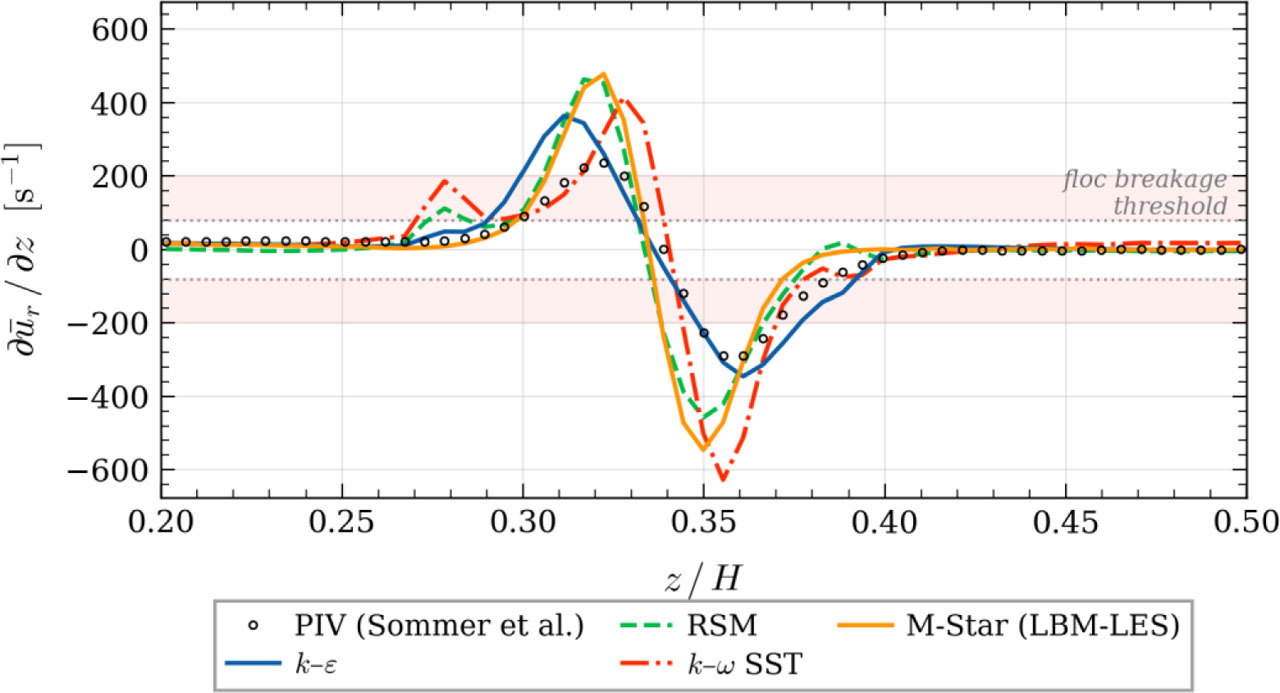
Figure 7:
Velocity gradient profiles ∂ūr/∂z [s−1] at 2r/Dt = 0.44, Ω = 1500 rpm
Table 3:
Peak velocity gradient magnitudes [s−1] and gradient amplification
| Condition | PIV |G|_max | k–ɛ | RSM | k–ω SST | M-Star |
|---|---|---|---|---|---|
| 650 rpm, 0.44 | 127 | 161 (+26%) | 149 (+17%) | 223 (+75%) | 239 (+88%) |
| 650 rpm, 0.80 | 30 | 31 (+3%) | 32 (+9%) | 47 (+58%) | 33 (+10%) |
| 1500 rpm, 0.44 | 289 | 364 (+26%) | 463 (+60%) | 627 (+117%) | 546 (+89%) |
| 1500 rpm, 0.80 | 85 | 68 (−20%) | 100 (+17%) | 82 (−4%) | 82 (−4%) |
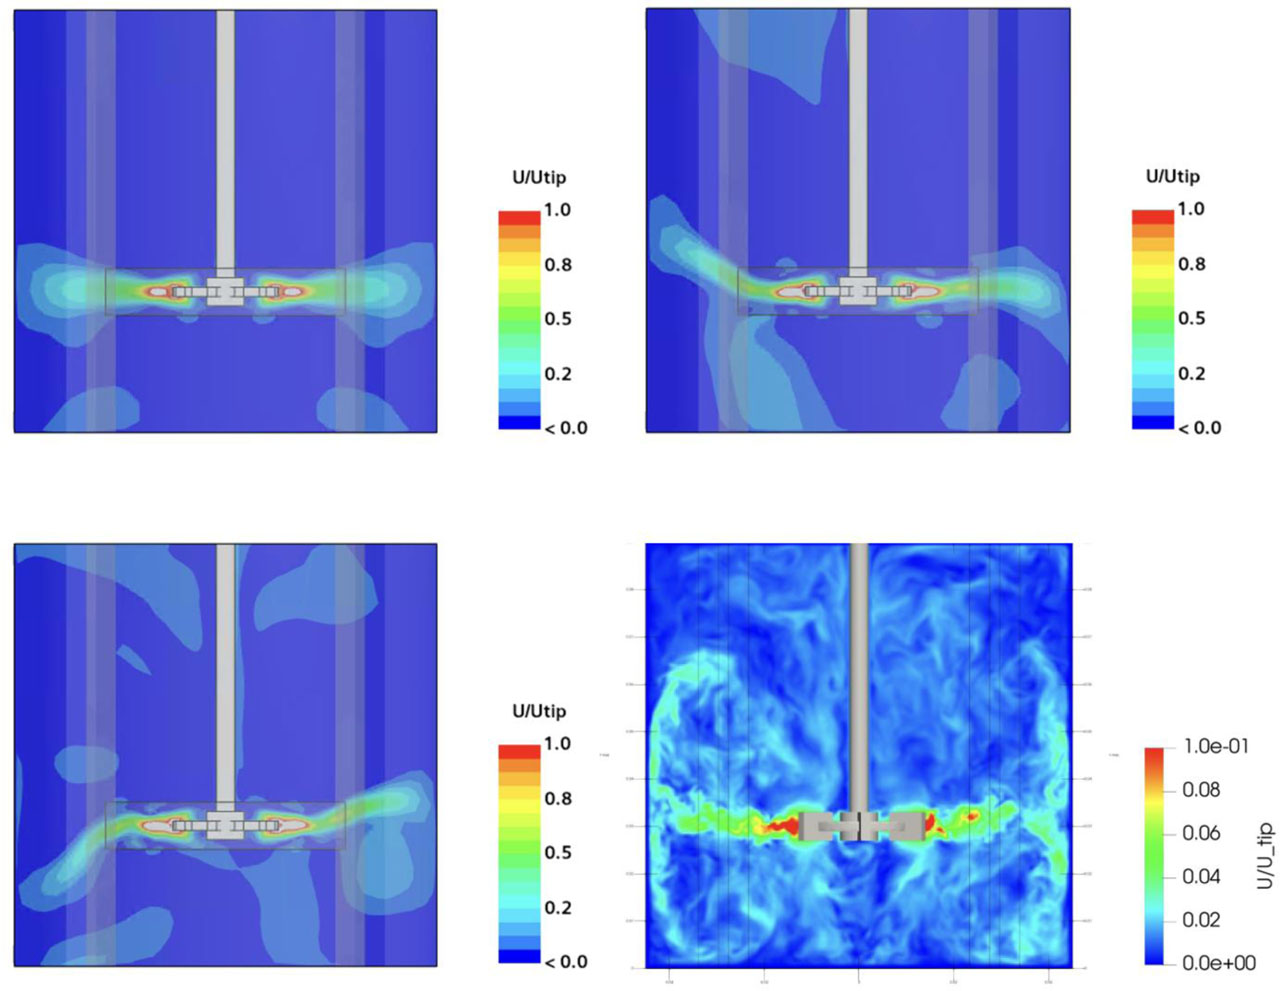
Figure 8:
Contour plots for ūr/utip in the measurement plane of the PIV dataset for k–ɛ (top-left), RSM (top-right), and k-⍵ (bottom-left) and LBM-LES models