

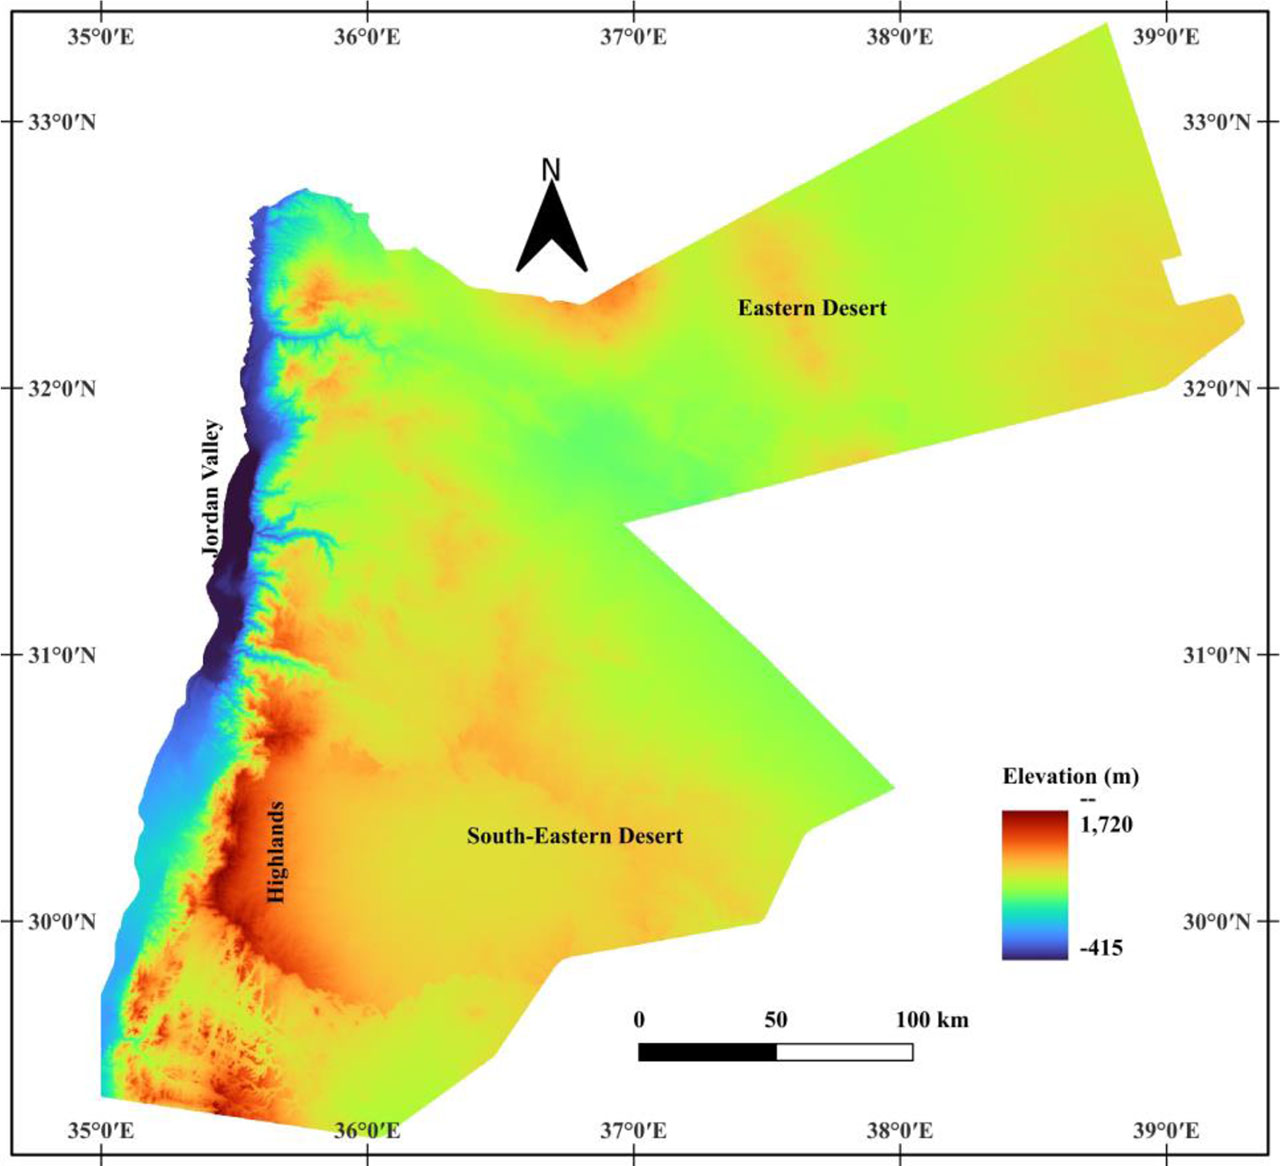
Figure 1:
Major physiographic districts in Jordan
Table 1:
Assigned PDNm ranges for modified drought severity levels
| Severity level | PDNm (%) |
|---|---|
| No drought | Above −10 |
| Mild | −10 to −25 |
| Moderate | −25 to −50 |
| Severe | −50 to −60 |
| Extreme | Below −60 |
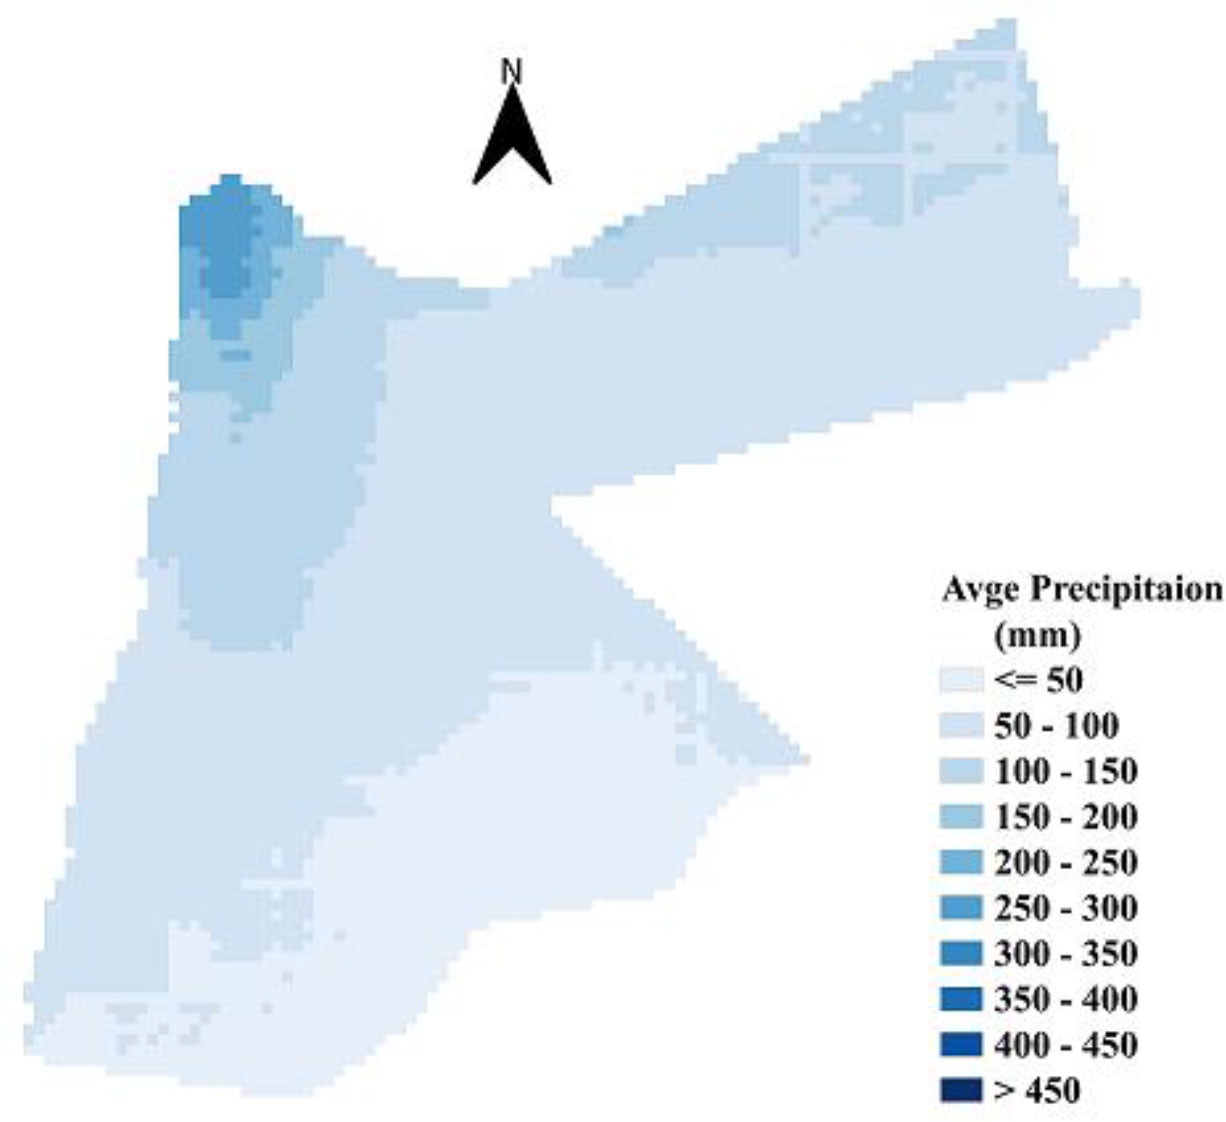
Figure 2:
Spatial distribution of PDIR precipitation over Jordan
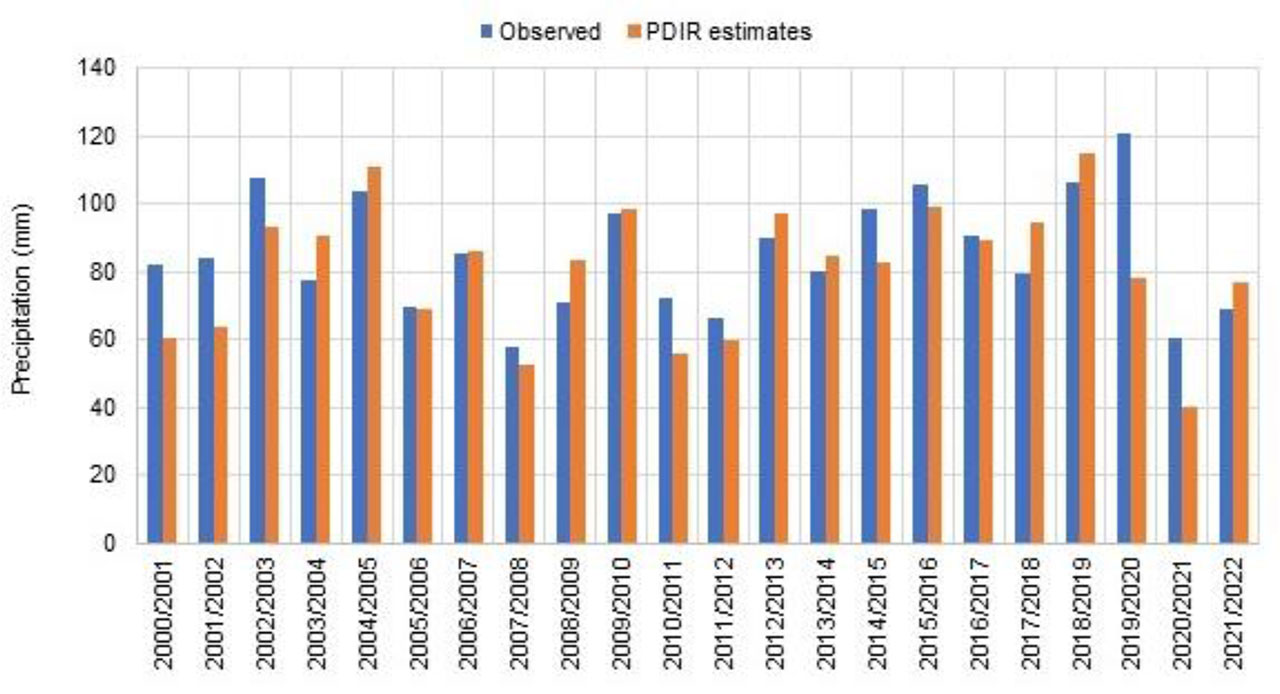
Figure 3:
Temporal variations of the observed and PDIR precipitation estimates
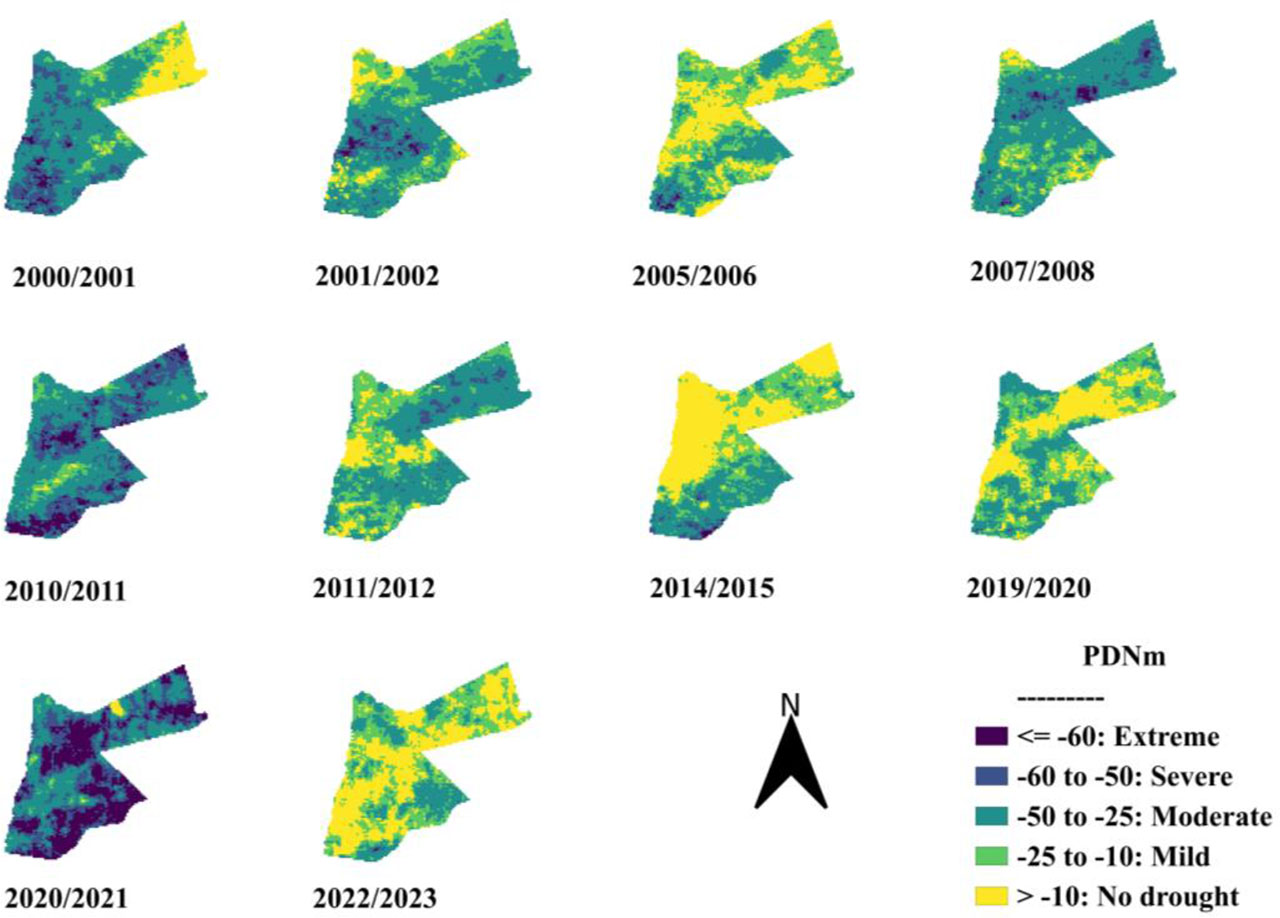
Figure 4:
Detected droughts in Jordan and their severity levels
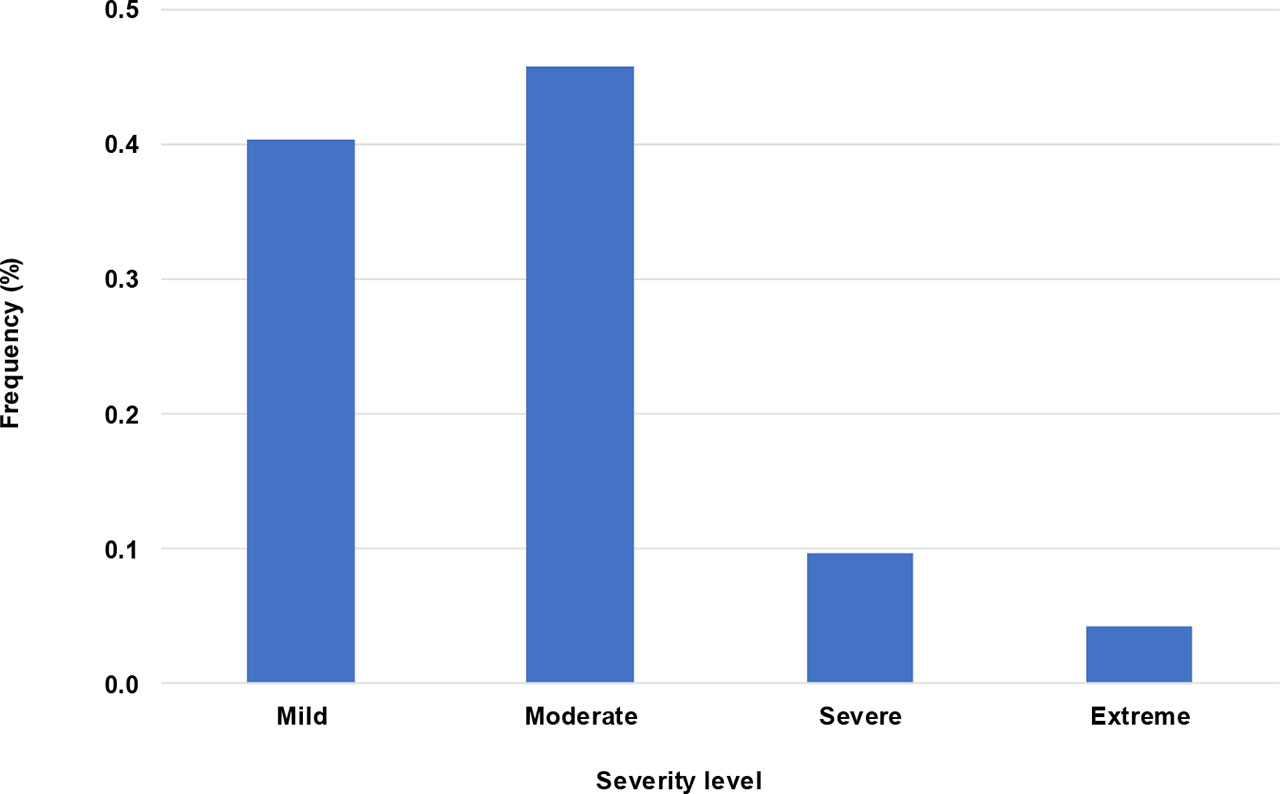
Figure 5:
The distribution of the severity levels for droughts in Jordan
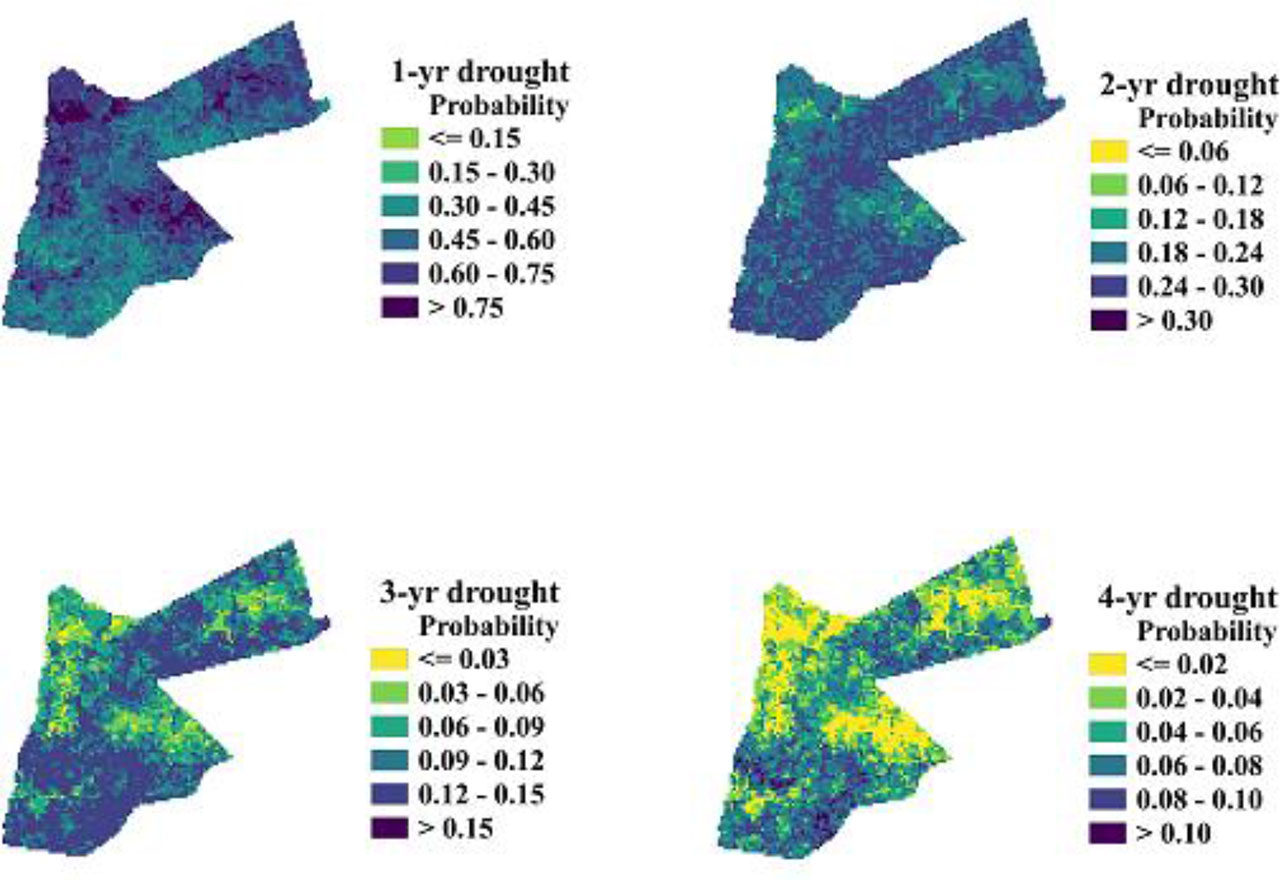
Figure 6:
Probability distribution of the drought duration for lengths 1 – 4 years
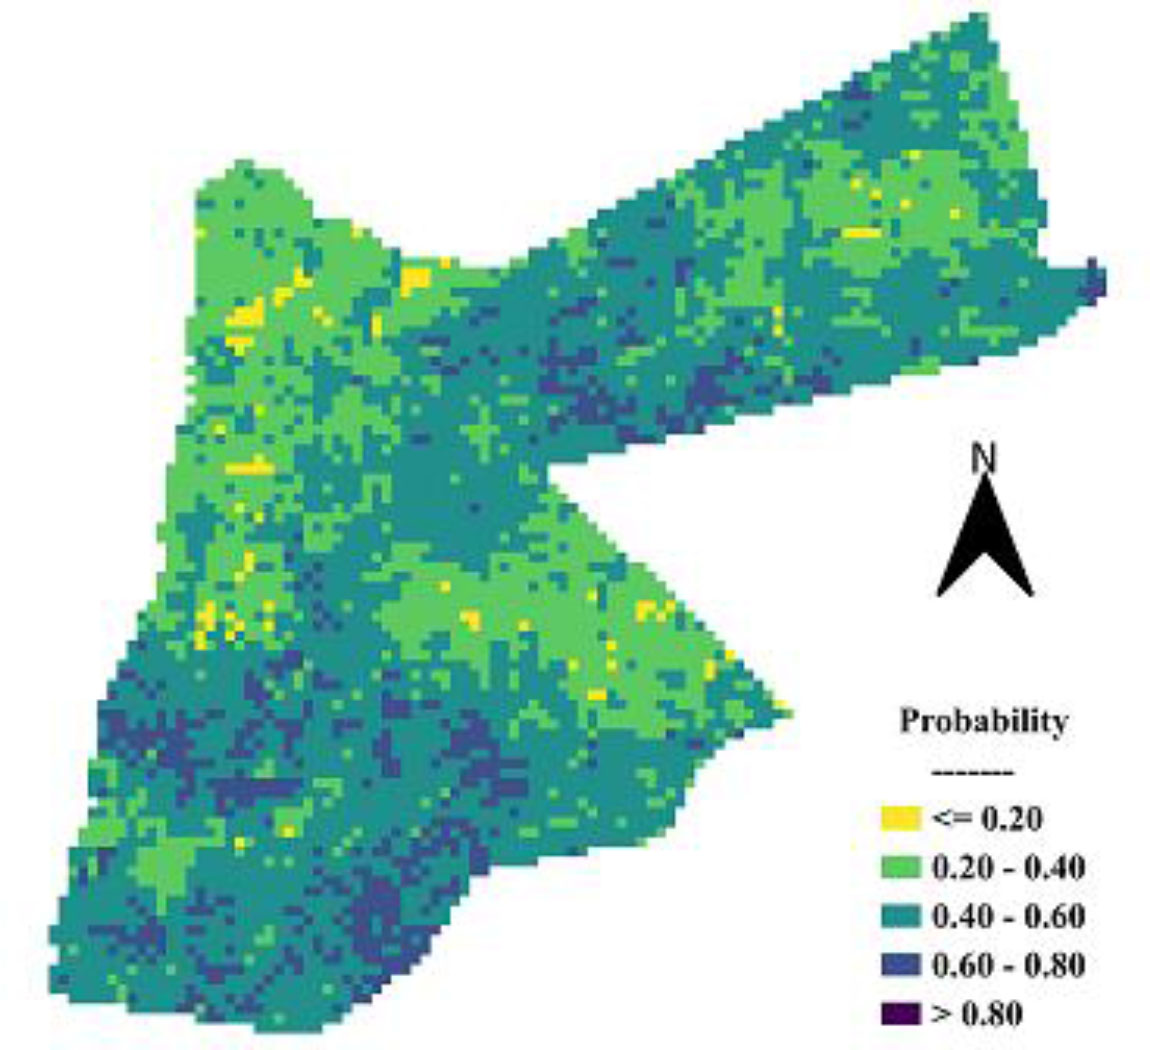
Figure 7:
The conditional probability (Pdd)