

1. Introduction
Jordan is one of the most water-scarce countries in the world (Odeh, 2019). The National Water Strategy report published by the Ministry of Water and Irrigation (MWI) indicates that in 2023, the per capita share of renewable fresh water is 61 m3/year, which is below the international water scarcity threshold of 1,000 m3/year (MWI, 2023). The combination of limited water resources, a large influx of refugees, population growth, and climate change exacerbates the growing water deficit in Jordan (Schyns et al., 2015; Hussein, 2018). The principal water source in Jordan is precipitation during the rainy season (Jaber et al., 1997). The remaining water, after evaporation, is stored as fresh water in surface reservoirs and contributes to the recharge of groundwater aquifers. Freshwater for all uses in Jordan is primarily supplied from groundwater and surface water sources (MWI, 2022). Although precipitation is the main source of freshwater, the country has recently experienced frequent and severe droughts, accompanied by rising temperatures, which aggravate water scarcity in Jordan (Mustafa and Rahman, 2018; Abdulla, 2020).
Drought is a complex natural phenomenon that evolves over time and space (Salas et al., 2015). Its complexity hinders the development of a universal definition and, therefore, impedes the identification of key characteristics, such as duration, severity, and spatial coverage (Hao and Singh, 2015). In general, drought can be classified into four main types: meteorological, agricultural, hydrological, and socioeconomic (Hao and Singh, 2015). Meteorological drought, which is related to a deficiency in precipitation over an extended period of time (Hao and Singh, 2015), is adopted in this study to detect drought in Jordan because once it is initiated, subsequent impacts on agriculture and hydrology follow (Zargar et al., 2011). In the literature, researchers have followed two main approaches to characterize drought: stochastic models and drought indices. Stochastic models have been used extensively to quantify drought severity, the distribution of drought duration, and the recurrence of drought events (Yevjevich, 1967; Shiau and Shen, 2001; Salas et al., 2005; Rajsekhar et al., 2015; Azam et al., 2018; Heidari et al., 2020; Fadhil and Unami, 2021). Drought indices are quantitative tools that integrate various meteorological and hydrological parameters, such as precipitation, temperature, evapotranspiration, and runoff, into a single numerical value that can be used to monitor drought (Zargar et al., 2011; Eslamian et al., 2017; Voon et al., 2022). In addition to detecting drought severity and identifying its onset and termination, some indices can be used operationally to monitor the spatial extent of drought using gridded maps at regional and national levels (Zargar et al., 2011). A comprehensive review of drought indices is available in the literature (Zargar et al., 2011; Eslamian et al., 2017). In Jordan, drought indices have been employed to examine drought occurrence and assess its severity in specific regions (Mohammad et al., 2018; Abu Hajar et al., 2019) as well as across the entire country (Al-Qinna et al., 2011; Mustafa and Rahman, 2018). These studies relied on observed data from ground-based gauging stations, which may lack adequate spatial coverage across the country. Furthermore, none of these studies have examined the temporal distribution of drought across regions (i.e., its persistence over consecutive years) using a probabilistic framework, nor have they discussed the tendency of drought to propagate as a function of region in Jordan.
While precipitation data from ground-based gauging stations are typically subject to several limitations, including poor spatial distribution, especially in developing countries (Nguyen et al., 2020; Alsalal et al., 2023), precipitation estimates derived from remotely sensed data (satellite-based products) have become increasingly popular due to their ability to provide a complete spatial coverage (Al-Sheriadeh and Al-Sharman, 2024). Satellite-based precipitation estimates are generated using algorithms that incorporate various input data from multiple satellite sensors measuring longwave infrared, visible, and passive microwave radiation (Nguyen et al., 2020). In the literature, several studies have examined the applicability of using satellite-based estimates for capturing the characteristics of observed precipitation. For example, Alsalal et al. (2023) evaluated the use of open-source climate products, namely Climate Hazards Group Infrared Precipitation (CHIRPS 0.05°) and the Climate Forecast System Reanalysis (CFSR), to capture precipitation patterns over the Mujib Basin in Jordan from 2002 to 2012. Their results indicated a strong correlation between these products and observed data on a monthly timescale. Al-Sheriadeh and Al-Sharman (2024) analysed the spatial and temporal patterns of two satellite precipitation products: Tropical Rainfall Measuring Mission (TRMM) and Precipitation Estimation from Remotely Sensed Information using Artificial Neural Networks - Climate Data Record (PERSIANN-CDR). The results showed that both products exhibited low accuracy in representing the observed precipitation at a daily timescale, while performing well at a monthly timescale. At the annual scale, Nguyen et al. (2020) evaluated the performance of the Dynamic Infrared Rain rate model (PDIR) over the western contiguous United States. Their findings demonstrated promising performance compared to other satellite-based products. PDIR precipitation estimates were found to accurately reproduce the spatial patterns of observed precipitation over the study region. Eini et al. (2022) assessed the performance of the PERSIANN family products, including PDIR estimates, and demonstrated their ability to accurately detect precipitation events in the Wełna catchment in Poland based on three categorial performance indicators.
This study uses PDIR-Now precipitation estimates as input to characterize drought severity, as well as its temporal patterns and spatial evolution across Jordan. Drought severity is identified using the Modified Percent Departure from Normal rainfall (PDNm) drought index. The temporal and spatial distribution of drought in Jordan is derived from processed PDIR digital layers using the open-source QGIS (version 3.34.2). This study is significant because it represents the first effort in Jordan to employ satellite-derived products to analyse the temporal evolution of drought across multiple regions using a probabilistic framework. Furthermore, it introduces a generic procedure that can be applied to identify drought in any region worldwide. The findings provide valuable insights for water resource management and drought mitigation strategies in both northern and southern Jordan.
2. Methodology
2.1. Study Area
With an area of about 90 km2, Jordan is situated between latitudes 29° 11′N to 33° 22′N and longitudes 34° 59′E to 39° 18′E. The country is generally divided into three major physiographic districts that are: the highlands, the Jordan Rift Valley, and the desert plains (Mustafa and Rahman, 2018). The highlands, located as a strip along the western part of the country (Figure 1), receive significant precipitation, ranging from 350mm in the central region to 600mm in the northwest. The average temperature in the highlands ranges from 14 to 18 °C (Al-Addous et al., 2023). The Jordan Rift Valley, located west of the highlands, receives low precipitation and has an annual mean temperature ranging from 22 to 25 °C (Mustafa and Rahman, 2018). The desert region, an extension of the Middle Eastern desert, occupies about 90% of the total area of Jordan and extends across the northeastern and southern regions of the country (Figure 1). It generally receives less than 50mm of precipitation annually (Al-Sheriadeh and Al-Sharman, 2024). In general, the climate of Jordan is characterized by hot dry summers and wet cold winters, with all precipitation occurring between October to April (Al-Addous et al., 2023).
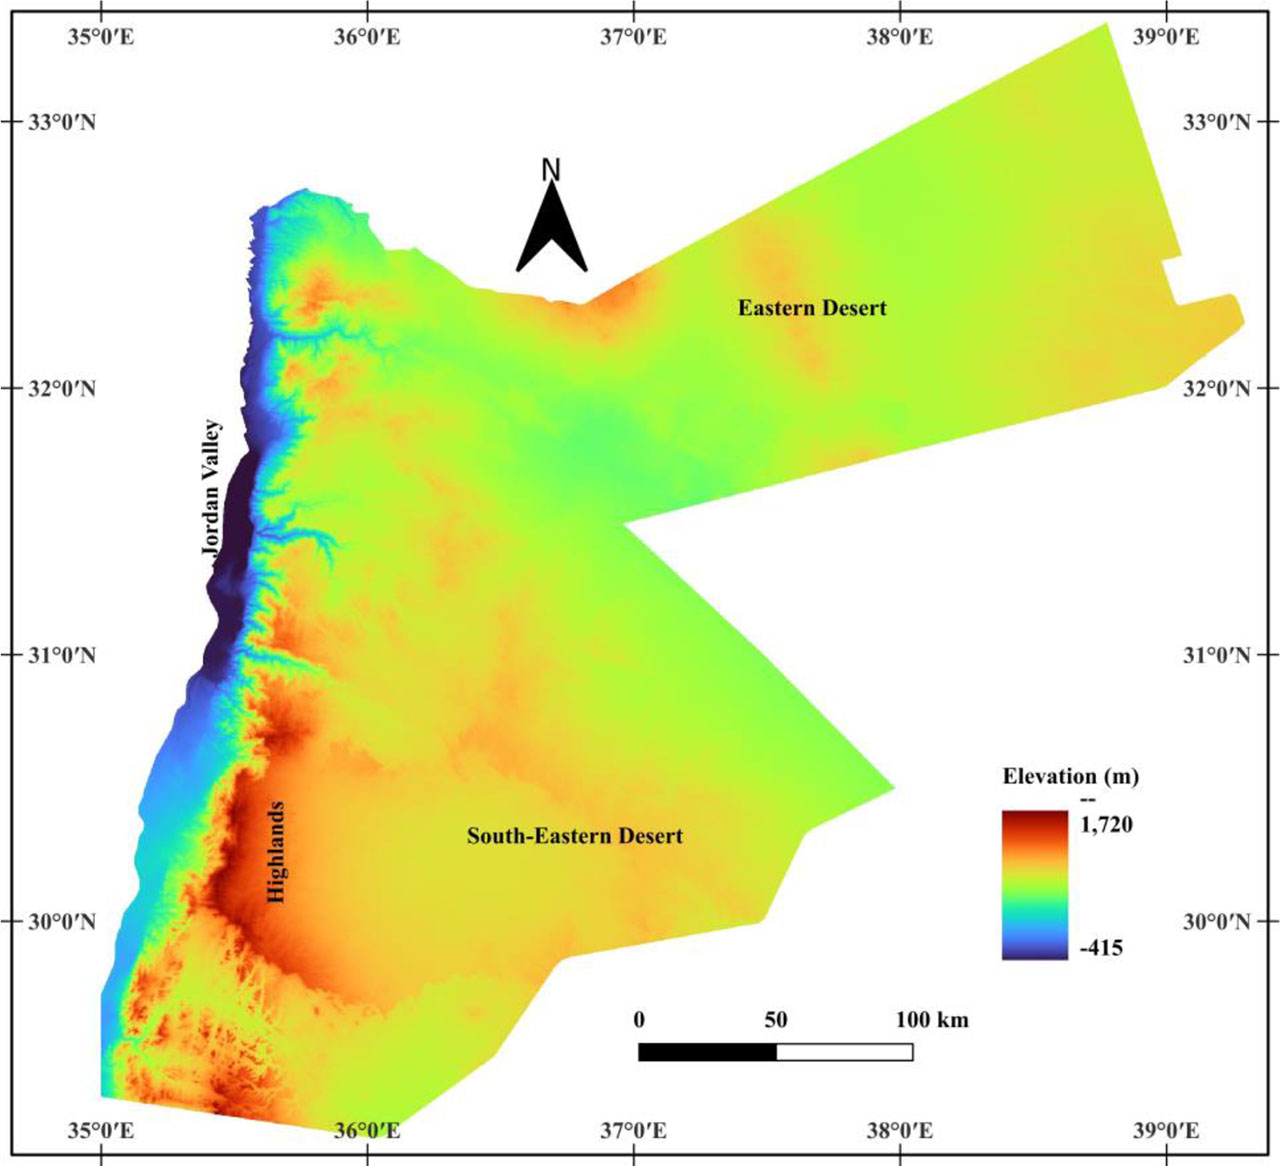
Figure 1:
Major physiographic districts in Jordan
2.2. Materials and Procedures
Relying on high-frequency sampled Infrared (IR) imagery, PDIR-Now is a global, real-time, high-resolution (0.04° × 0.04°) satellite-based precipitation estimate developed by the Centre for Hydrometeorology and Remote Sensing (CHRS) at the University of California, Irvine. As an open-source product, PDIR-Now precipitation estimates can be downloaded from the CHRS data portal (https://chrsdata.eng.uci.edu/). In brief, PDIR products exclusively use longwave (10.7μm) IR imagery from geosynchronous-Earth-orbiting satellites (GEOs), which provide information on the brightness temperature (Tb) of cloud tops. The brightness temperature detected by satellite sensors is linked to the rain rate (RR) using the Artificial Neural Network model known as the Precipitation Estimation from Remotely Sensed Information Using Artificial Neural Networks (PERSIANN) Dynamic Infrared–Rain Rate (PDIR) model. The relationship between Tb and RR in the dynamic model was calibrated using precipitation datasets from several sources, including the Climate Prediction Centre and National Oceanic and Atmospheric Administration. Due to challenges in detecting extreme precipitation events, the parent Artificial Neural Network model was modified to address errors arising from IR imagery. It was significantly improved by introducing a dynamic shift in the Tb – RR curves at each pixel according to its relative wetness (climatology), allowing the PDIR-Now model to accurately detect precipitation in both dry and wet conditions. Rainfall climatology data from the WorldClim version 2 were used to calibrate the dynamic curve-shifting mechanism in the PDIR-Now model. A complete description of the development of PDIR products can be found in Nguyen et al. (2020). The short latency of the PDIR-Now (15min to 1hr) makes its precipitation estimates highly suitable for near-real-time hydrological studies, such as flood prediction and flood map generation (Nguyen et al., 2020).
Monthly PDIR-Now precipitation digital layers for Jordan from October 2000 to May 2023 were downloaded from the CHRS data portal. The raster calculator in QGIS was used to aggregate monthly precipitation from October in a given year to April in the following year, thereby extracting rainy season precipitation for the period from 2001/2002 to 2022/2023. The rainy season in Jordan typically extends from October to April (Al-Bakri and Suleiman, 2004; Alsalal et al., 2023). At each pixel in the rainy season digital layer, the severity of drought is expressed in terms of the PDNm (percent deviation from normal) as follow:
Where:Pe - the season precipitation at a particular pixel,
Pav - the long-term mean precipitation for that pixel.
The main reason for using the PDNm index to evaluate drought severity is its simplicity and effectiveness in detecting the occurrence of dry and wet conditions over a specified area and time period (Zargar et al., 2011; Wable et al., 2019). It efficiently quantifies the actual deviation of precipitation from normal conditions and, therefore, enables accurate assessment of meteorological drought severity (Bandyopadhyay et al., 2016). According to Bandyopadhyay et al. (2016), the modified drought severity levels are assigned based on deviations from normal rainfall (PDNm ranges) as shown in Table 1.
Table 1:
Assigned PDNm ranges for modified drought severity levels
| Severity level | PDNm (%) |
|---|---|
| No drought | Above −10 |
| Mild | −10 to −25 |
| Moderate | −25 to −50 |
| Severe | −50 to −60 |
| Extreme | Below −60 |
For the temporal assessment of drought, the distribution of the drought length (l) at each pixel is computed as:
Where:Pdw - the transition probability of observing wet state at the time t given that dry state has occurred at the time t – 1.
Here, the sequence of wet and dry states at each pixel is assumed to follow a stationary simple Markov process.
3. Results and Discussion
3.1. Validity of PDIR Precipitation Estimates
As mentioned previously, the raster calculator in the QGIS was used to derive rainy season precipitation from the monthly PDIR estimates for drought monitoring. To examine how rainy season precipitation is spatially distributed across the country, the average rainy season precipitation for the 2000/2001 – 2022/2023 rainy seasons was computed at each pixel. Figure 2 displays the spatial distribution of annual precipitation in Jordan. In general, Figure 2 shows a large variation in precipitation between the northern regions (350mm – more than 450mm) and the southern regions of Jordan (less than 200mm), which is generally consistent with the isohyets reported in previous studies (Tarawneh and Kadioglu, 2003; Al-Bakri and Suleiman, 2004; Freiwan and Kadioglu, 2008; Mustafa and Rahman, 2018).
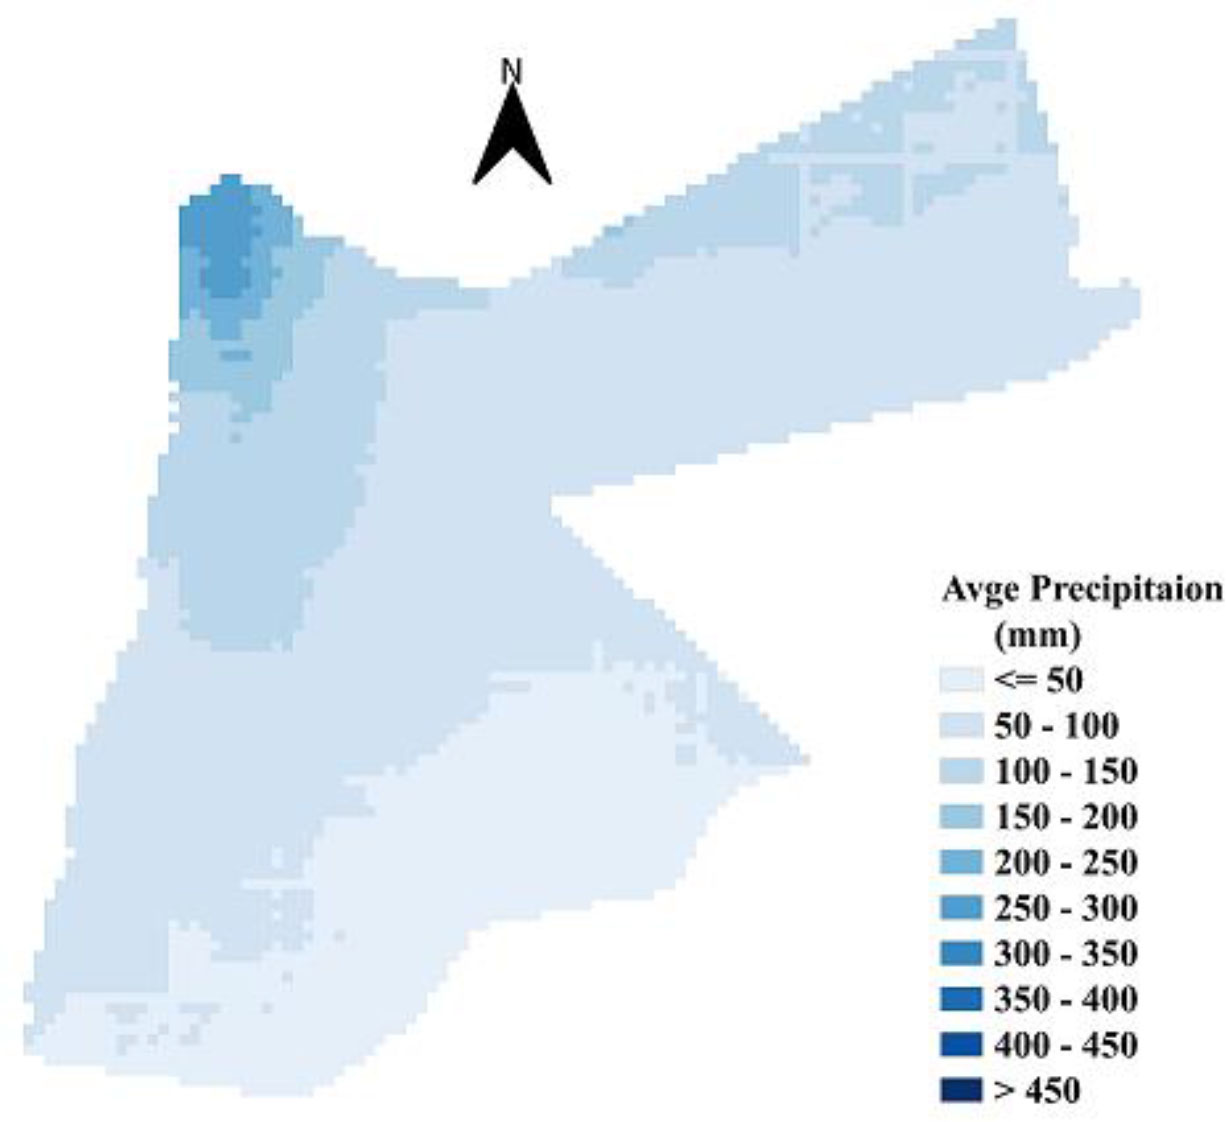
Figure 2:
Spatial distribution of PDIR precipitation over Jordan
The primary reason for this large variation is the discrepancy in exposure to westerly frontal depressions, mainly the Cyprus Low, which brings most of the precipitation to Jordan, especially during winter. Due to their location near the track of the westerly Mediterranean Sea moist air currents, the northern regions, particularly northwestern of Jordan, regularly receive high precipitation amounts. In contrast, the southern regions are less affected by westerly frontal depressions due their distant location and are mostly influenced by dry air from the Sinai desert, resulting in lower precipitation amounts. If the main flow is north westerly, both regions typically receive high precipitation amounts. Overall, the precipitation pattern and amounts shown in Figure 2 are consistent with the country’s precipitation isohyets. In addition to investigating the spatial pattern described above, Figure 3 shows the temporal variation in the annual average areal precipitation (i.e., the per year country average) for the observed and PDIR estimates over the 2000/2001 – 2018/2019 seasons. In Figure 3, the observed precipitation data were obtained from an annual report published by the Ministry of Water and Irrigation (MWI, 2022), whereas the annual average areal PDIR estimates were calculated in QGIS as the countrywide average derived from the downloaded PDIR digital layers. In general, visual inspection of the precipitation data in Figure 3 indicates that the PDIR estimates capture the rising and falling pattern of the annual areal precipitation derived from the observed data. To assess the strength of the relationship between the PDIR average areal precipitation and the observed average areal precipitation presented in Figure 3, the Pearson correlation coefficient (r) was computed and found to be 0.69, indicating a strong positive relationship (Ratner, 2009). In conclusion, both the visual inspection and the correlation result suggest that the use of PDIR precipitation estimates as a representation of the observed data is justified. Furthermore, a t – test was employed to statistically examine the consistency between the observed and estimated precipitation, and the result shows no significant difference at the 0.05 significance level (p value = 0.18). In summary, due to their ability to preserve both the spatial and temporal patterns of observed precipitation, PDIR estimates appear to be reliable and can be used to characterize drought in Jordan.
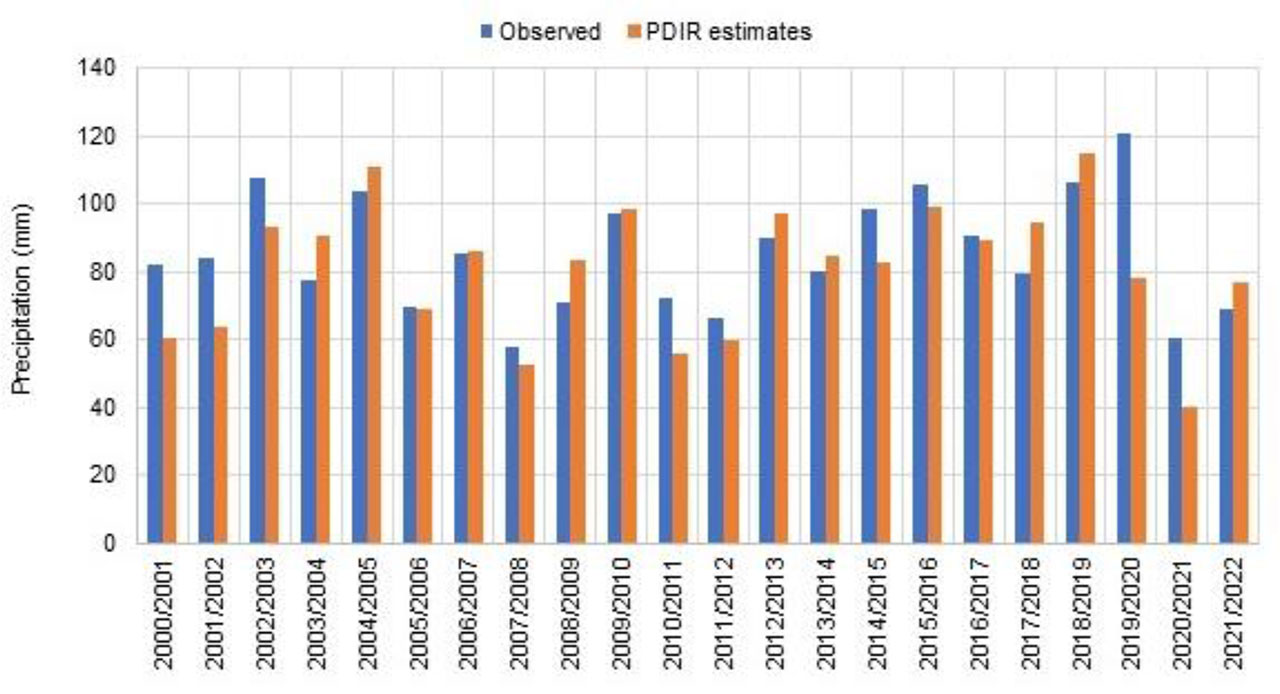
Figure 3:
Temporal variations of the observed and PDIR precipitation estimates
3.2. Evaluating the Severity of Drought
The index PDNm was employed to capture drought severity levels in Jordan. For each study season (2000/2001– 2022/2023), QGIS was used to calculate PDNm values for each pixel (4 km × 4 km) using Equation (1), and the results were displayed spatially, as shown in Figure 4. According to PDNm ranges (Table 1) several drought events were identified across the country, namely those occurring in 2000/2001, 2001/2002, 2005/2006, 2007/2008, 2010/2011, 2011/2012, 2014/2015, 2019/2020, 2020/2021, and 2022/2023 (Figure 4). During the 2014/2015 season, drought conditions were observed mainly in southern Jordan rather than across the rest of the country. Across the entire country, the 2007/2008, 2010/2011 and 2020/2021 seasons were the most severe in terms of areal coverage and, to some extent, drought intensity. For the period 2001 – 2017, both this study and Mustafa and Rahman (2018) reported the occurrence of the same drought events; however, the present study extends the analysis beyond 2017 and is distinguished by its temporal assessment through probability analysis. Furthermore, this study investigates the tendency of drought to propagate across different zones in Jordan, namely the northern and southern regions, where most surface water storage facilities are located.
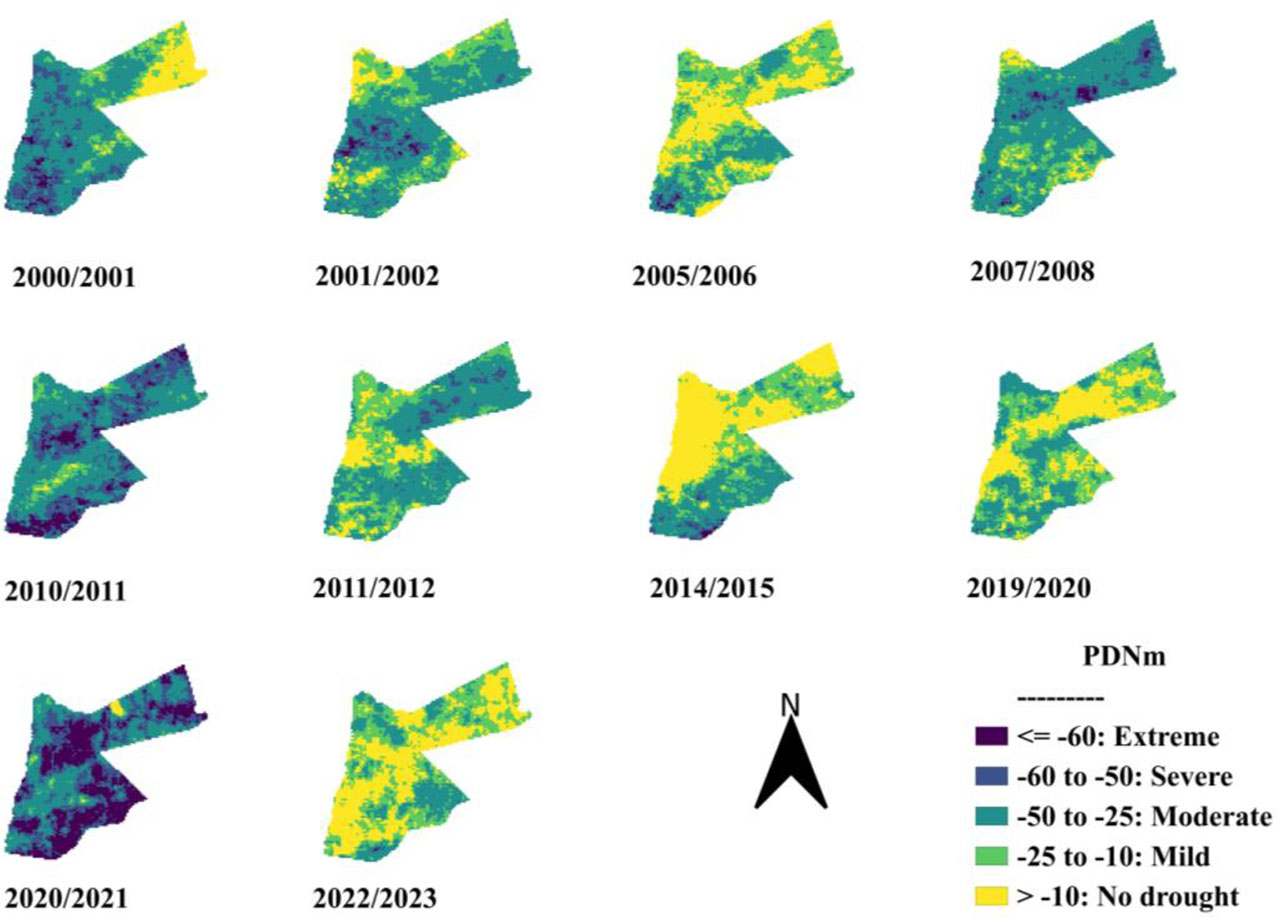
Figure 4:
Detected droughts in Jordan and their severity levels
To assess drought severity, the frequency distribution of severity levels (mild, moderate, severe, and extreme) was extracted from the PDNm digital layers, and the results are presented in Figure 5. The Figure clearly shows that the severity of most droughts in Jordan fall within mild to moderate range, with moderate drought being the most common. This finding aligns with the results of a previous study covering the period 1970 – 2005 (Al-Qinna et al., 2011). However, the present study extends the analysis beyond 2005 and further examines the temporal pattern of national droughts in terms of probability statements.
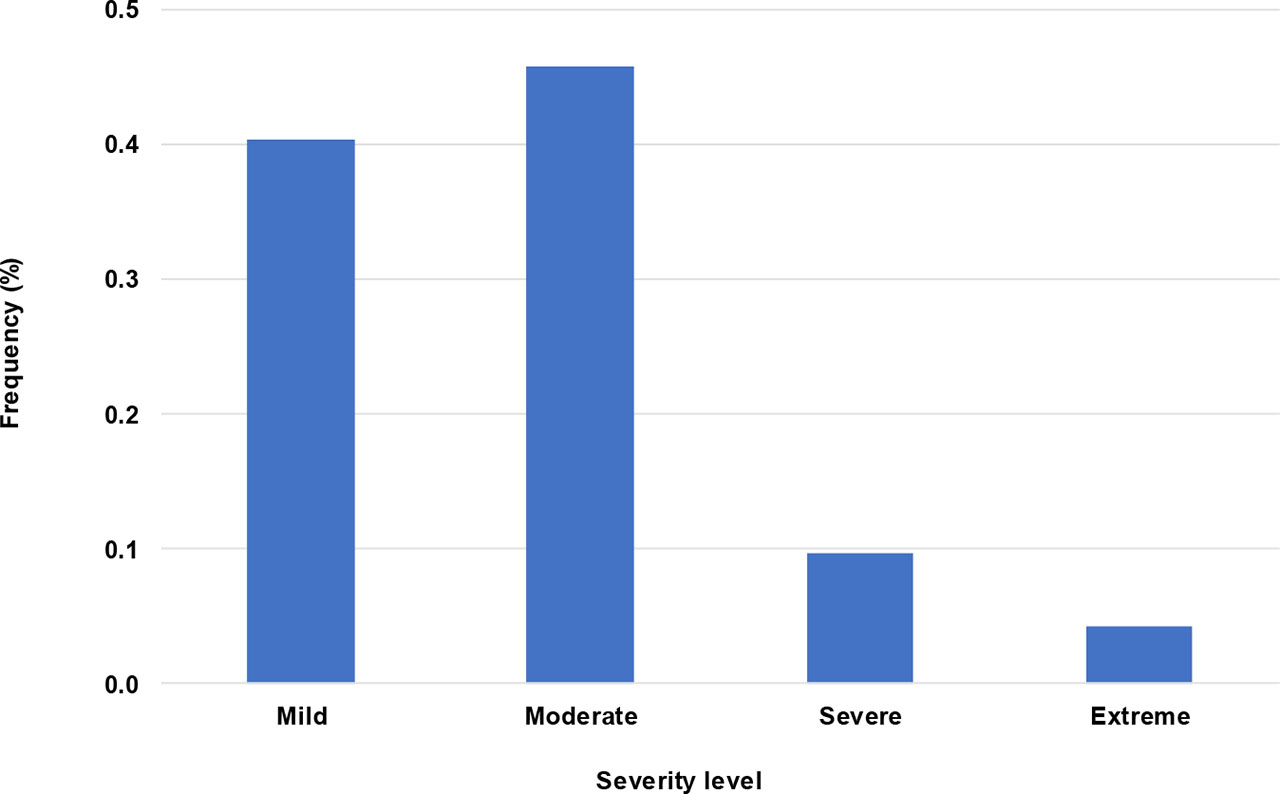
Figure 5:
The distribution of the severity levels for droughts in Jordan
The reason that most droughts in Jordan fall within the mild to moderate severity range is likely attributable to their short duration (mostly less than 2 years), which limits the time available for severity to escalate to extreme levels. In other words, the limited duration prevents mild and moderate droughts from intensifying further. Drought severity is generally strongly associated with drought duration (Shiau and Shen, 2001; Salas et al., 2005). Several previous studies have reported that droughts in Jordan commonly last 1–2 years (Tarawneh and Hadadin, 2009; Mustafa and Rahman, 2018). The distribution of drought duration in Jordan is investigated in detail in the next subsection.
3.3. Drought Temporal Patterns Versus Regions
According to the previously mentioned studies and at the national scale, Jordan is typically subjected to droughts of short duration (1 – 2 years). In this context, the temporal extent of drought is further investigated and expressed in terms of the drought length distribution, i.e., the probability of experiencing a drought of length 1, 2, ..., l years. Following the procedure described by Fernandez and Salas (1999), the raster calculator in QGIS was used to estimate the state transition probability (Pdw) at each pixel in all PDIR precipitation digital layers for 2000/2001 – 2022/2023 seasons. For drought lengths 1 – 4 years, Equation (2) was used to compute the probability distribution of drought length, and the results are shown in Figure 6.
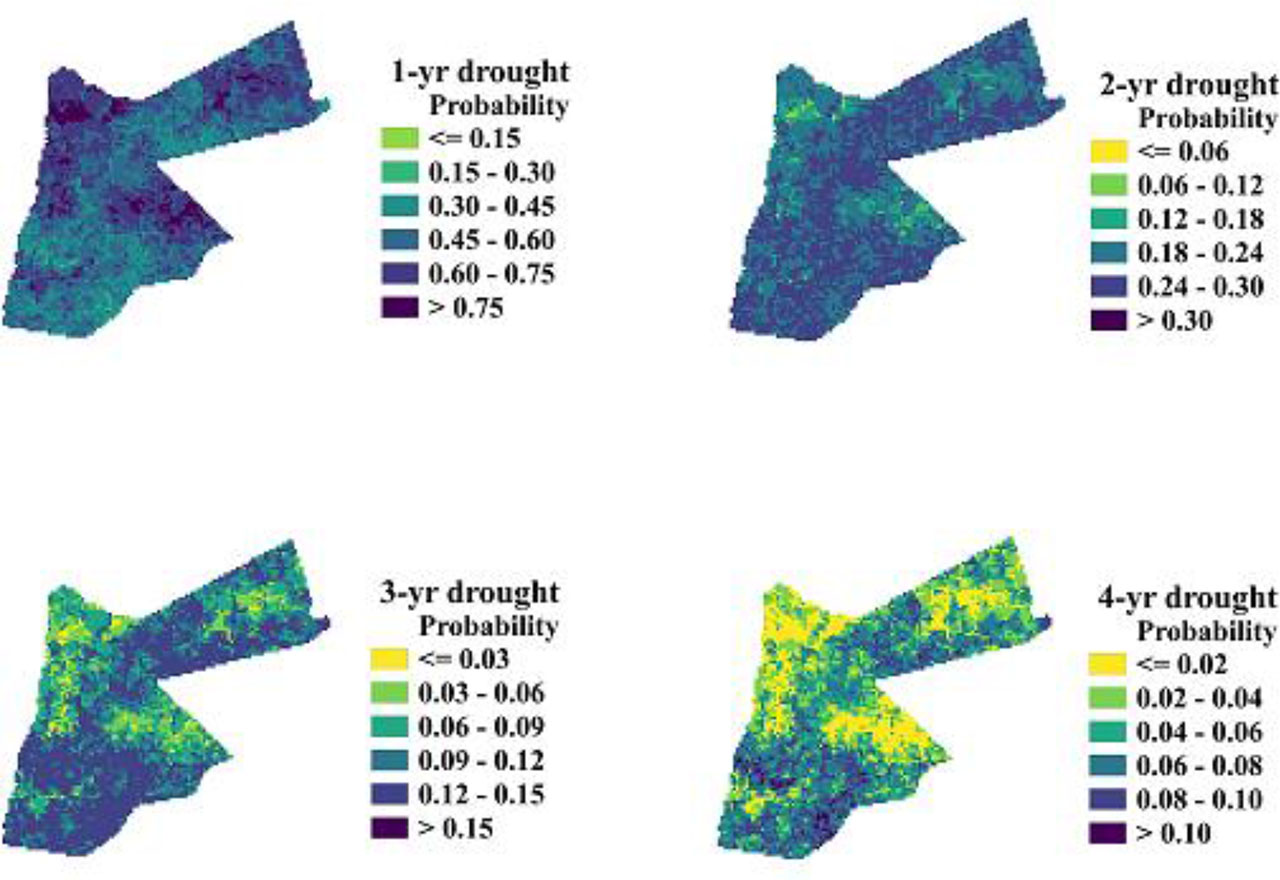
Figure 6:
Probability distribution of the drought duration for lengths 1 – 4 years
In general, Figure 6 clearly shows that as drought duration increases, the probability of occurrence decreases, indicating a geometric decay in probability with increasing drought length. This is a well-established conclusion in drought studies (Shiau and Shen, 2001; Salas et al., 2005). Regardless of severity level, droughts lasting 3 – 4 years in Jordan are relatively rare, with computed occurrence probability ranging from 0.03 – 0.15 for 3-year droughts and 0.02 – 0.1 for 4-year droughts. In contrast, drought events of 1 – 2 years are more frequent, with probability varying between 0.15 – 0.75 for 1-year droughts and 0.06 – 0.3 for 2-year droughts. Furthermore, it is evident that the 1-year droughts are more common in northern Jordan compared to the south, whereas 2-year or longer, especially 2-year events, are more likely to occur more in southern Jordan. In other words, Figure 6 indicates that while 2-year droughts are likely to occur in the south, the 1-year droughts are characteristic of the northern region. Conversely, in the south, although one-year droughts can occur, there is a higher tendency for droughts to extend beyond one year. This tendency for droughts to persist into a subsequent year can be quantified by computing the state conditional probability (Pdd), which represents the probability of observing a dry year given that the previous year was also dry. The probability Pdd was calculated for each pixel, and the results are displayed in Figure 7.
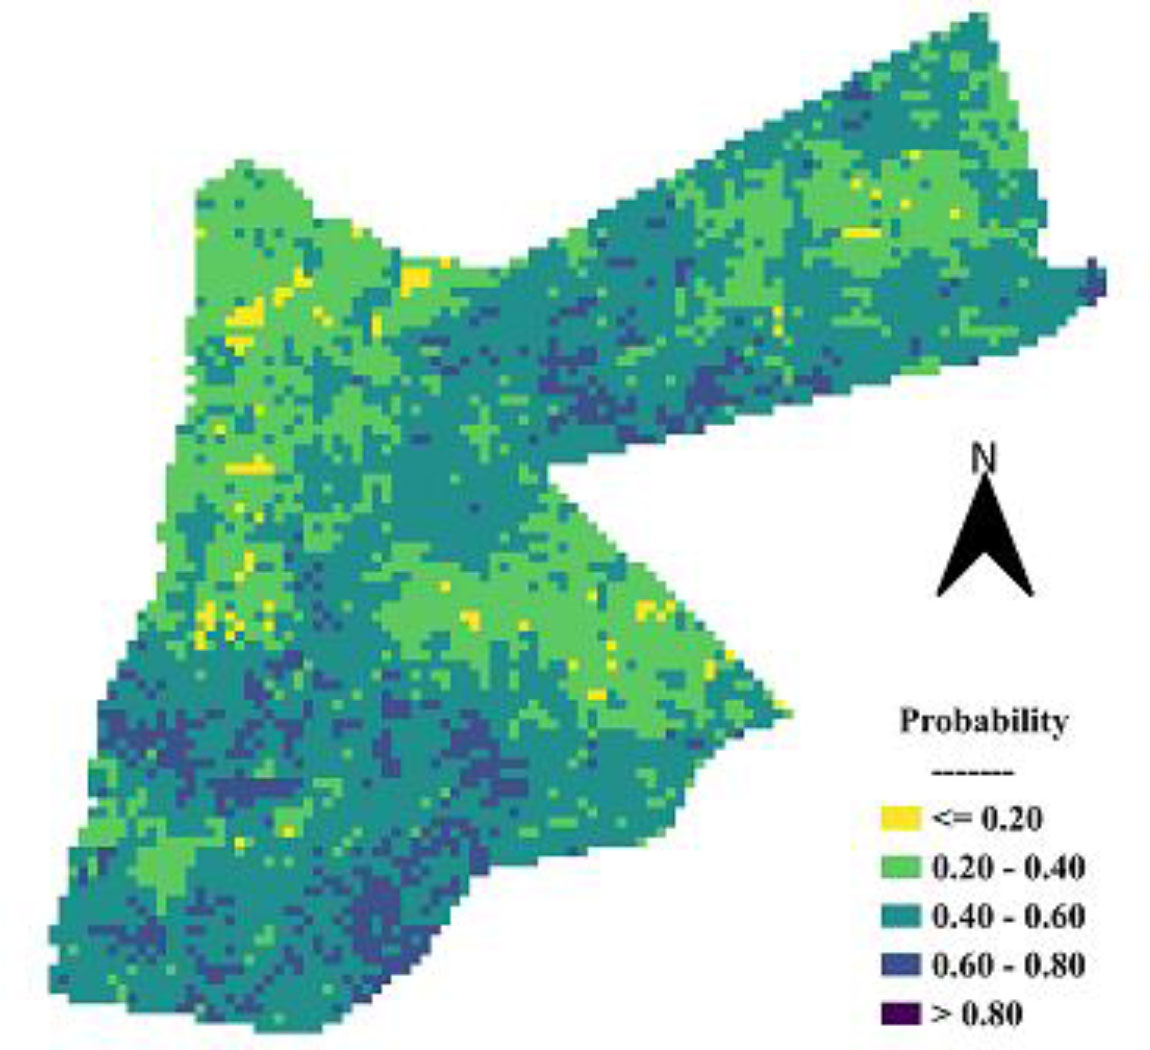
Figure 7:
The conditional probability (Pdd)
Figure 7 clearly shows that the likelihood of drought extending into the following year is higher in the southern part of Jordan (Pdd values between 0.4 and 0.8), while it is lower in the northern part (0.2 to 0.4). This supports the earlier finding that 1-year droughts are characteristic of the northern region, whereas in the south, a single dry year is more likely to persist over a longer period. This temporal drought pattern in Jordan can be explained by the region's location relative to the track of the westerly moist air current over the eastern Mediterranean (the Cyprus low), which typically brings high precipitation to areas along or near its path. This frontal depression produces relatively stable, successive precipitation events during winter, which are especially pronounced in northern Jordan due to its proximity to the depression's track. In contrast, the southern region, being farther from the track of the westerly frontal depression, is less likely to receive precipitation near or above normal levels, resulting in successive periods of low precipitation.
3.4. Notes on Drought Mitigation in Jordan: Current Practices and Future Perspectives
While most of Jordan’s water supply for various uses depends on groundwater aquifers and surface storage, drought occurrence significantly reduces availability and negatively impacts end users. Current practices in Jordan aim to narrow the gap between supply and demand through the construction of new rainwater harvesting systems, reducing losses in existed water transport networks, and implementing water management plans, all of which help mitigate the effects of drought. Besides retaining freshwater for direct use, rainwater harvesting projects also mitigate flood risk in areas with steep topography (Masdaf et al., 2025). Based on the findings of this study, it is recommended to consider a single-year drought and a two-consecutive-year drought for future reservoir sizing and water release plans in northern and southern Jordan, respectively. In 2020, water losses from the public network were approximately 50% (Al-Addous et al., 2023), which is extremely high for a water-stressed country such as Jordan. Current efforts focus on replacing deteriorated parts of the public network with new systems and controlling illegal connections, aiming to reduce losses to about 20% by 2040 (MWI, 2023). Existing water management plans rely primarily on reallocating water between sectors, for example, from agriculture to high-priority municipal use (MWI, 2022).
In general, the current approaches to drought management mentioned above are reactive, treating drought as a crisis that is addressed only after it occurs. Moreover, existing drought response actions in Jordan are often poorly planned and lack coordination among stakeholders (MWI, 2023). It is recommended to adopt a comprehensive mitigation strategy that employs integrated water management to reduce the impacts of drought. Legislation should be revised to classify drought as a disaster requiring proactive and preventive measures and should clearly define the responsibilities of the various institutions involved in drought management. Additionally, establishing a drought early warning and forecasting system is essential for effective drought risk management. The rapid implementation of the new seawater desalination plant in Aqaba, with a projected capacity of approximately 300 million m3/year, along with the expansion of wastewater treatment practices, will further strengthen efforts to mitigate the effects of drought across different water-use sectors, including domestic and agricultural.
4. Conclusions
This study concludes that PDIR estimates effectively represent the spatial and temporal distribution of rainy season precipitation in Jordan and, therefore, can be used to analyse drought over time and space. The analysis of the PDNm digital layers reveals that droughts of mild and moderate severity are the most common in Jordan. Furthermore, the study finds that short-duration droughts, typically lasting 1 to 2 years, are the dominant events, while droughts lasting more than 2 years are rare. Such short durations likely prevent mild and moderate droughts from escalating to extreme levels. While 1-year droughts are characteristic of the northern region of Jordan due to its proximity to the path of the westerly moist air currents, the southern region, being farther from this path, is more likely to experience droughts lasting 1 – 2 years. In conclusion, the likelihood of drought extension into the following year was found to be high in the south and low in the north. The findings of this study are expected to contribute to updating reservoir sizing design codes according to regional conditions in Jordan. Furthermore, updates to water release strategies are needed to address varying drought durations across the country. Overall, this study presents simple and generic procedures that can be applied to characterize drought in any region.