

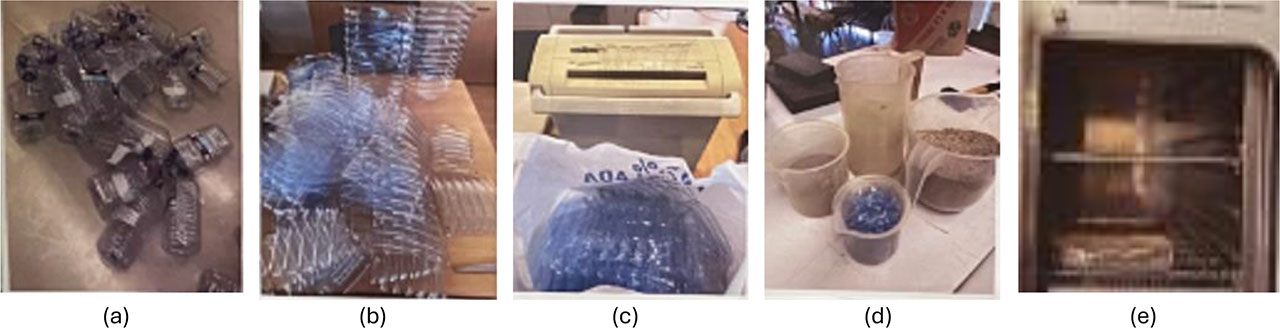
Figure 1:
Specimen preparation process: (a) raw PET bottles; (b) slicing into sheets; (c) shredded rPET fibers; (d) mixture materials (cement, sand, water, and PET fibers); and (e) oven. (Author’s own work)
Table 1:
Mix proportions of PET-reinforced mortars (21 prismatic specimens, 40 × 40 × 160 mm)
| Mix ID | Cement [kg) | Sand [kg] | rPET fibers[kg] | Water [kg] | Total mass [kg] | Total volumen [m3] | Estimated compressive strength [MPa] | Estimated flexural strength [MPa] |
|---|---|---|---|---|---|---|---|---|
| PET-10 | 3.76 | 5.16 | 0.34 | 0.597 | 9.86 | 0.005376 | 38–42 | 6–7 |
| PET-20 | 3.76 | 4.59 | 0.68 | 0.597 | 9.63 | 0.005376 | 30–35 | 5–6 |
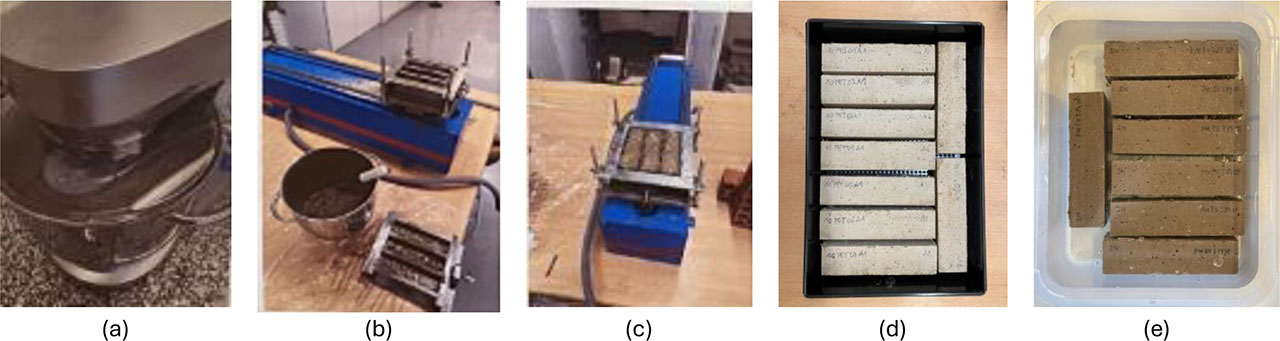
Figure 2:
Manufacturing and curing process: (a) Orbegozo mechanical mixer; (b) CE211 automatic cement compactor; (c) triple molds with fresh mix; (d) test specimens in a curing chamber at ambient temperature; (e) test specimens submerged in water (Own elaboration)
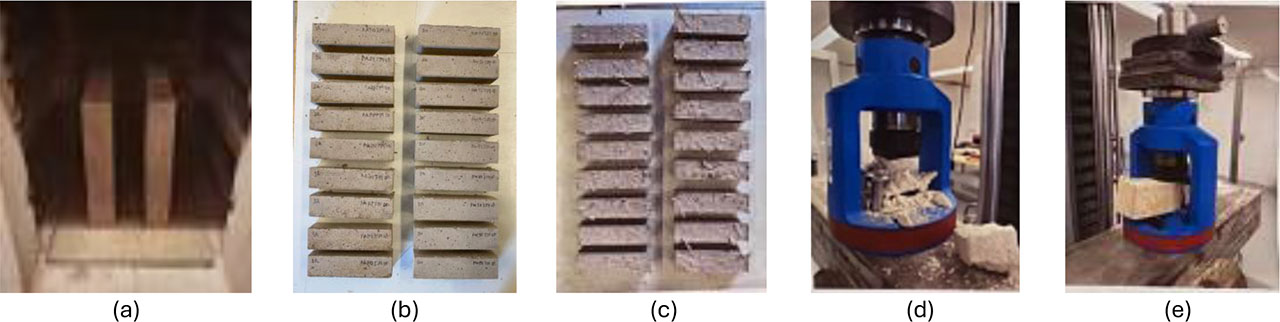
Figure 3:
Testing process: (a) test specimens inside the Nabertherm chamber furnace; (b) control specimens without heat treatment; (c) samples after exposure to high temperatures; (d) compression strength test; (e) flexural strength test (Own elaboration)
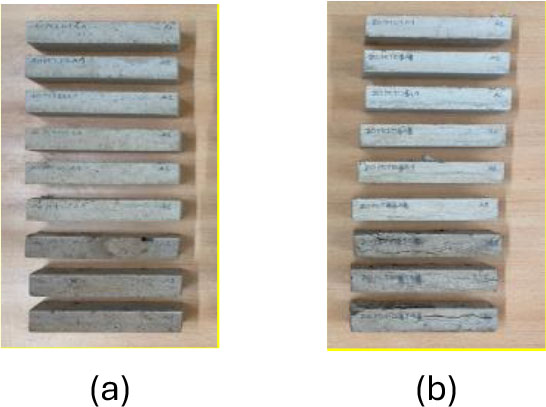
Figure 4:
Specimens with 10% rPET before mechanical testing: (a) cured underwater; (b) cured at room temperature in a curing chamber (Own elaboration)
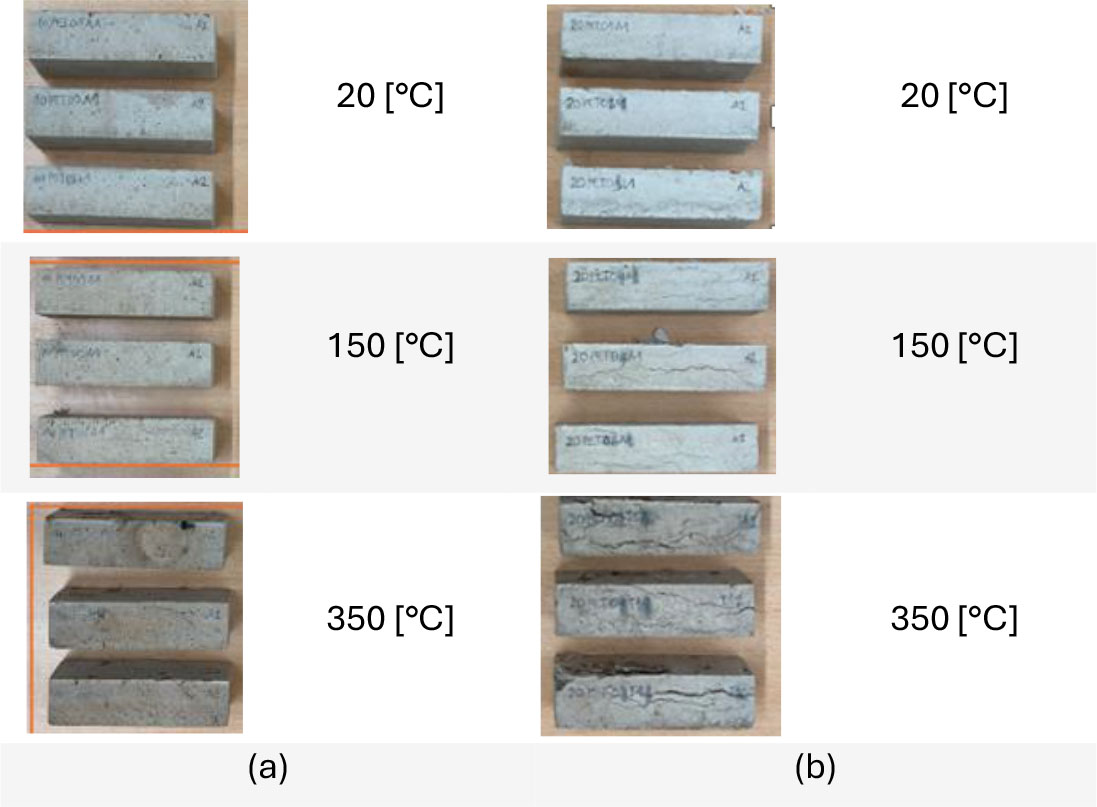
Figure 5:
Specimens cured at room temperature after exposure to different thermal steps: (a) 10% rPET; (b) 20% rPET
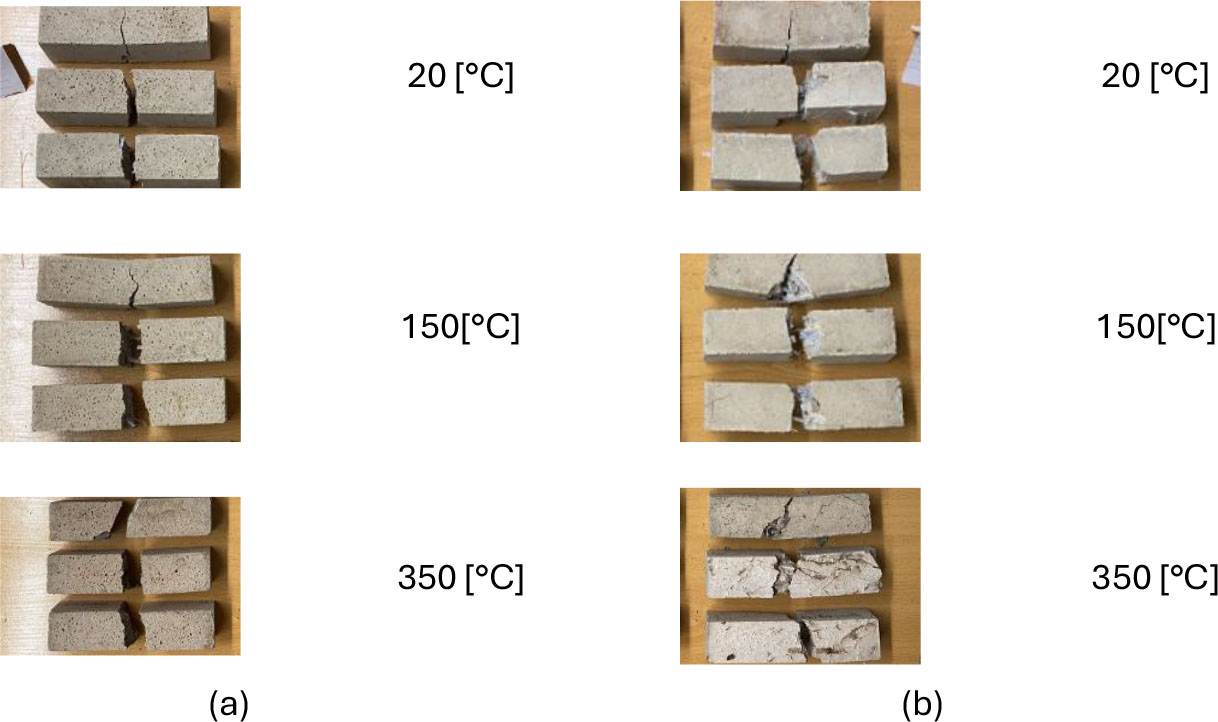
Figure 6:
Specimens cured at room temperature after being subjected to different thermal steps (20°C, 150°C and 350°C) and brought to flexural failure: (a) 10% rPET, (b) 20% rPET. (Own elaboration)
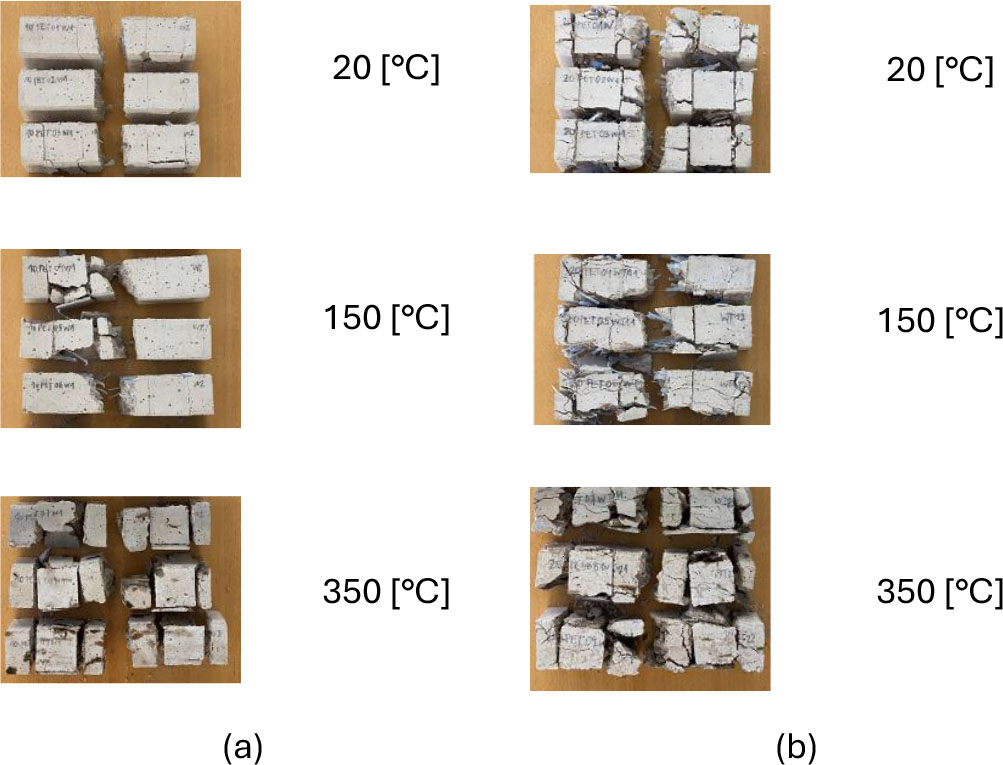
Figure 7:
Cured specimens immersed in water after completing flexural and compression tests: (a) 10% rPET; (b) 20% rPET (Own elaboration)
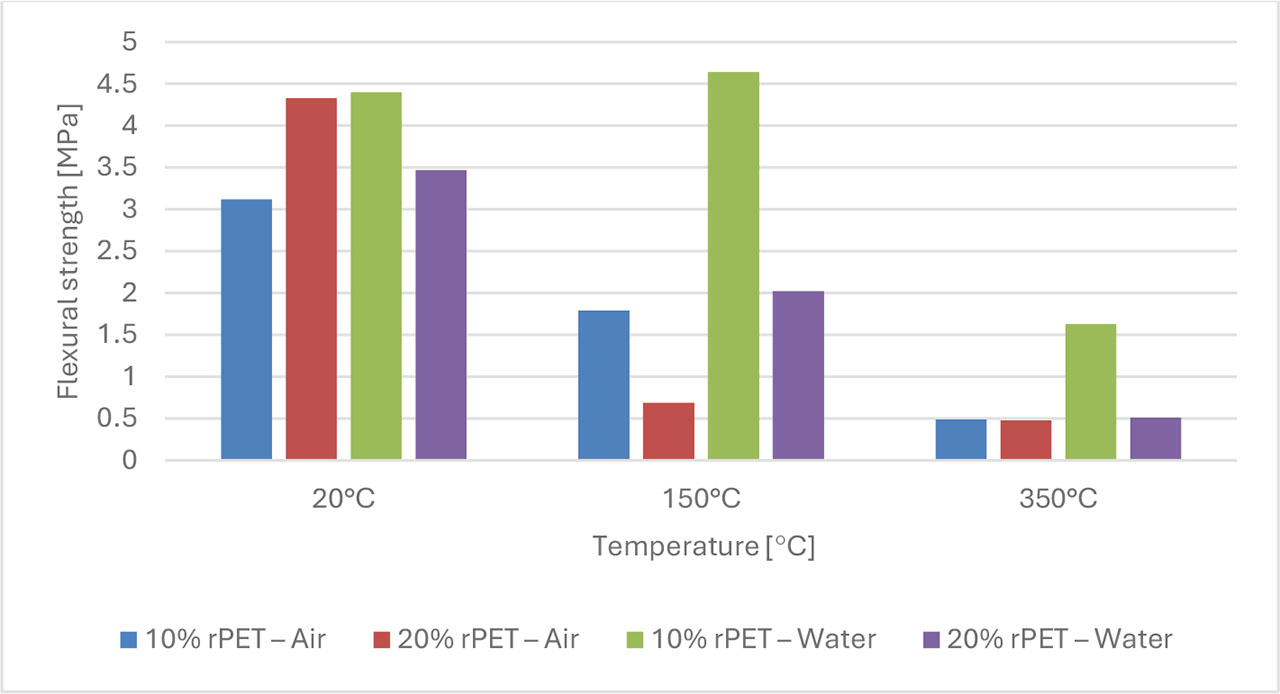
Figure 8:
Comparison of the effect of rPET content on flexural strength
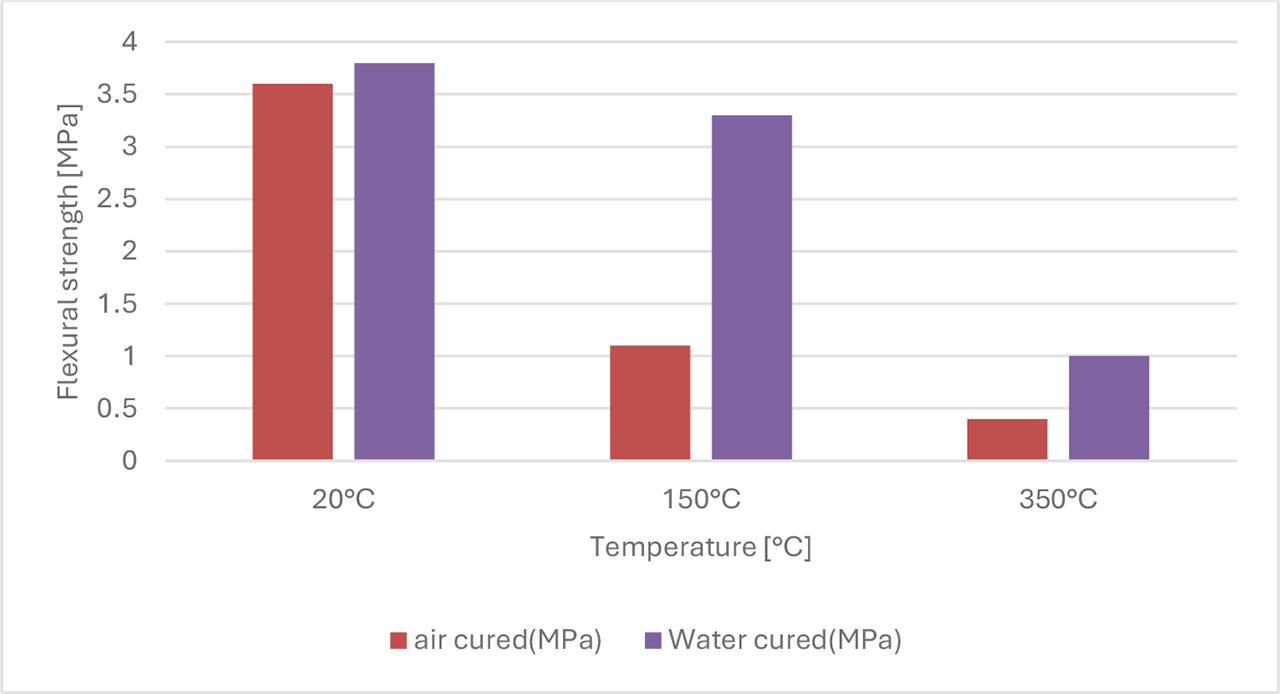
Figure 9:
Effect of Curing on Flexural Test
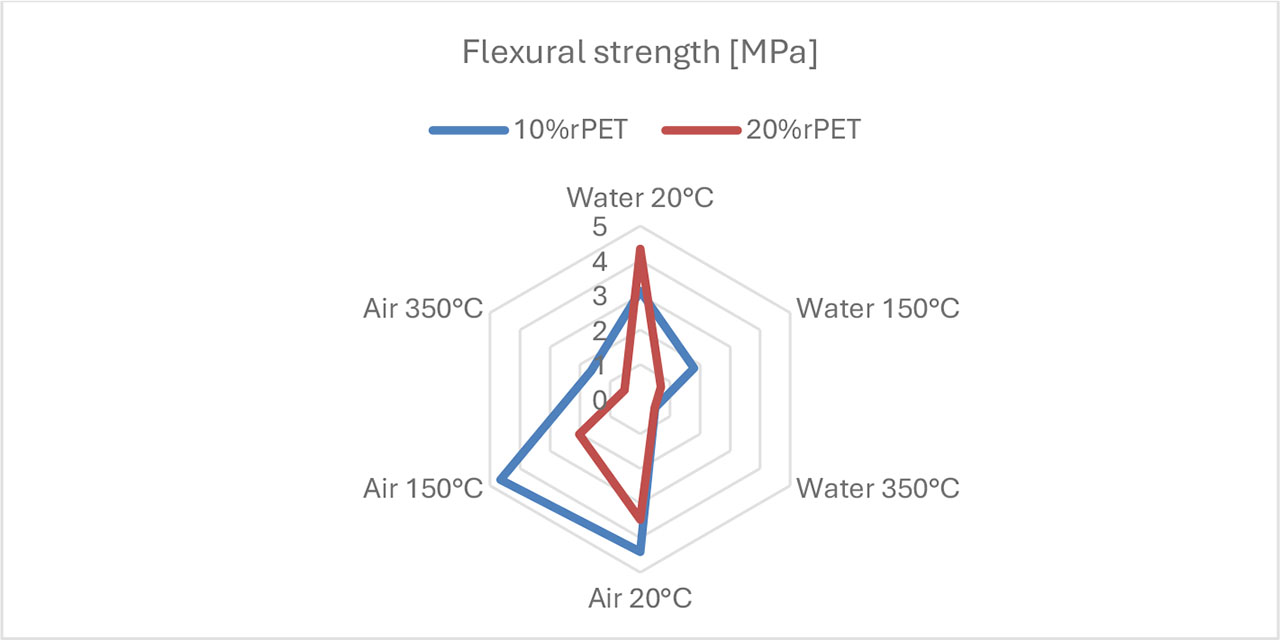
Figure 10:
Radial Performance of Flexural Strength
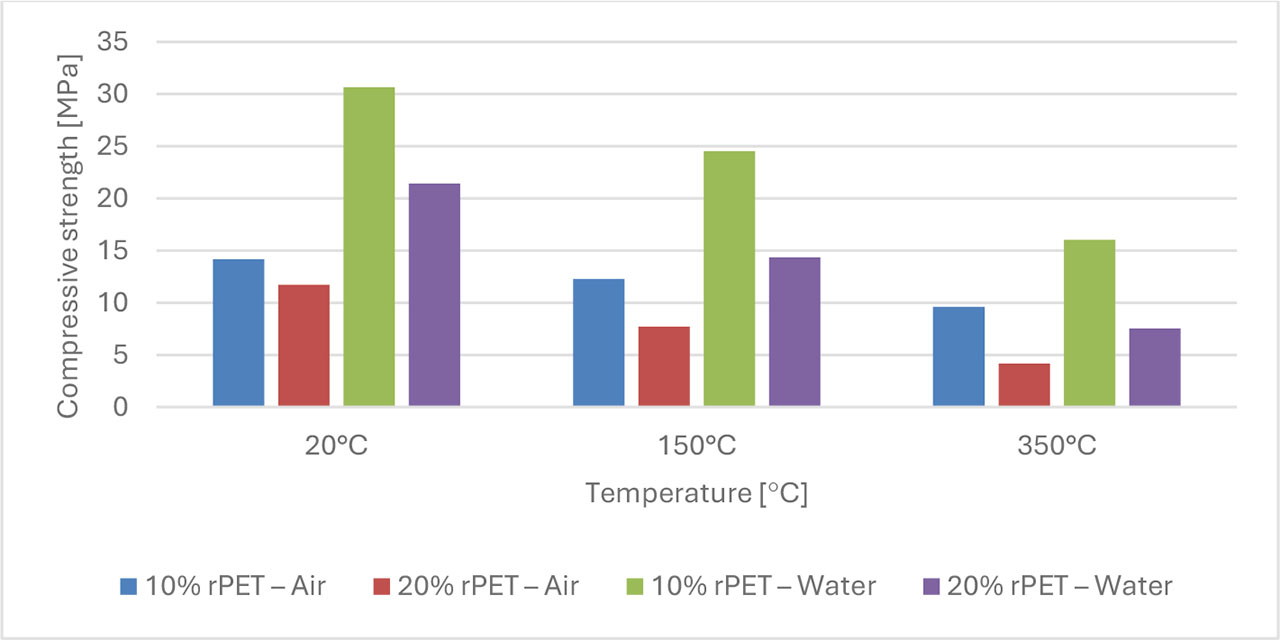
Figure 11:
Comparison of the effect of rPET content on compressive strength
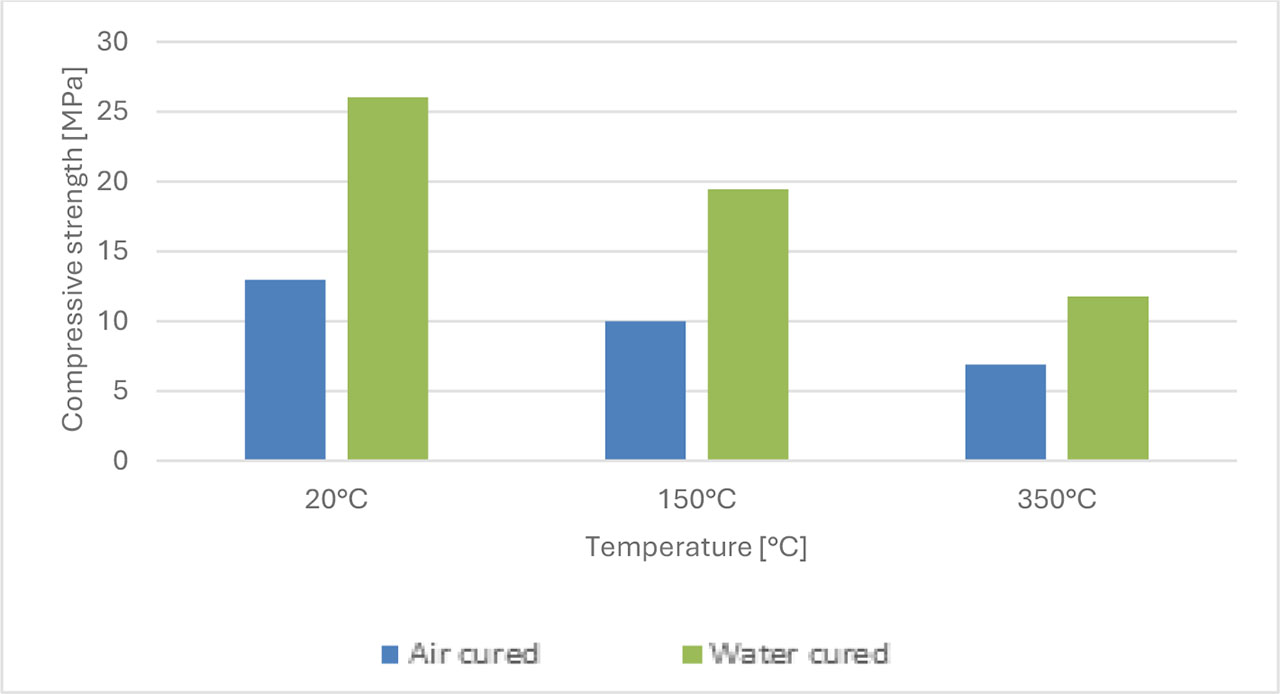
Figure 12:
Effect of the Curing Method on the Compression Test
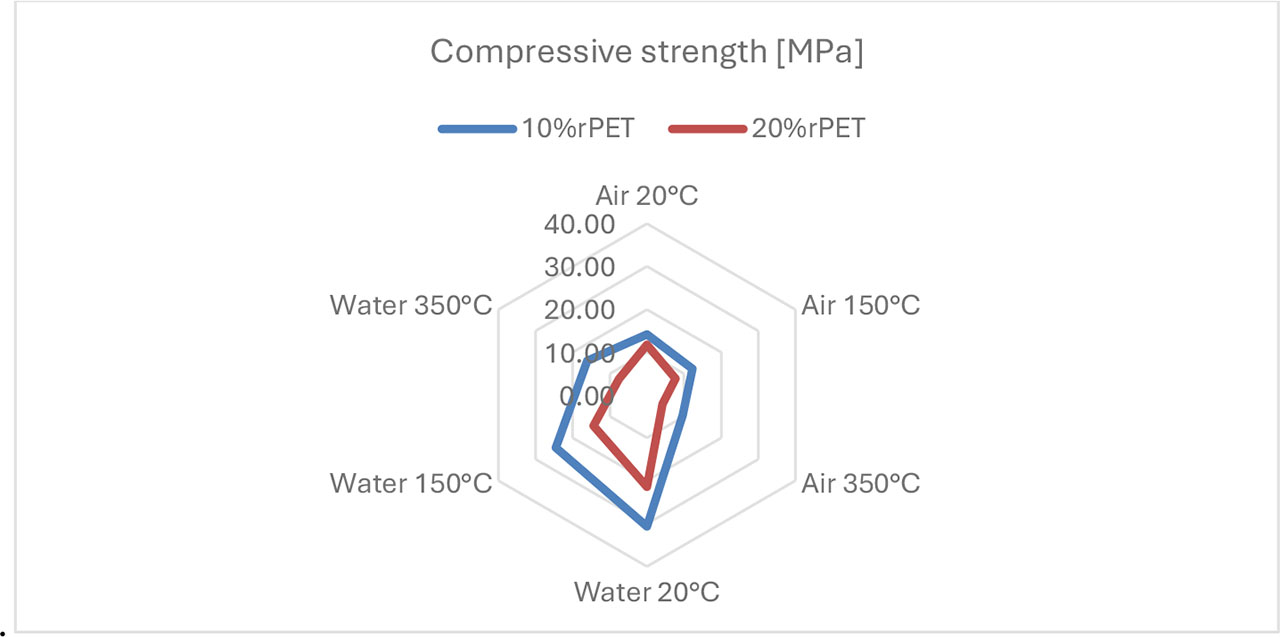
Figure 13:
Radial Performance of Compressive Strength
Table 2:
Average breaking load and corresponding flexural stress at failure for different curing conditions, temperatures, and rPET contents
| Temperature [°C] | Curing condition | rPET content [%] | Breaking load [kN] | Stress at failure [MPa] |
|---|---|---|---|---|
| 20 | Air | 10 | 22 | 3,1 |
| 20 | Air | 20 | 18,5 | 4,3 |
| 20 | Water | 10 | 49 | 4,4 |
| 20 | Water | 20 | 34 | 3,5 |
| 150 | Air | 10 | 19,5 | 1,8 |
| 150 | Air | 20 | 11,5 | 0,7 |
| 150 | Water | 10 | 39 | 4,6 |
| 150 | Water | 20 | 22,5 | 2 |
| 350 | Air | 10 | 14,5 | 0,5 |
| 350 | Air | 20 | 6 | 0,5 |
| 350 | Water | 10 | 25,5 | 1,6 |
| 350 | Water | 20 | 10,5 | 0,5 |
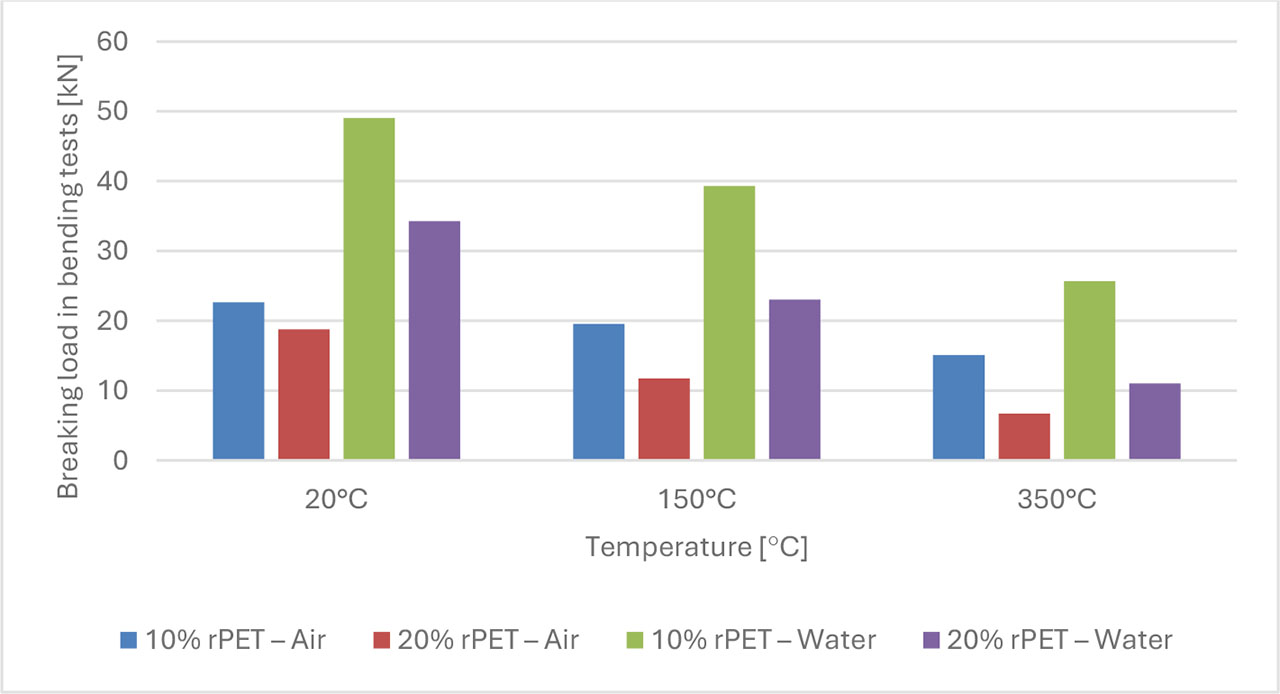
Figure 14:
Comparison general by temperature and curing condition
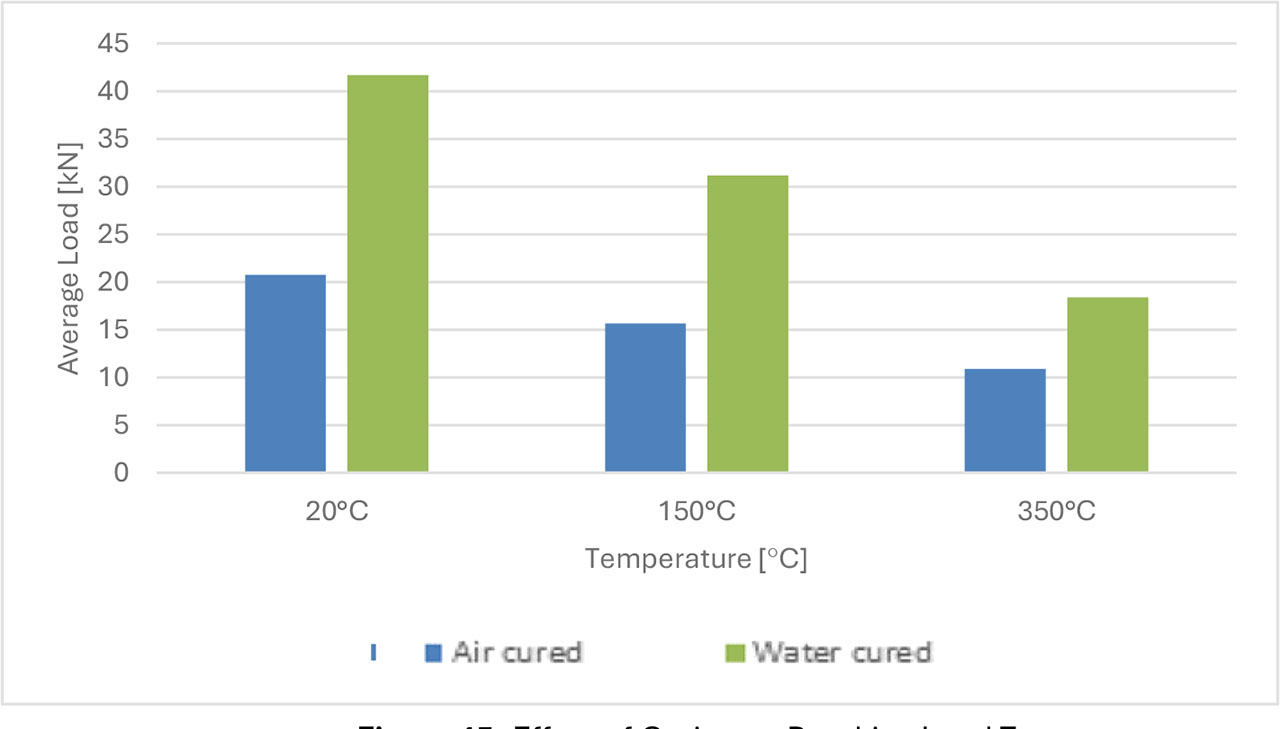
Figure 15:
Effect of Curing on Breaking Load Test
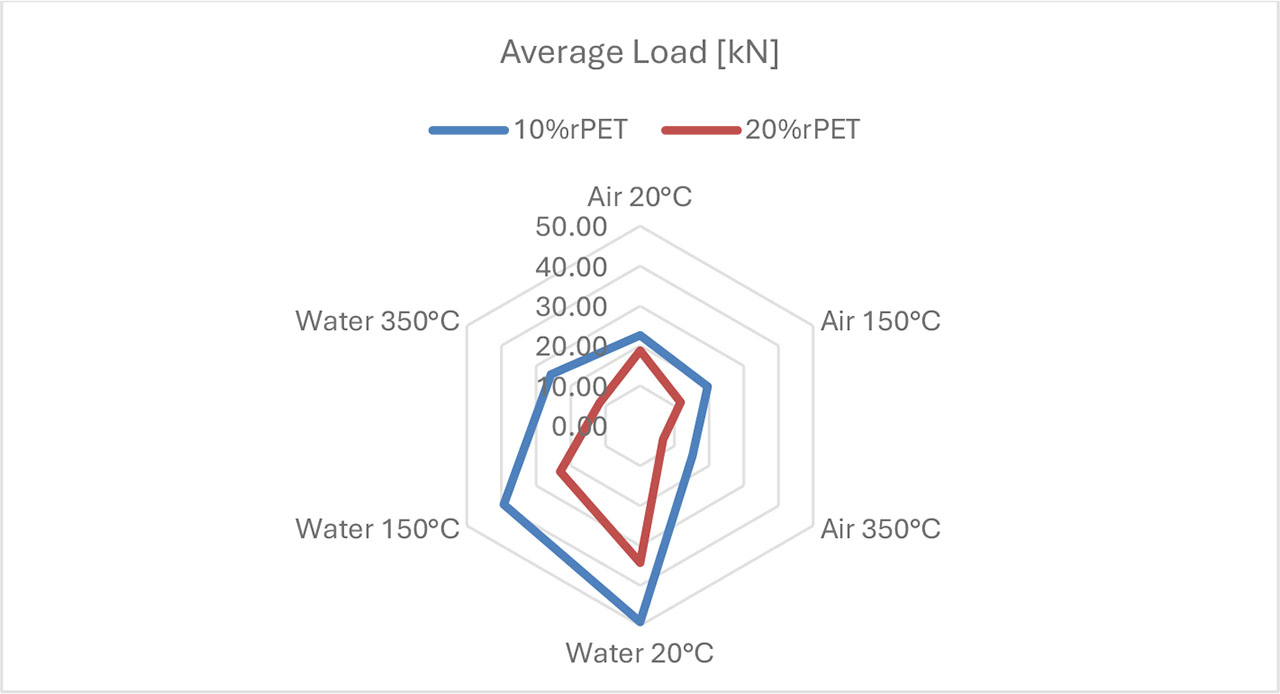
Figure 16:
Radial Performance of the Breaking Load Resistance
| Acronym | Meaning |
|---|---|
| rPET | recycled polyethylene terephthalate |
| PET | polyethylene terephthalate |
| SiC | silicon carbide |
| EN | European Standards Norm |
| UNE | Spanish Association for Standardization |
| CEM II/B-L 32.5 N | Type of Portland cement according to European regulations |
| PCD 2K | Data acquisition and control software for mechanical testing |