

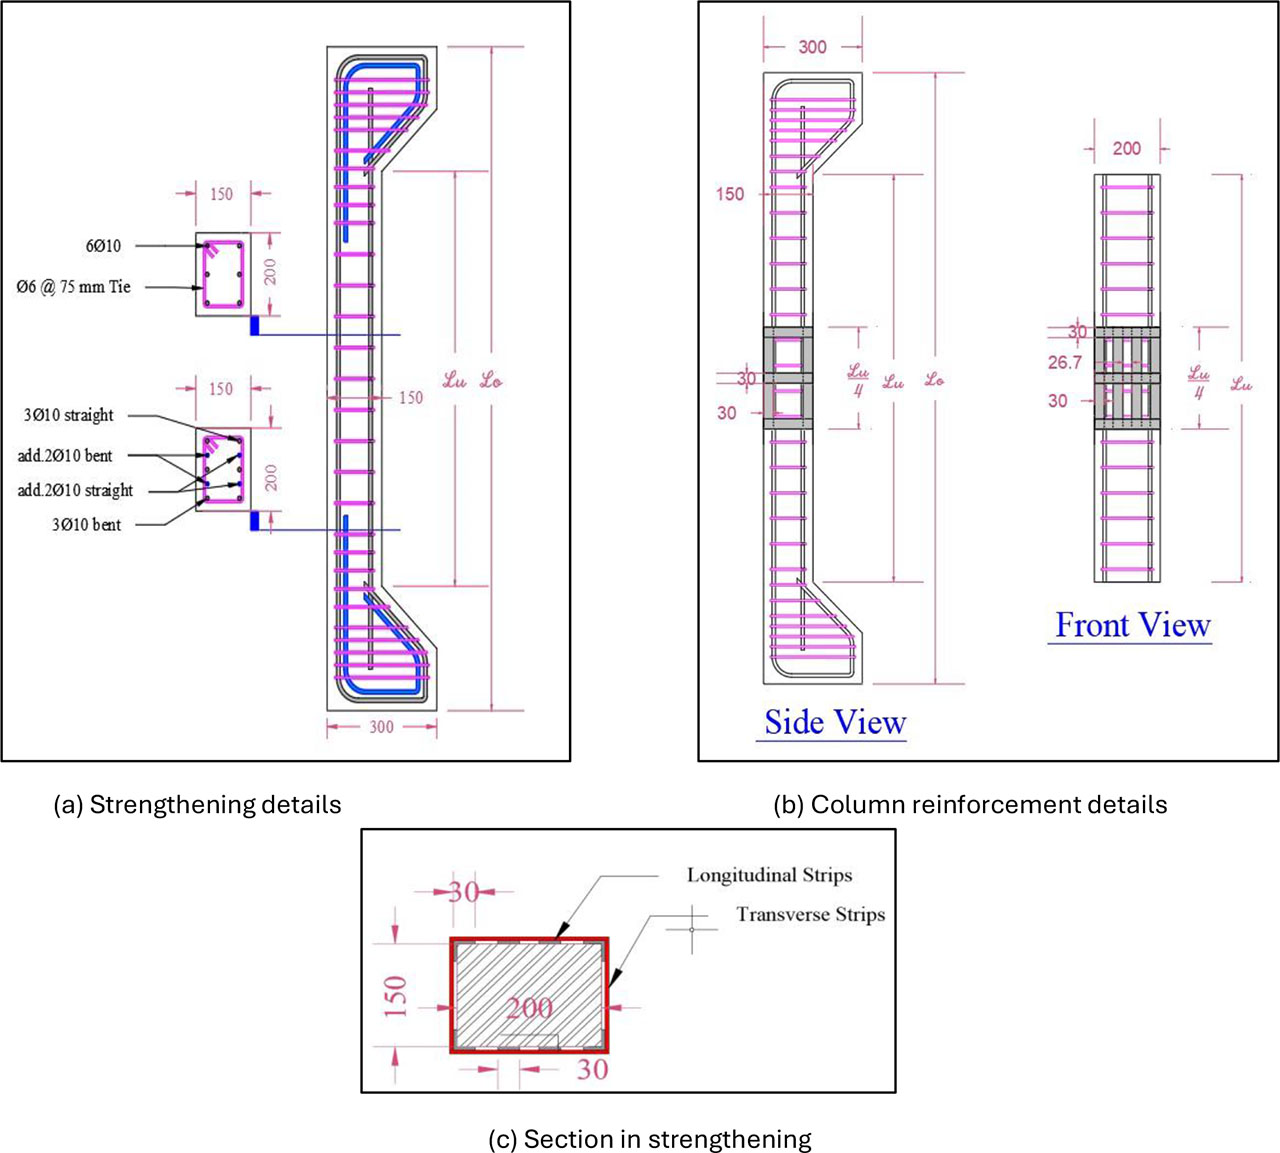
Figure 1:
Schema of column and strengthening details
Table 2:
Details column specimens
| Groups | Col. No. | Column designation | Length | Slenderness ratio ℓu / r |
|---|---|---|---|---|
| Without strength | 1 | C0E90L1.0 | 1.0 | 22.22 |
| 2 | C0E90L1.2 | 1.2 | 26.67 | |
| 3 | C0E90L1.4 | 1.4 | 31.11 | |
| With 0.25L strength | 4 | C0.25E90L1.0 | 1.0 | 22.22 |
| 5 | C0.25E90L1.2 | 1.2 | 26.67 | |
| 6 | C0.25E90L1.4 | 1.4 | 31.11 |

Figure 2:
Fresh concrete tests
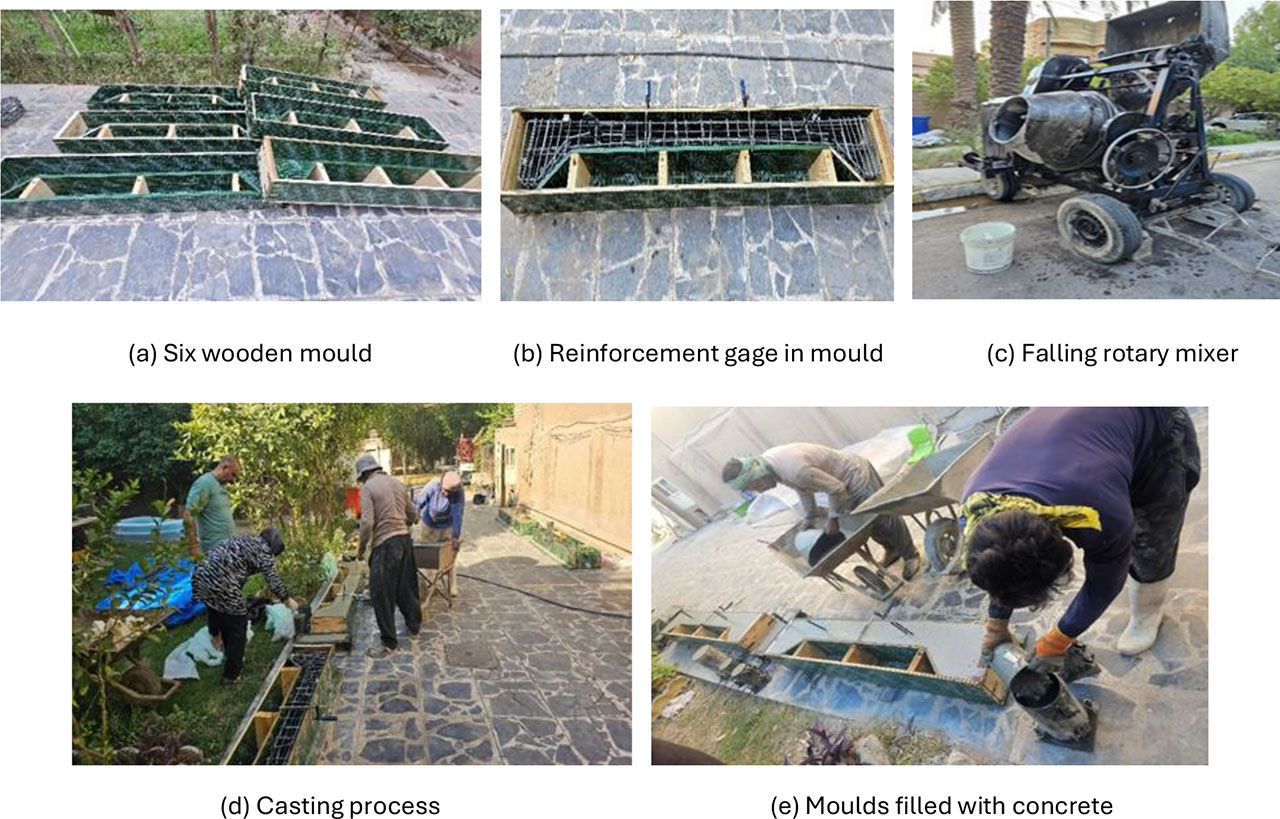
Figure 3:
Concrete mixing and Casting Process

Figure 4:
Curing process

Figure 5:
Strengthening process and painting

Figure 6:
Strain gage
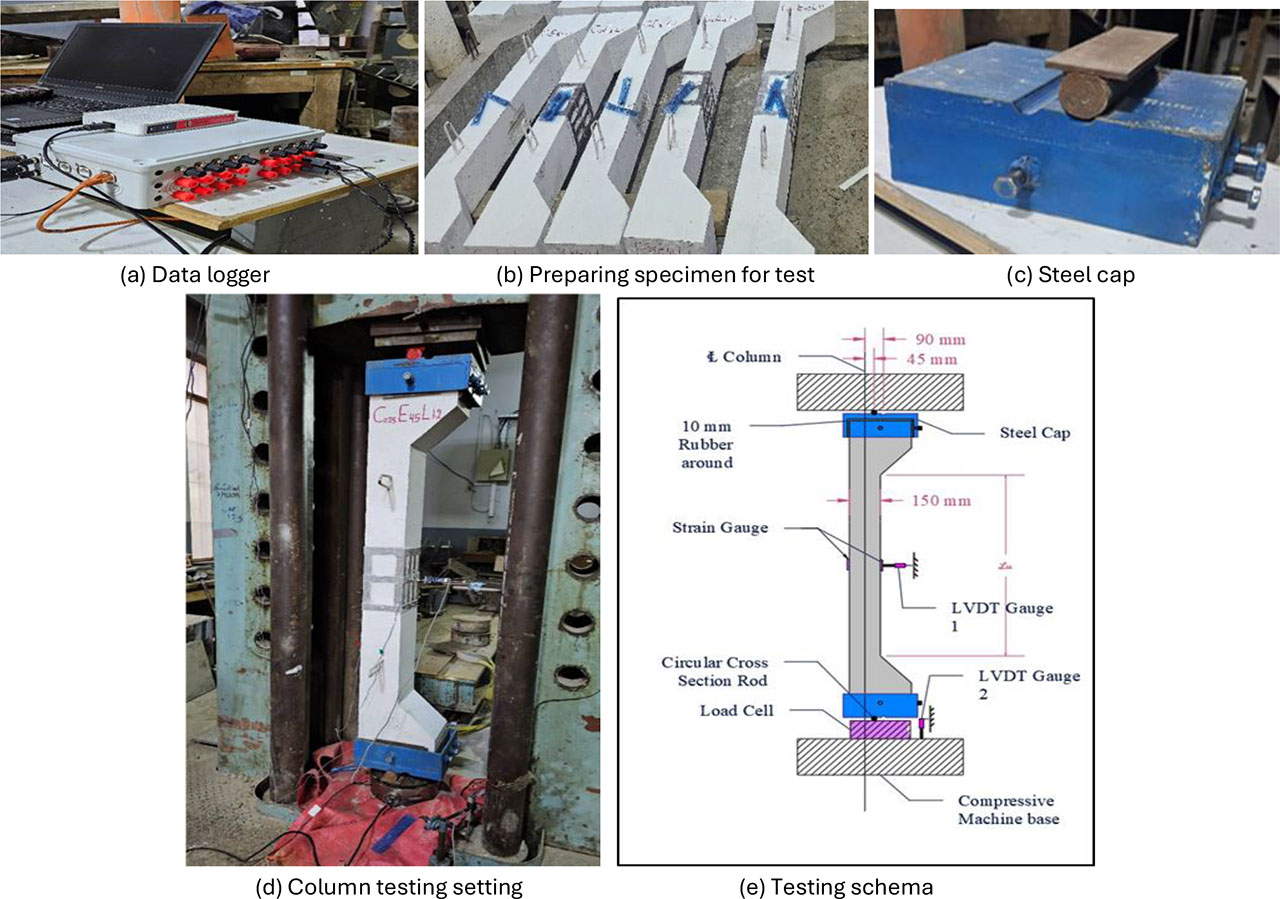
Figure 7:
Testing process and instrumentation
Table 2:
Column specimens test results
| Groups | Col. No. | Column designation | First crack load | Ultimate load Pu [kN] | Lateral displacement ∆L @ Pu [mm] | Energy absorption [EA] [kN.mm] | *Energy absorption capacity [EAC] [kN.mm/mm] |
|---|---|---|---|---|---|---|---|
| Without strength | 1 | C0E90L1.0 | 106 | 152.96 | 13.53 | 1299.33 | 96.02 |
| 2 | C0E90L1.2 | 62 | 140.26 | 15.81 | 1284.09 | 81.20 | |
| 3 | C0E90L1.4 | 60 | 136.03 | 19.26 | 1534.29 | 79.65 | |
| With 0.25L strength | 4 | C0.25E90L1.0 | 115 | 178.06 | 12.47 | 1447.35 | 116.04 |
| 5 | C0.25E90L1.2 | 70 | 158.25 | 14.83 | 1455.01 | 98.10 | |
| 6 | C0.25E90L1.4 | 65 | 151.68 | 18.606 | 1733.00 | 93.14 |
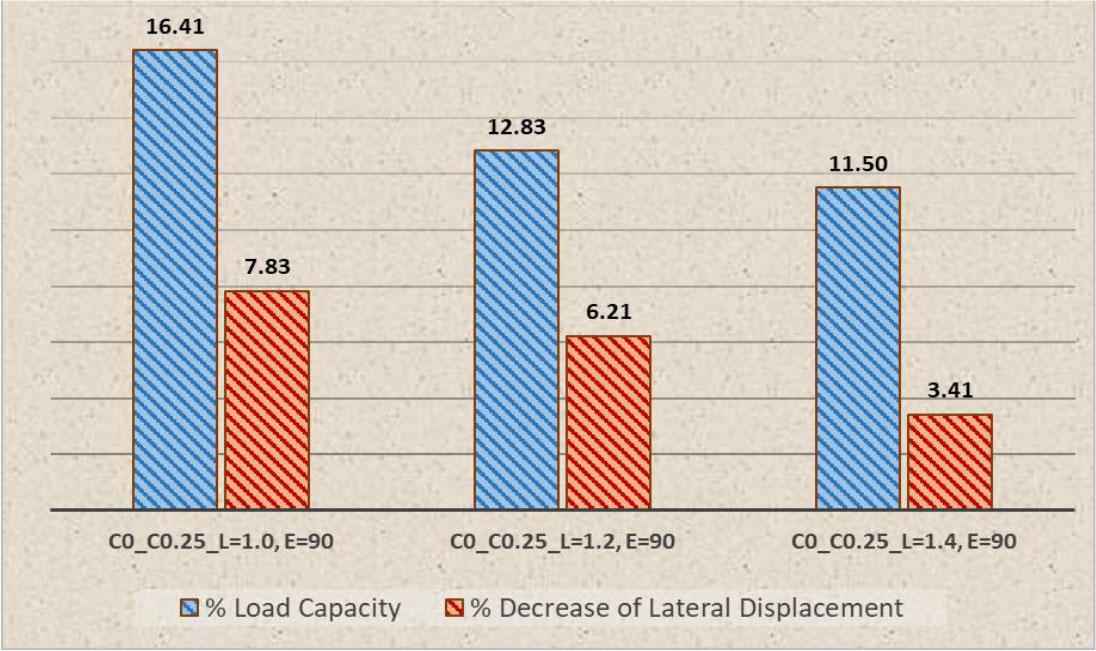
Figure 8:
Ratio of tested unstrengthen and strengthened columns for load capacity and decrease of lateral displacement (%)
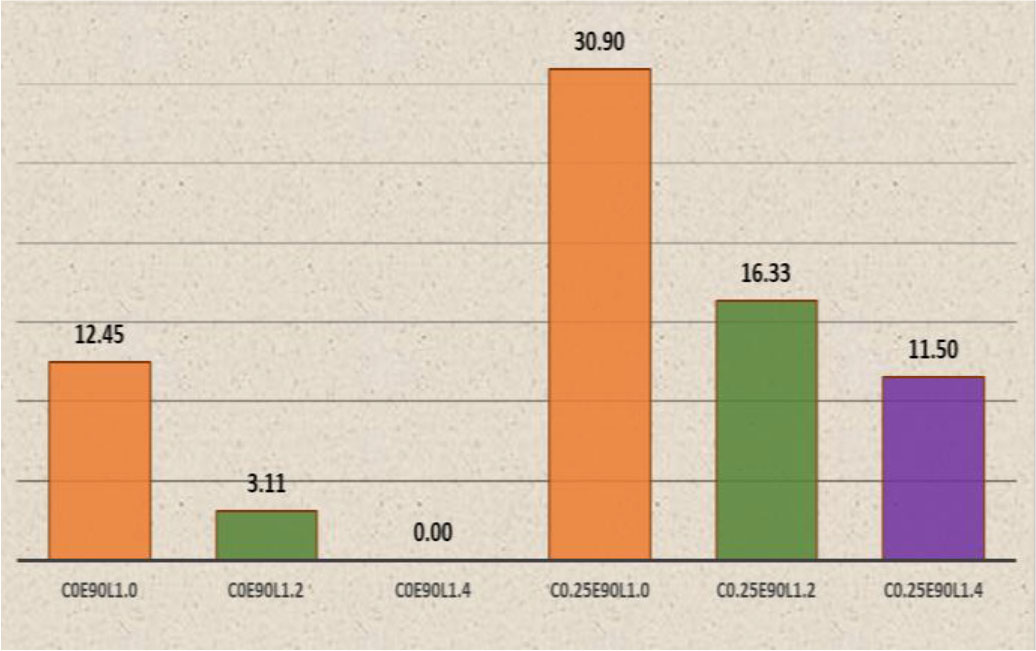
Figure 9:
Ratio of tested columns capacity to the weaker column C0E90L1.4 %, (Pcolumn / PC0E90L1.4 ×100 – 100)
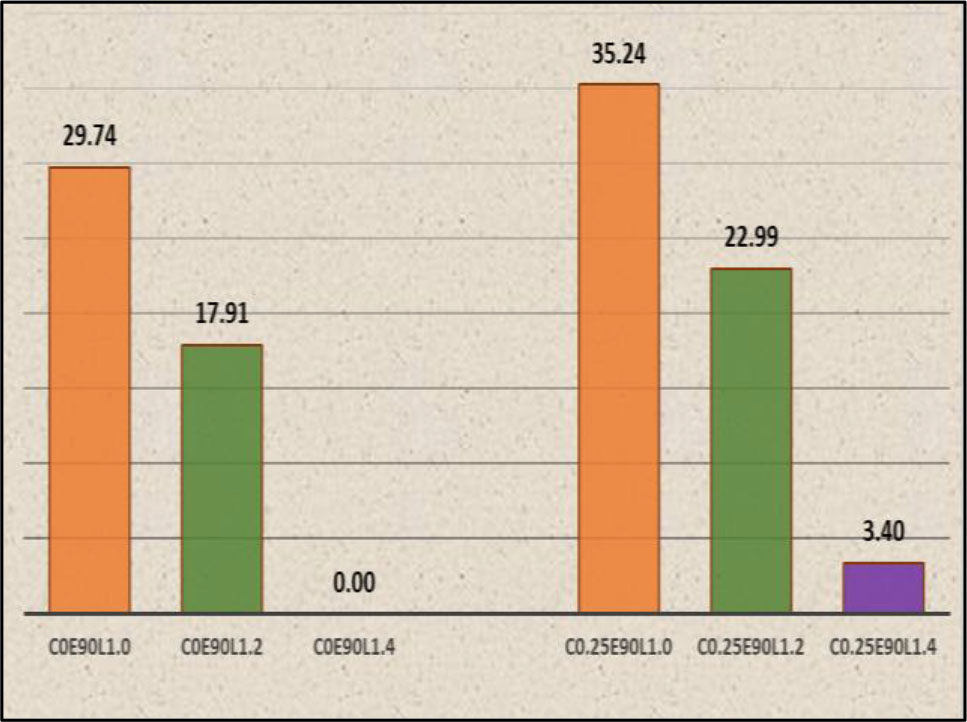
Figure 10:
Decrease ratio of lateral displacement for tested columns to the ultimate displacement of column C0E90L1.4 (%)
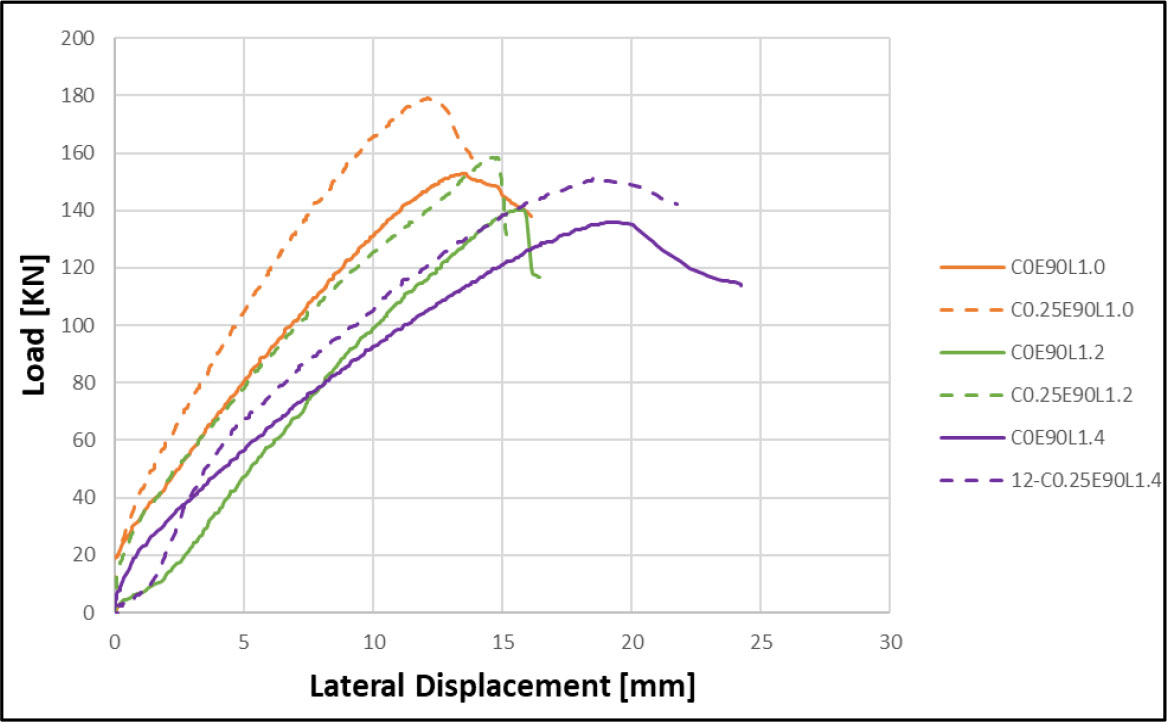
Figure 11:
Load-lateral displacement curve at mid-height of tested columns
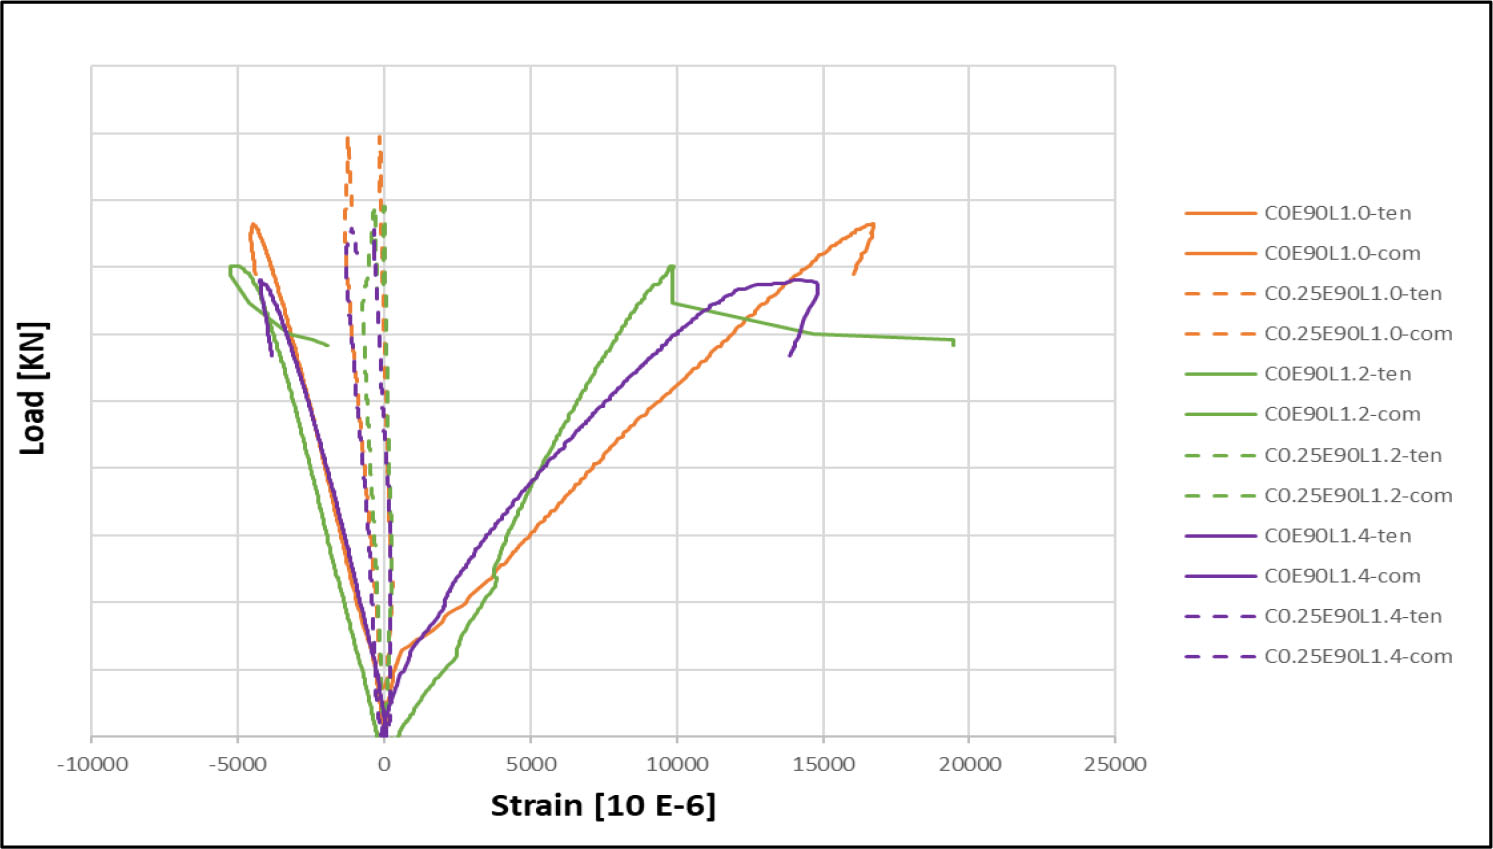
Figure 12:
Load-strain curve at mid-height of Tested columns
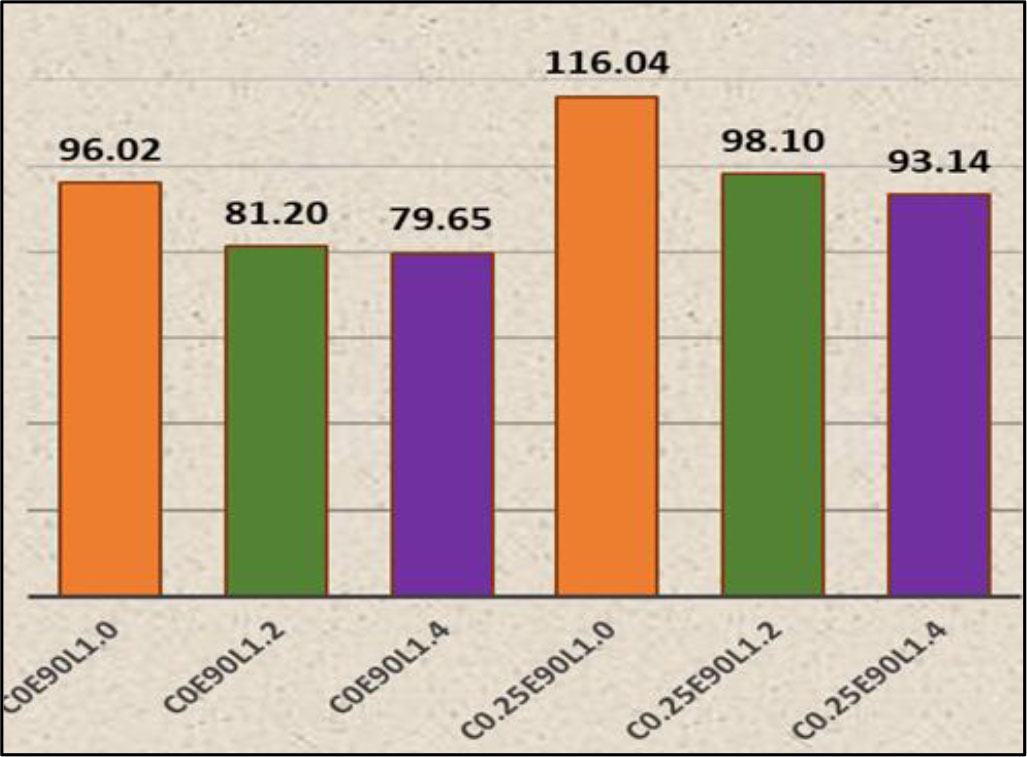
Figure 13:
Energy absorption capacity for all tested columns [kN.mm/mm]
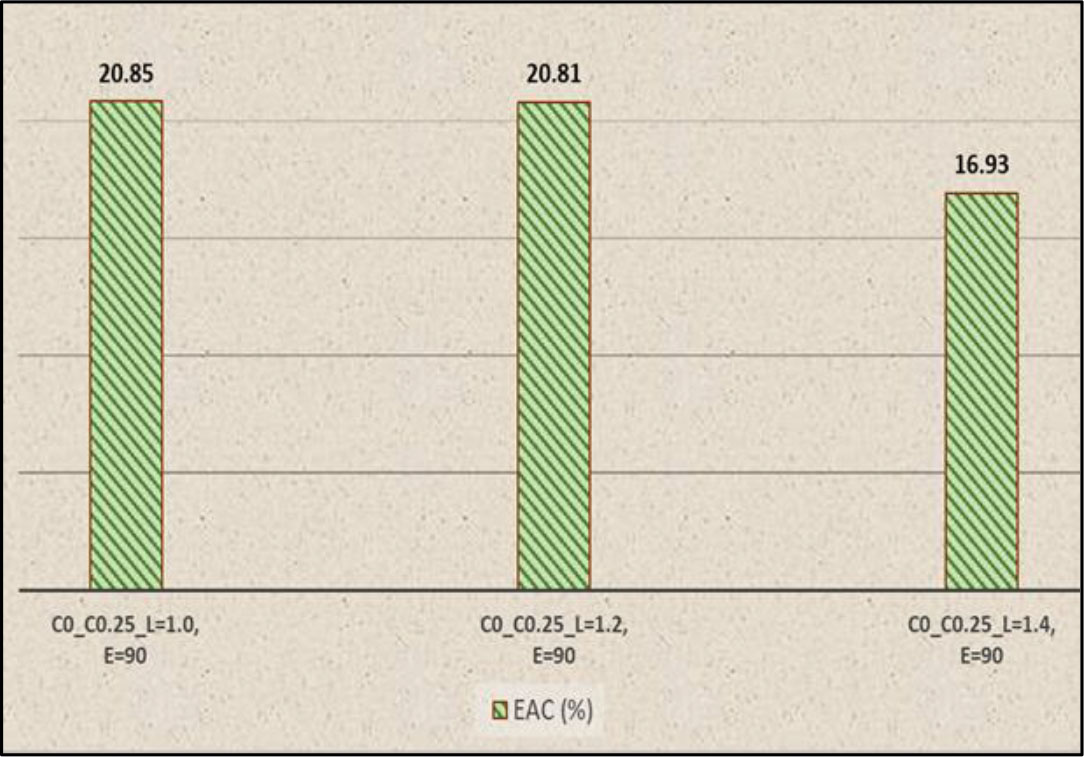
Figure14:
Ratio of tested unstrengthen and strengthened columns for energy absorption capacity (%)
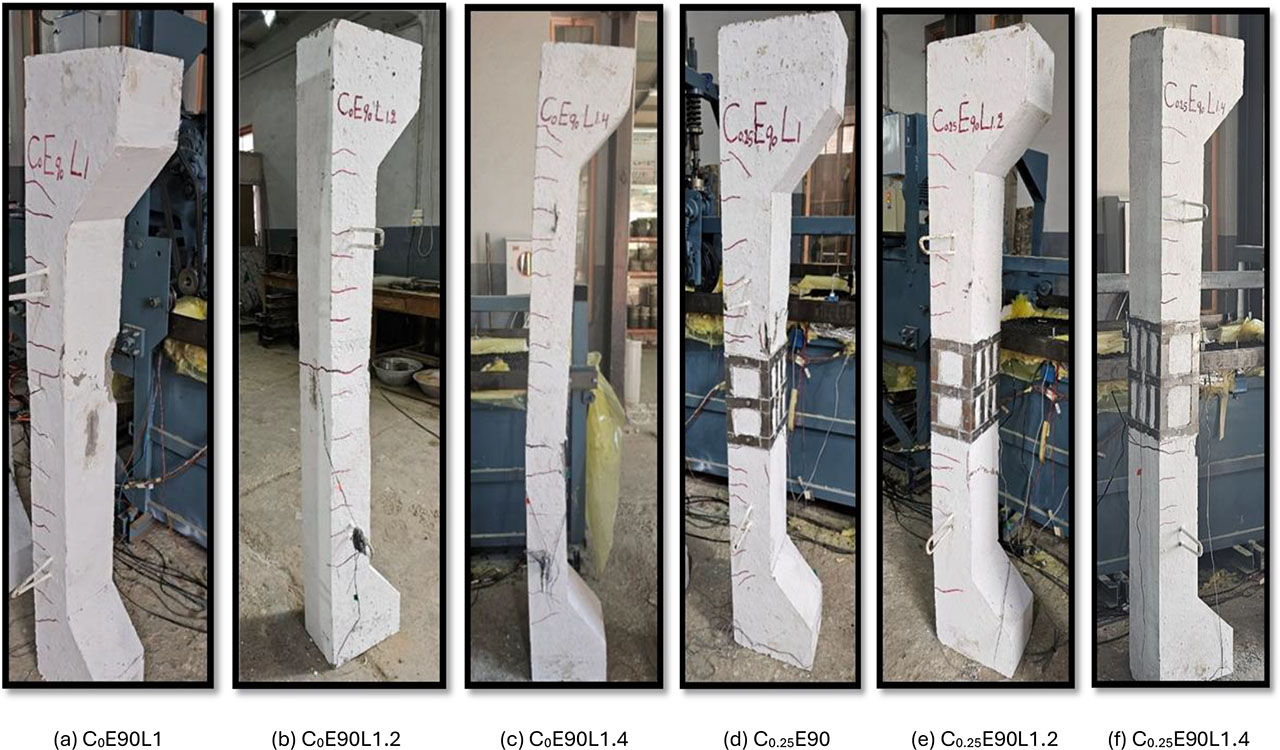
Figure 15:
Columns failure