

1. Introduction
Soil is defined as a granular medium consisting of the products of rock disintegration and decomposed organic matter (the solid phase), with air or water occupying the voids. It is considered an essential subsurface material used in structural engineering projects and foundation construction (Shaia, 2024). Soil pollution by crude oil is one of the serious and common problems in various regions globally, particularly in oil-producing nations., where this problem faces most industrial facilities, especially those dealing with crude oil in factories, refineries, storage and processing places. Iraq is one of the most important countries producing and exporting crude oil. Technological advancements contribute to increased global demand and consumption of crude oil. Crude oil exploration and transportation pose significant environmental risks, as spills can lead to large-scale pollution (Li et al., 2003). Oil pollution contaminates soil with harmful compounds like hydrocarbons and heavy metals (e.g., cadmium, nickel), reducing its quality and inhibiting plant growth and biodiversity (Marinescu et al., 2017; Pinedo-Gonzalez et al., 2018). Oil pollution alters soil properties, destroying its structure and inhibiting the enzymatic activities necessary for natural decomposition, which negatively affects plant growth and development (Pinedo-Gonzalez, 2018; Adeniji, 2017). (Zainab & Basil, 2024) studied and evaluated human health risks based on 18 physicals, chemical, and rare elements. The study highlighted the significant adverse health effects of trace elements on humans." The objectives of the study are:
Evaluating crude oil pollution levels by measuring the concentrations of heavy metals in the studied soil samples and comparing them with globally permissible levels.
Using some environmental models and pollution guides, such as the Nemerow Pollution Index PN model and the potential environmental hazard model PRI to measure pollution levels, its spread and risks in the studied areas.
2. Materials and Methodology
2.1. Research Design
Practical study: The practical study included tests to measure the concentrations of toxic heavy metal elements in soil contaminated with crude oil to determine the extent of soil contamination.
Study site: The main study site is Ajeel oil field belonging to the North Oil Company in Kirkuk Governorate, Iraq, which is located about 30 km west of the city of Tikrit and 120 km north of the capital Baghdad, at coordinates 34° 35′ 00″ north latitude and 43° 40′ 00″ east longitude.
Identification of contaminated areas and collection of samples. Table 1, shows the sections of areas concerning study.
2.2. Materials and Procedures
The digestion method was used to determine the concentration of the studied heavy elements in the soil models of the study sites. When the soil samples were collected, they were placed in sealed plastic containers and transported to the laboratory. They were dried by exposing them to sunlight and then placed in an electric oven at a temperature of 60 degrees Celsius for an hour It was ground, then passed through a sieve with an opening of 2 mm and collected in plastic containers until the soil samples were digested using some solutions, including dissolving 1.97 grams of Diethylene Triamine Penta Accetic acid and 1.1 grams of calcium chloride CaC12 in distilled water, then dissolving 14.92 grams of Triethanol amine in distilled water, mixing the two solutions together and completing the volume to one liter with distilled water 10 grams of dry, pre-sifted soil were taken, 20 ml of the mixture of the two solutions was added to it, and shaken for two hours using shaking, after which the solution was filtered using filter paper (Whatman.no.42) and then the filter was used to measure the concentrations of the elements using a flame atomic absorber Sequemental Atomic Absorption –AA240FS at the Northern Refineries Company.
2.3. Data Collection
Four samples were collected for testing and analysis in each area. These locations were selected carefully and systematically, rather than randomly, to ensure the quality of the study samples and that the selected samples were comprehensive of locations close to potential sources of contamination. With references to Figure 1, that represent the sampling locations at the Ajeel oil field.
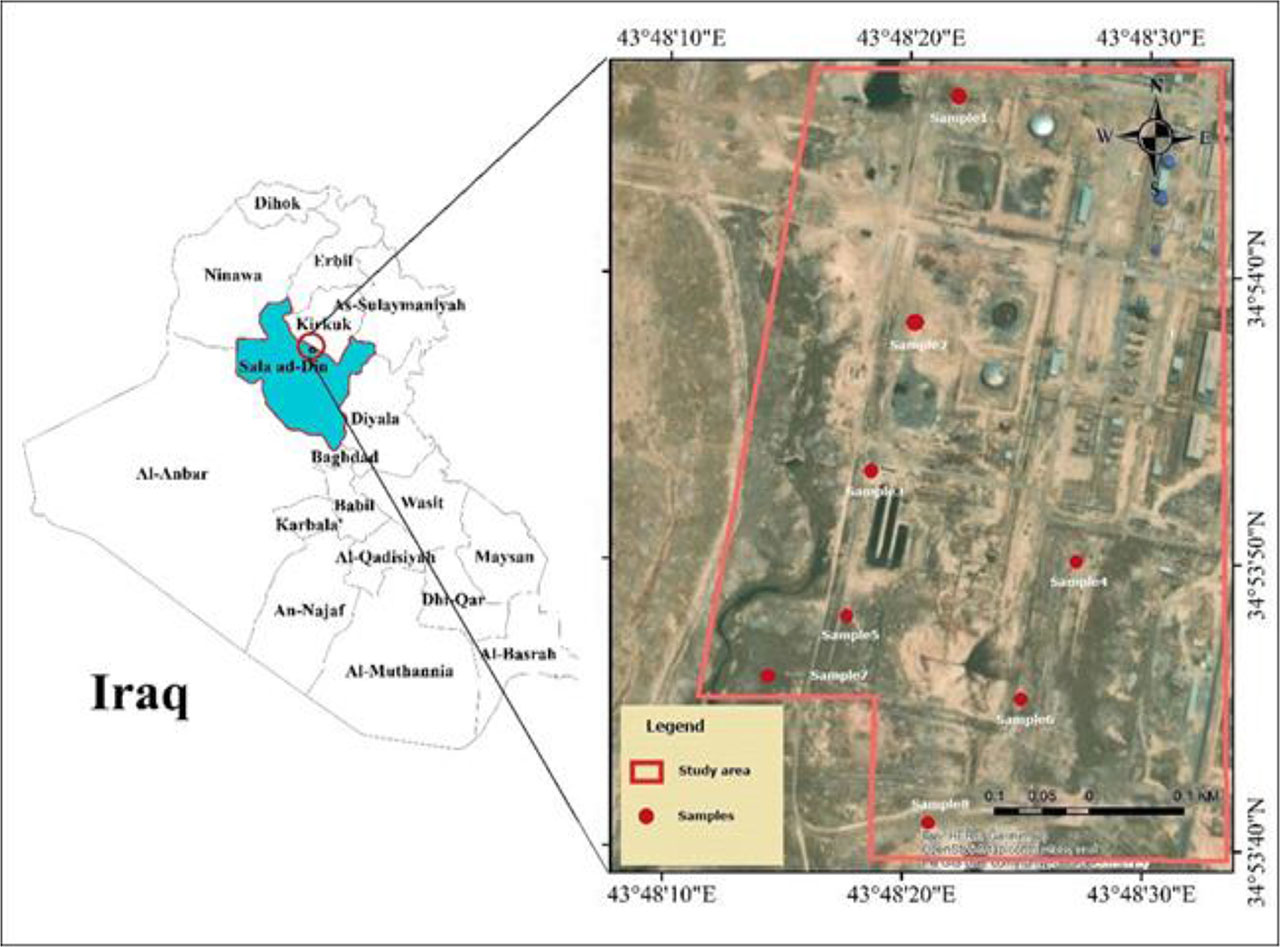
Figure 1:
Map of study sampling
Samples were taken from areas identified as contaminated with crude oil at a depth of 60 - 70 cm as a result of broken pipes and leaks. Samples were taken in a homogeneous manner from the contaminated areas. The samples were collected in transparent square plastic containers with a capacity of 12 liters, with tightly sealed lids, so that the samples would not lose their moisture and change their properties. Any foreign matter that could be observed, such as leaves, grass, stones, or other foreign objects, was removed. It should be noted that all containers were numbered, and the samples required for testing were then transported from the contaminated soil to the laboratory in sealed bags in order to preserve the moisture content of the soil sample. Figure 2 shows type and model of containers that are used to save the soil samples.
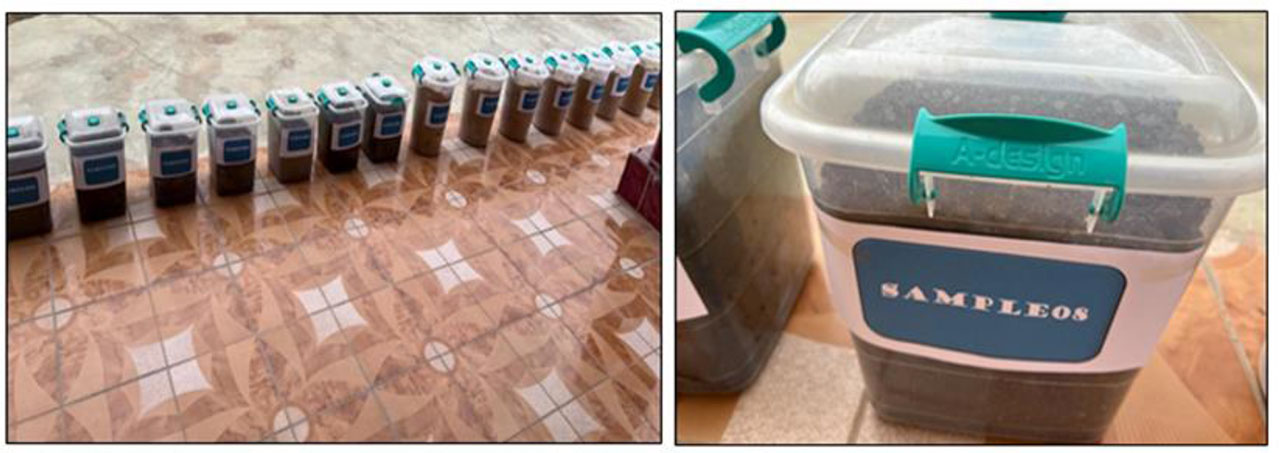
Figure 2:
Container model uses to save the collected samples
The sampling sites include areas close to broken oil pipelines with leaks, oil storage tanks with known leaks, or damaged sites, as well as damage caused by military operations. This methodology resulted in the collection of eight samples from each site studied from the two main sites, resulting in a total of 16 samples for study, each weighing approximately 12 liters. The collection the soil samples illustrative in Figure 3.
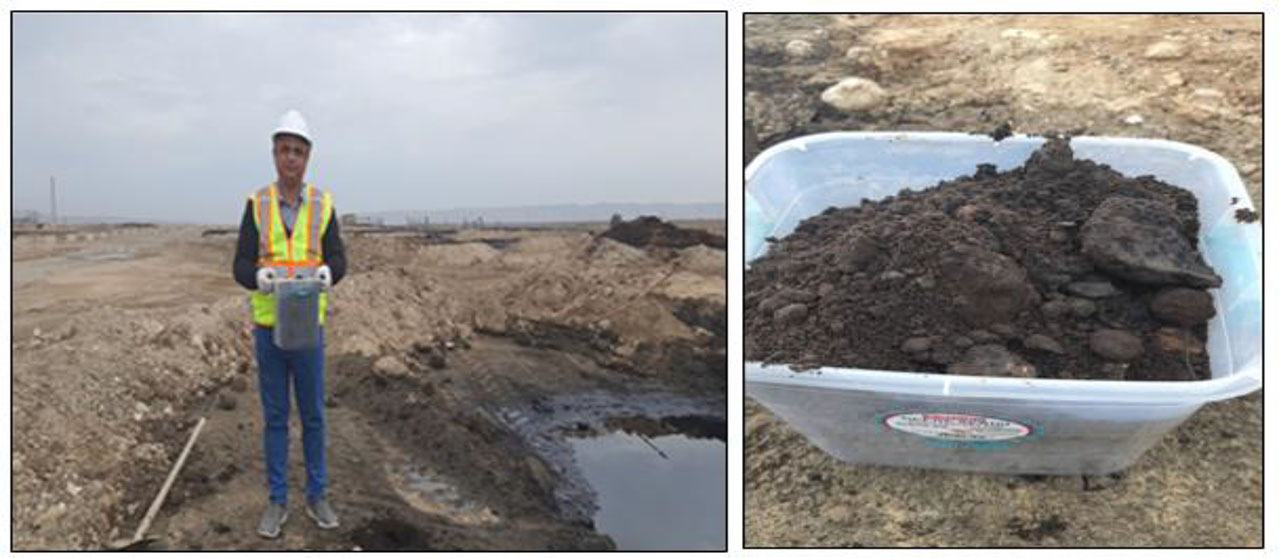
Figure 3:
Collection samples from Ajeel oil field
Soil samples were prepared (digestion with aqua regia) in accordance with ISO 11466:1995, which is the standard that precedes ISO 11047.
The concentrations of heavy elements in the resulting extracts were measured using an atomic flame spectrometer (AA-6200) in accordance with ISO 11047:1998.
A total of 8 samples were tested in the laboratory. The eight samples were collected from two different locations: Sample1, Sample2, Sample3 and Sample 4 were identified in Zone 1 of the Ajeel oil field and Sample 5, Sample 6, Sample 7 and Sample 8 were identified in Zone 2, of the Ajeel oil field. The Ajeel oil field is administratively affiliated with the North Oil Company in Kirkuk Governorate, northern Iraq. Concentrations of the eleven heavy metals were also measured, which included the elements: lead (Pb+2), cadmium (Cd+2), chromium (Cr), zinc (Zn+2), nickel (Ni+2), copper (Cu+2), lead (Fe+3), manganese (Mn+2), cobalt (Co+2), molybdenum (Mo+6), and arsenic (As). Forty results were obtained representing all the elements studied.
Models and Pollution Indicators Used to Measure Pollution Levels Based on Heavy Metal Concentrations in the Soils Studied
1. Pollution Index-Nemerow (PN)
The Nemerow Pollution Index is defined as the single factor that assesses the amount of toxicity contributed by a single element at the station under study. It is widely applied, reflects the quality of the environment, determines the overall level of pollution in the water body, and is expressed by the mathematical relationship. (Wan et al., 2016), (Mishra et al., 2016).
Where:
PI = Pollution index for the potential toxic element,
Ci = Concentration of the toxic element measured in the sample,
Si = Maximum concentration of the toxic element adopted by the (WHO. 2017),
N = Number of elements used in the equation.
PImax and PIaverage represent the maximum and average values of the pollution indices for all potential toxic elements, respectively.
2. Environmental risk assessment model: Potential Ecological Risk index (PRI)
Heavy elements in the ecosystem can enter the human body in various ways, including contact, inhalation, and ingestion, thereby negatively affecting human life and causing many types of diseases (Bade et al., 2013). Therefore, the health risk index for heavy elements was used to assess their toxicity and was calculated using the following equation: (Pan et al., 2016).
Where:
Where:
Ti - the toxicity coefficient of the element,
As+3 = 10, Fe+3=1, Cu+2 = 5, Co+2=5, Cr+3 = 2, Mo+6=5, Cd+2 = 30, Ni+2 = 5,Mn+2=1, Pb+2 = 5, Zn+2 =1 according to (Hakanson, 1980), and Ci indicate to element’s concentration, and Bi denotes concentration of elements in the earth’s crust, i.e. Ci/Bi reflects contamination factor (CF).
Results and Discussion
Heavy metals concentration results were measured in soil samples from the Ajeel oil field sites. This is done to assess whether heavy metals measured are within globally allowed ranges or exceed them, measuring soil pollution and the potential serious health and environmental effects. Figures 4 and 5 demonstrate heavy metal concentrations in all sites tested.
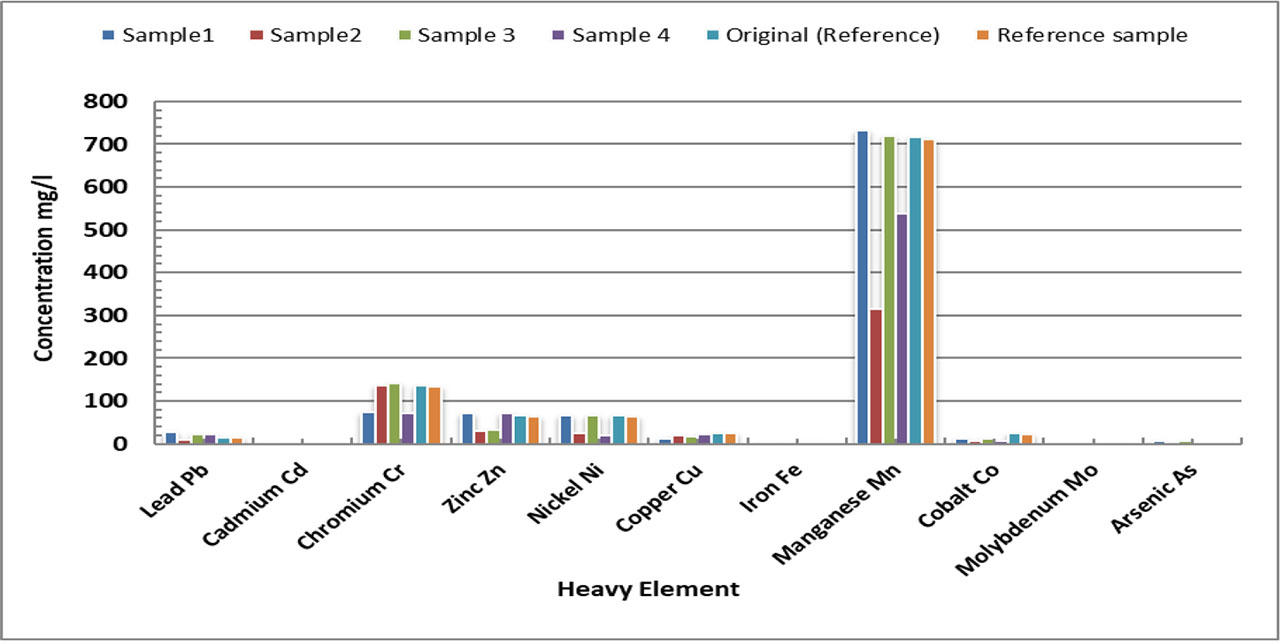
Figure 4:
Measurement of heavy metal concentrations in soil samples in Zone 1 of the Ajeel oil field
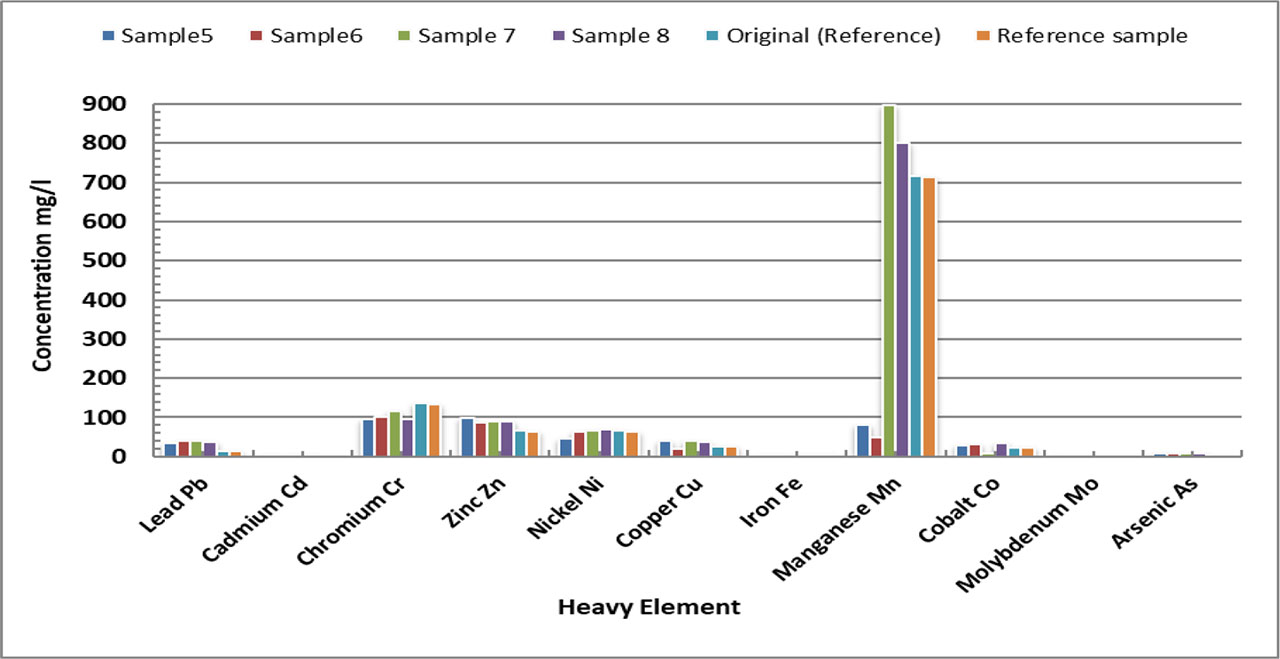
Figure 5:
Measurement of heavy elements concentrations for soil models in Zone 2 of the Ajeel oil field
Based on Figures 4 and 5, it is likely to correspond to the Ajeel oil field. The data compares sample values against permissible limits and provides possible sources of contamination. Lead (Pb+2) contamination is a significant concern in both areas. In Figure 4, two samples (1 and 3) exceed permissible limits, while in Figure 5, all samples exceed the limits by more than double. The likely cause is industrial oil activities such as mining, drilling, and metal refining, along with waste from fuel combustion (Kyavskopf, 1979). Cadmium (Cd+2) levels are dangerously high in both locations. In Figure 4, all samples exceed the permissible value. Similarly, in Figure 5, all samples except one (sample 6) are significantly above the limits. The contamination is attributed to industrial oil discharges, including oil and grease residues, which accumulate in soil and water (Davis et al., 2001). Cadmium is a highly toxic metal, making these findings particularly alarming. Chromium (Cr) Chromium contamination is moderate to low. In Figure 4, only one sample (sample 3) slightly exceeds the limit. In Figure 5, all samples are within permissible limits, indicating stability. The low levels are likely due to the absence of significant paint and sewage residues, which are common sources of this element (Ungureanu et al., 2017). Zinc (Zn+2) contamination varies between the two areas. In Figure 4, only one sample (sample 4) slightly exceeds the limit, reflecting a low level of contamination. However, in Figure 5, all samples exceed the permissible limits. This is likely due to industrial activities at the refinery and the discharge of industrial oil waste, a common source of zinc pollution in industrial areas (Matthews and Kakulu, 2013). Nickel (Ni+2) contamination is relatively low. In Figure 4, all samples are within permissible limits. In Figure 5, only one sample (sample 8) slightly exceeds the limit. The presence of nickel is attributed to leaks from metal industries into groundwater (Long et al., 2018). Copper (Cu+2) levels show a clear difference between the two sites. In Figure 4, all samples are within permissible limits. In Figure 5, all samples except one (sample 6) exceed the limits. This contamination is likely caused by industrial waste discharge and copper pipes (Hind et al., 2017). Iron (Fe+3) contamination is limited. In Figure 4, only one sample (sample 3) slightly exceeds the limit. In Figure 5, two samples (6 and 8) exceed the permissible values. Potential sources include mining, oil industry activities, and abandoned lead waste structures (Navarrete et al., 2017). Manganese (Mn+2) shows a risk in specific areas. In Figure 4, one sample (sample1) exceeds the limit. In Figure 5, all samples exceed the permissible limits. Contamination is likely due to the discharge of sewage, industrial wastewater, oil waste, and fuel combustion (Li et al., 2013). Cobalt (Co) contamination is moderate. In Figure 4, all samples are within permissible limits. In Figure 5, two samples (5 and 8) exceed the limits. This is attributed to industrial waste from mining, manufacturing, and oil activities (Al Ani, 2000). Molybdenum (Mo+6) contamination is limited but requires follow-up. In Figure 4, one sample (sample 3) slightly exceeds the limit. In Figure 5, all samples slightly exceed the permissible limits. The sources include agricultural fertilizers, industrial waste disposal, oil waste, and road repairs (Wang et al, 2015). Arsenic (As) poses a significant environmental and health risk. In Figure 4, two samples (1 and 3) exceed the limits. In Figure 5, all samples exceed the limits by several times. The contamination is explained by the presence of industrial waste (tanks) and the use of pesticides and agricultural fertilizers containing phosphate (Dehghani et al., 2017). Regarding the environmental impact, lead Pb+2 is considered a persistent, non-biodegradable pollutant that impairs soil fertility and plant growth; it bio accumulates to transfer through the food chain to humans. As+3 for the health impact on humans, lead attacks cells via oxidative stress and calcium mimicry, causing brain damage (reduced IQ), hypertension, renal failure, and reproductive system disorders (Jomova et al, 2025). Cadmium Cd+2, its environmental impact, exceeding permissible limits, leads to its accumulation in the soil and easy transfer to plants. It has a "bioaccumulation" property (Bioaccumulation), which means that it increases in concentration as we move up the food chain. Health effects on humans: Its health effects on humans cause kidney damage, severe bone pain, and osteomalacia. It is considered a first-class carcinogen according to the International Agency for Research on Cancer (IARC) classification as a group 1 carcinogen (Rehman et al, 2018). Hexavalent chromium (Cr+3 VI) is considered the most chemically hazardous form. Its environmental damage is characterized by contaminating water resources (both groundwater and surface water), reducing agricultural productivity, and causing widespread environmental degradation. The health effects of hexavalent chromium exposure on humans are severe. It causes respiratory tract cancer and has major harmful effects on the skin. Additionally, exposure to large doses of hexavalent chromium leads to damage of the kidneys and liver (Rehman et al, 2018). For environmental impact, when zinc exceeds permissible limits, it pollutes water resources and soil, causing it to accumulate in agricultural soil and reduce productivity. It also forms a toxin for soil microorganisms and disrupts basic biological processes. Health impact on humans, Continuous exposure to large amounts of zinc causes anemia, nausea and vomiting, stomach cramps, low levels of A HDL, weak immunity, and copper deficiency in the body (Schoofs et al, 2024). Environmentally: Arsenic As+3 contaminates groundwater and bio accumulates in the food chain, especially crops, posing a threat to living organisms. Health-wise: It is classified as a confirmed human carcinogen causing skin, lung, and bladder cancers, in addition to causing distinct skin lesions (hyperkeratosis) and severe vascular damage (Abd Elnabi et a,2023).
Statistical Analysis of Soil Pollution in the Ajeel Oil Field
Table 2 clarifies a statistical analysis of the results of heavy metal concentrations in soil samples taken from Zone 1 of the Ajeel oil field.
Table 2:
A statistical analysis of the results of heavy metal concentrations samples, Zone 1
| Heavy elements (mg/l) | Mean | Median | Std. deviation | Min. | Max. |
|---|---|---|---|---|---|
| Lead Pb+2 | 20.46 | 22.09 | 8.52 | 9.11 | 28.54 |
| Cadmium Cd+2 | 1.19 | 0.41 | 1.58 | 0.33 | 3.44 |
| Chromium Cr+3 | 105.86 | 136.83 | 33.72 | 70.63 | 140.97 |
| Zinc Zn+2 | 58.07 | 68.89 | 22.02 | 30.13 | 72.48 |
| Nickel Ni+2 | 43.14 | 43.08 | 24.16 | 20.32 | 67.41 |
| Copper Cu+2 | 18.06 | 19.34 | 4.67 | 11.25 | 22.41 |
| Iron Fe+3 | 3.84 | 4.09 | 1.05 | 2.31 | 4.77 |
| Manganese Mn+2 | 693.50 | 725.50 | 102.50 | 537.0 | 733.0 |
| Cobalt Co+2 | 9.87 | 9.79 | 3.23 | 6.80 | 13.10 |
| Molybdenum Mo+6 | 1.13 | 1.12 | 0.49 | 0.61 | 1.65 |
| Arsenic As | 3.75 | 4.10 | 2.87 | 1.20 | 6.70 |
For major polluting minerals: The results show that chromium (Cr+3) and manganese (Mn+2) are the two most concentrated elements in soil, averaging 105.86 and 693.50 mg/L, respectively. This indicates that these two metals are the main pollutants in Zone 1. Regarding the impact of pollution on soil: Heavy metals found in crude oil can affect soil properties in different ways: In terms of changing physical and chemical properties: High concentrations of heavy metals may change the pH of the soil (pH), affecting its ability to support microorganisms and plants, as confirmed by researchers (Kabata-Pendias & Pendias, 2007). Interpretation in terms of accumulation in the food chain: Minerals such as lead (Pb+2) and cadmium (Cd+2) are toxic even at low concentrations. These minerals can move from soil to plants, and then to animals and humans through the food chain, posing a health risk and this explanation is consistent with the researcher’s explanation (Wedepole, 1995). Pollution distribution: The high standard deviation of chromium (Cr+3) (33.72), nickel (Ni+2) (24.16), and zinc (Zn+2) (22.02) indicates that pollution by these elements is not evenly distributed throughout the region. This variation is an indicator of pollution hotspots, which may be the result of oil spills or specific activities. Importance of maximum and minimum values: Maximum values for some elements, such as chromium (140.97) and manganese (733.0), show that some sites in the region suffer from severe pollution. This is critical to prioritizing environmental remediation efforts. Pollution distribution: The high standard deviation of chromium (Cr+3) (33.72), nickel (Ni+2) (24.16), and zinc (Zn+2) (22.02) indicates that pollution by these elements is not evenly distributed throughout the region. This variation is an indicator of pollution hotspots, which may be the result of oil spills or specific activities. Finally, to discuss the distribution of pollution: The high standard deviation of chromium (Cr+3) (33.72), nickel (Ni+2) (24.16), and zinc (Zn+2) (22.02) indicates that pollution by these elements is not evenly distributed throughout the region. This variation is an indicator of pollution hotspots, which may be the result of oil spills or specific activities. Importance of maximum and minimum values: Maximum values for some elements, such as chromium (140.97) and manganese (733.0), show that some sites in the region suffer from severe pollution. This is critical to prioritizing environmental remediation efforts.
Table 3 shows the statistical analysis of the results of soil contamination with crude oil lin the Ajeel oil field, Zone 2.
Table 3:
The statistical analysis of the results of soil contamination, Zone 2
| Heavy elements (mg/l) | Mean | Median | Std. deviation | Min. | Max. |
|---|---|---|---|---|---|
| Lead Pb+2 | 37.58 | 38.08 | 1.83 | 35.11 | 38.93 |
| Cadmium Cd+2 | 3.79 | 4.69 | 2.52 | 0.06 | 5.72 |
| Chromium Cr+3 | 101.33 | 97.68 | 9.94 | 94.22 | 115.75 |
| Zinc Zn+2 | 91.90 | 89.92 | 5.25 | 87.52 | 99.52 |
| Nickel Ni+2 | 61.55 | 65.73 | 11.23 | 45.38 | 69.36 |
| Copper Cu+2 | 33.83 | 37.46 | 9.17 | 20.17 | 40.25 |
| Iron Fe+3 | 433.29 | 441.28 | 425.92 | 48.37 | 897.40 |
| Manganese Mn+2 | 30.92 | 30.30 | 10.95 | 7.32 | 33.76 |
| Cobalt Co+2 | 1.86 | 1.89 | 0.10 | 1.71 | 1.95 |
| Molybdenum Mo+6 | 7.73 | 7.70 | 0.81 | 6.90 | 8.60 |
| Arsenic As+3 | 7.23 | 7.10 | 0.82 | 6.50 | 8.10 |
Regarding mean concentration (Mean) and median (Median): The arithmetic mean and median show that the concentration of heaviest elements in contaminated soil samples is much higher than their concentrations in reference samples. For example, the average concentration of lead (Pb+2) is 37.58 mg/L, which is more than double its concentration in the reference sample (about 14.7 mg/L). This confirms the presence of contamination with these metals. As for the standard deviation (Std. Deviation): This measure indicates how dispersed the results are. Its high standard deviation, as in iron (Fe+3) (425.92), indicates that contamination with this element is heterogeneous and highly concentrated in some locations, perhaps near oil spill sources. While the low standard deviation of cobalt (Co+2) (0.10) indicates that its concentration is more uniformly distributed across all samples. Minimum (Min) and Maximum (Max): These values show the pollution range. The large variation between the lowest and highest value, as in the case of iron (Fe+3) (from 48.37 to 897.40 mg/L), confirms that the severity of contamination varies greatly from one location to another. This helps identify pollution hotspots that require urgent treatment.
Comparing Pollution Results from Statistical Analysis
Statistical analysis shows fundamental differences in pollution characteristics between the two regions:
Cadmium (Cd+2) and iron (Fe+3): These metals are the main pollutants in Zone 1 with a high average concentration (1.19 mg/L for cadmium and 3.84 mg/L for iron). In contrast, Zone 2 shows a lower average of these elements (3.79 mg/L for cadmium and 433.29 mg/L for iron) but suffers from enormous variation in iron concentration (standard deviation 425.92), indicating the presence of hotspots of severe pollution (Wedepohl, 1995). Lead (Pb+2) and Zinc (Zn+2): Zone 2 shows significantly higher contamination with lead (37.58 mg/L) and zinc (91.90 mg/L) compared to Zone 1 (20.46 and 58.07 mg/L, respectively). Standard deviation: A high standard deviation for most elements in Zone 1 (such as chromium and nickel) indicates heterogeneous pollution, while a low standard deviation for some elements in Zone 2 (such as lead) shows that the distribution of pollution is more homogeneous in that zone.
2 - Results of soil contamination models.
(A): Nemerow Pollution Index (PN).
Table 2 clarifies the pollution limitation of PN. Table 4 - Information provides an interpretation of the pollution levels of Nemerow Pollution Index PN: (EPA, 1989), (WHO, 2004).
Table 4:
Pollution levels of Nemerow Pollution Index PN
| Pollution level | PN |
|---|---|
| Low pollution | PN < 1 |
| Moderate pollution | 1 ≤ PN < 2 |
| High pollution | 2 ≤ PN < 3 |
| Very high pollution | PN ≥ 3 |
The values listed in the table help to understand the severity of contamination at the site and the need for environmental intervention based on the degree of contamination.
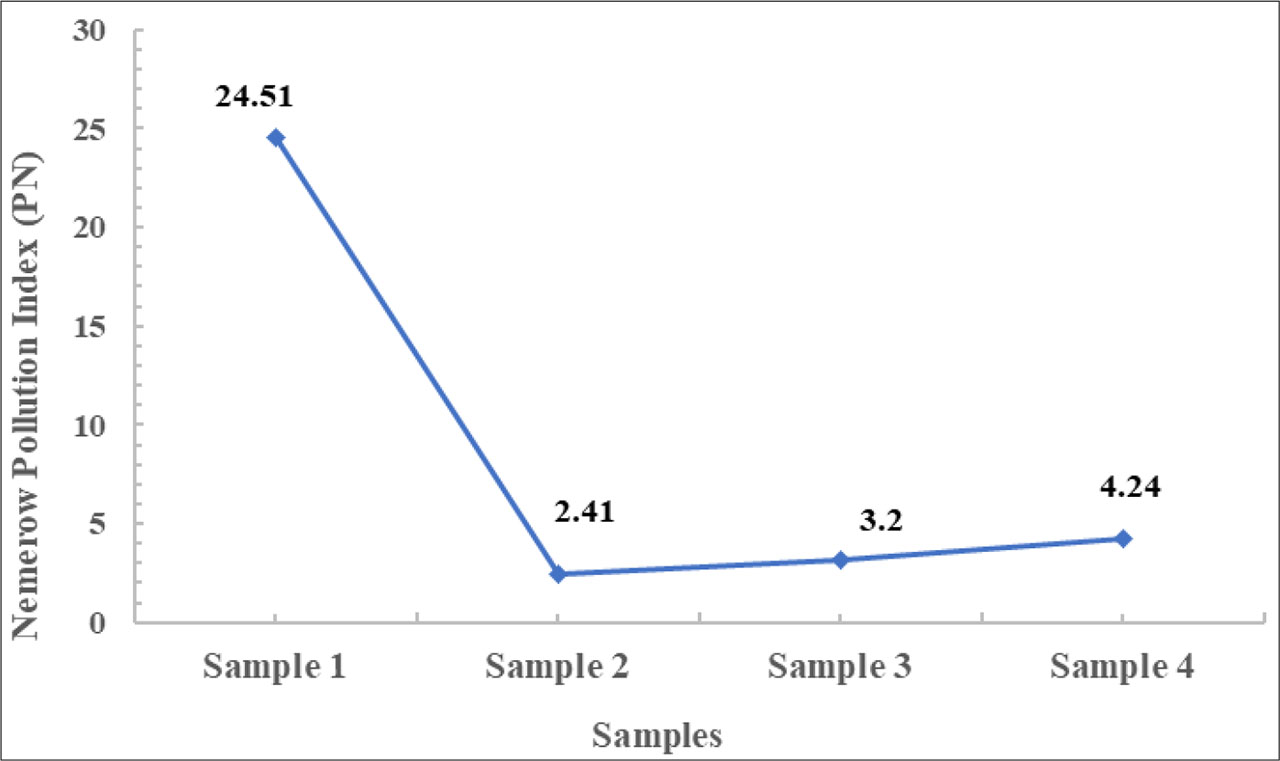
Figure 6:
Results of PN for the Ajeel oil field – Zone 1
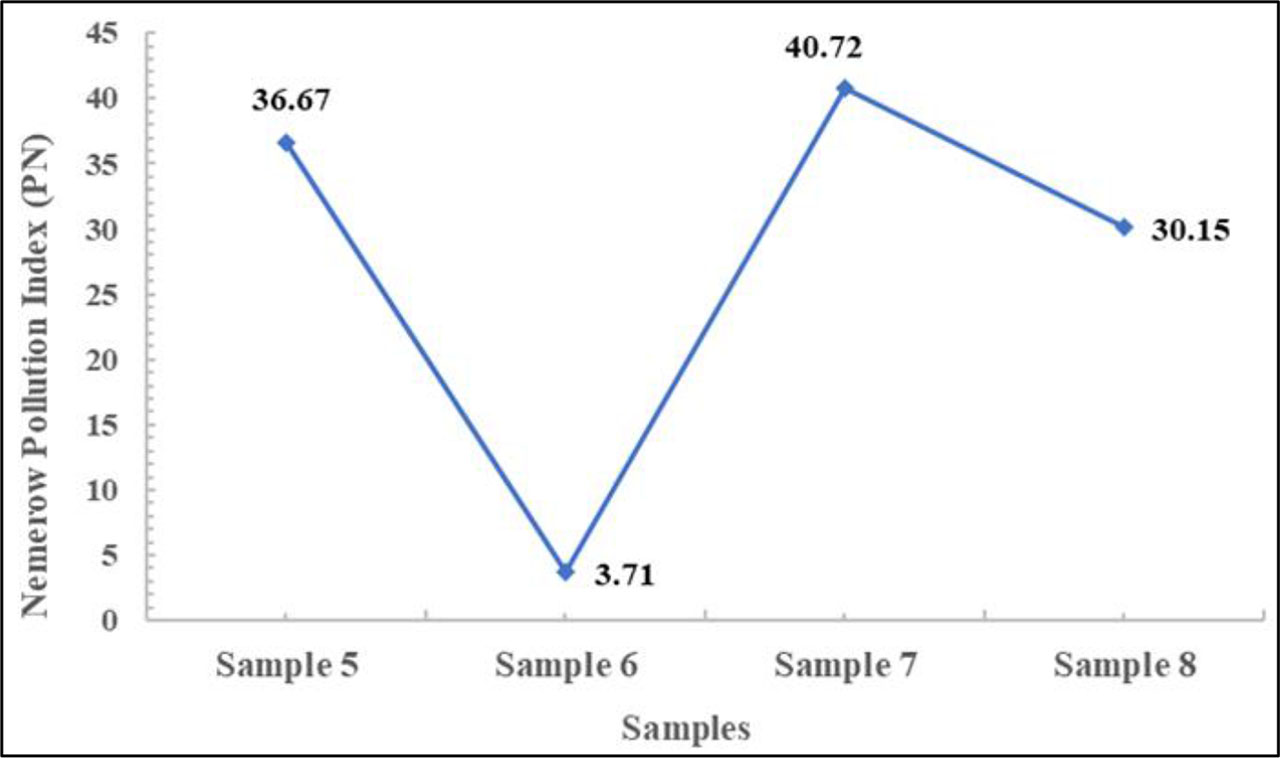
Figure 7:
Outcomes of pollution index PN – Ajeel oil field – Zone 2
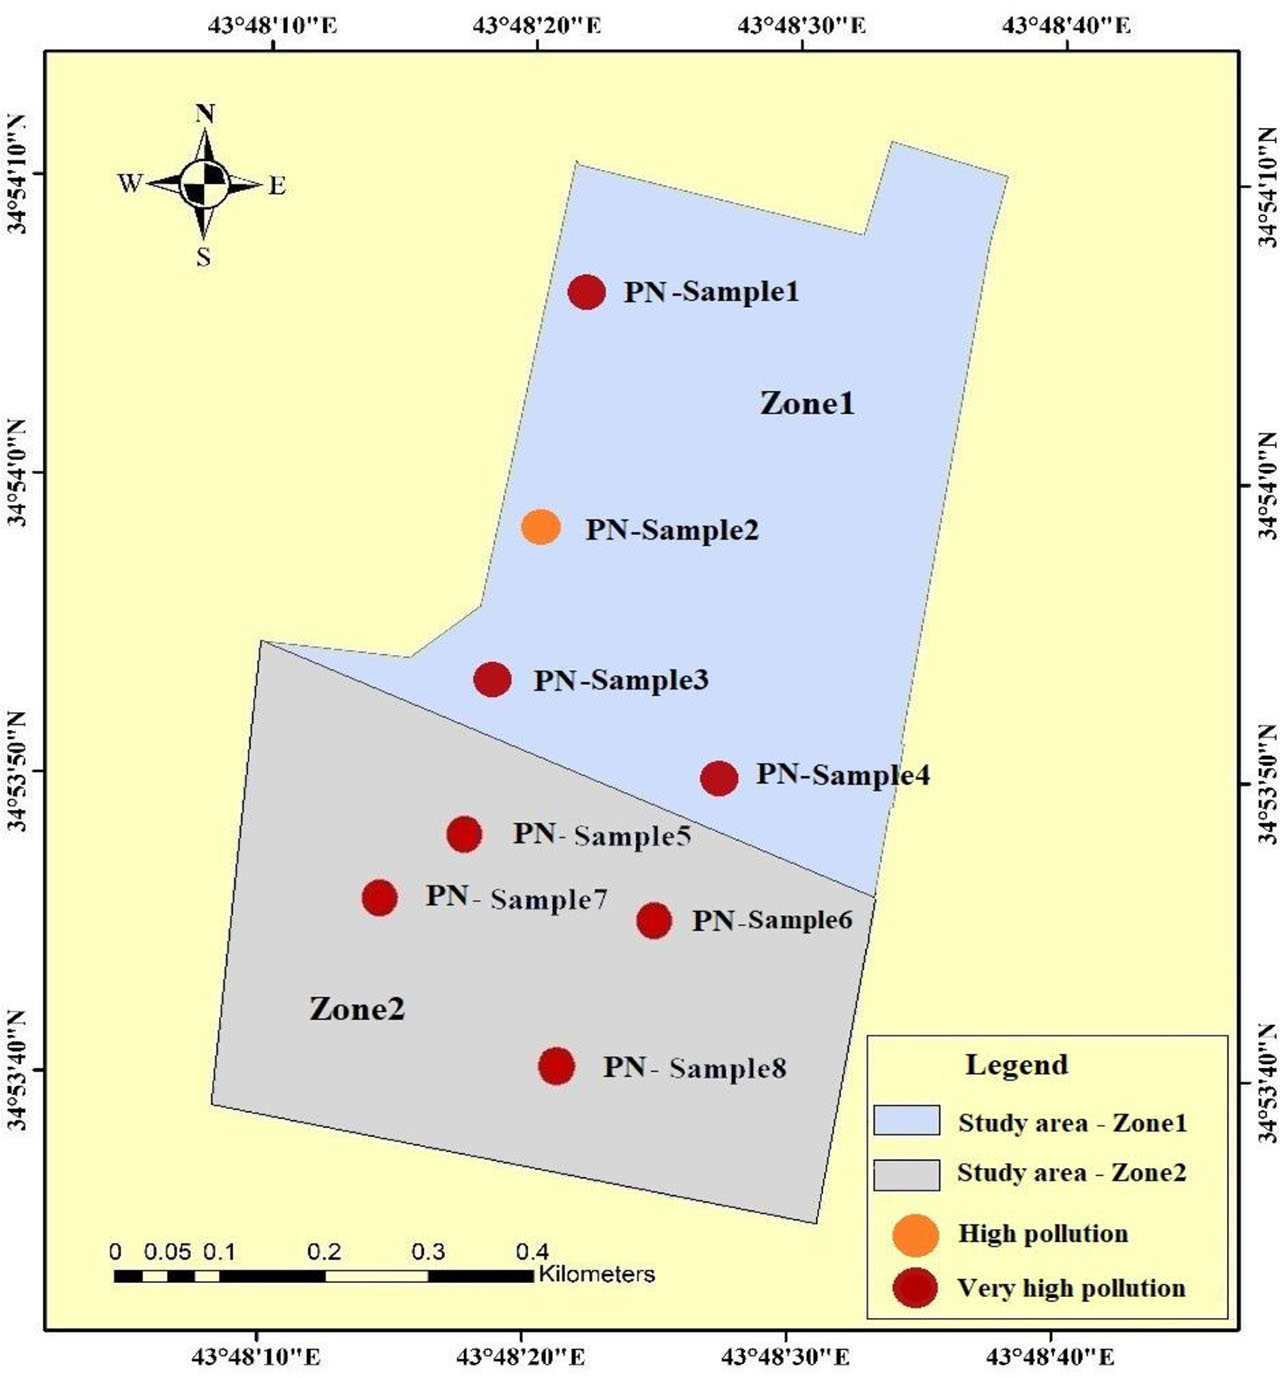
Figure 8:
Pollution level distribution map for Nemerow Pollution Index model in the Ajeel oil field
Figures 6 and 8 indicate vastly different pollution levels in area 1 of the Ajeel oil field. Sample1 (PN=24.51), this result indicates a pollution hotspot with high contamination. This value’s eight-fold excess above the severe pollution threshold indicates high pollutant concentrations. Oil spills or industrial waste may cause this. Samples 2, 3, and 4 (PN = 2.41, 3.2, 4.24): Moderate to severe pollution. Samples 3 and 4 show severe pollution, whereas 2 show moderate, yet they indicate an environmentally dangerous area that needs renovation. Zone 2 oil field Ajeel data show substantial pollution at most sites Figures 7 and 8. Samples 5, 7, and 8 (PN = 36.67, 40.72, 30.15): Leads to severe pollution. Pollution point rating is greatest for sample7 (40.72). These high and similar readings in three samples imply Zone 2 pollution affects many. Sample 6 (PN = 3.71), Zone 2’s lowest value is significantly contaminated. This value breaches pollution standards as “high pollution”. At certain spots and confronts widespread and serious environmental pollution that may be triggered by a huge oil spill or irresponsible garbage accumulation. This denotes a major pollution hotspot that needs quick care.
(B): Potential environmental risk index model (PRI).
Table 5 shows the levels limitations of PRI (Guan et al, 2014), while Figures 10 and 11 explain the results of PRI for Zone 1 and Zone 2 of Ajeel oil field.
Table 5:
Limitation of potential environmental index PRI
| Degree of risk | PRI value |
|---|---|
| Low risk | PRI≥50 |
| Moderate risk | 50 > PRI ≤ 100 |
| Considerable risk | 100> PRI ≥ 150 |
| Very high Risk | 150> PRI ≥ 200 |
| Extreme Risk | PRI>200 |
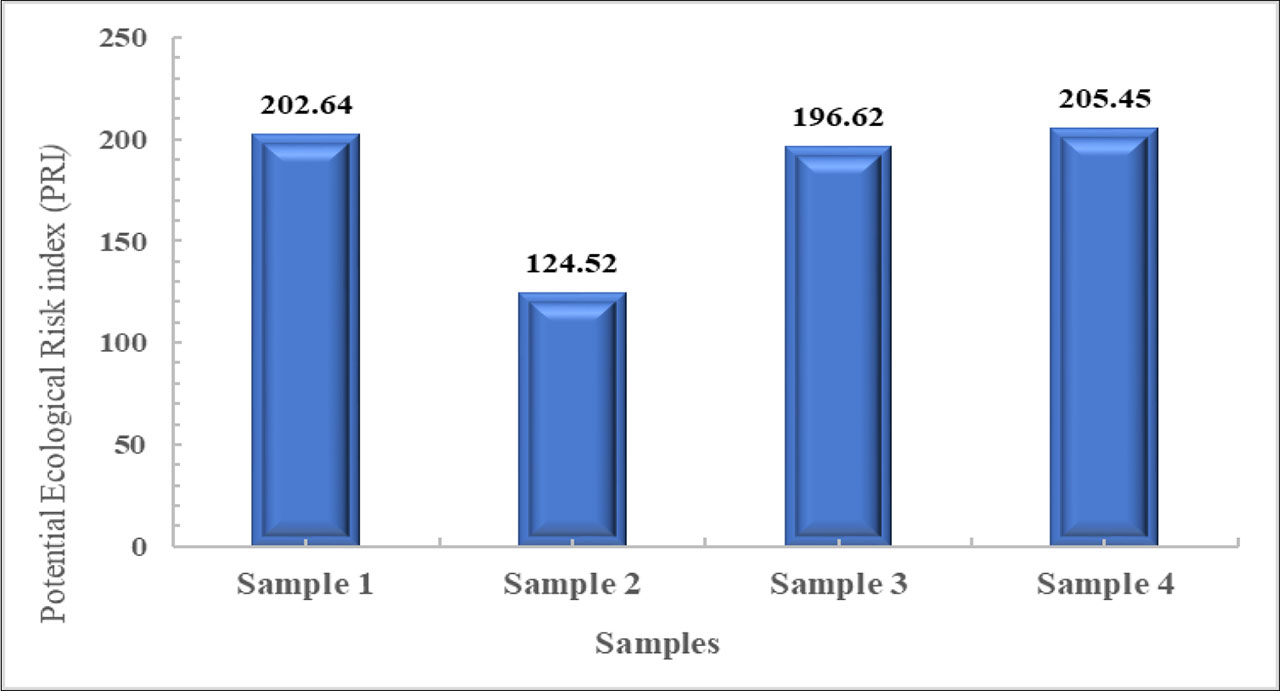
Figure 9:
PRI results of Ajeel oil field - Zone 1
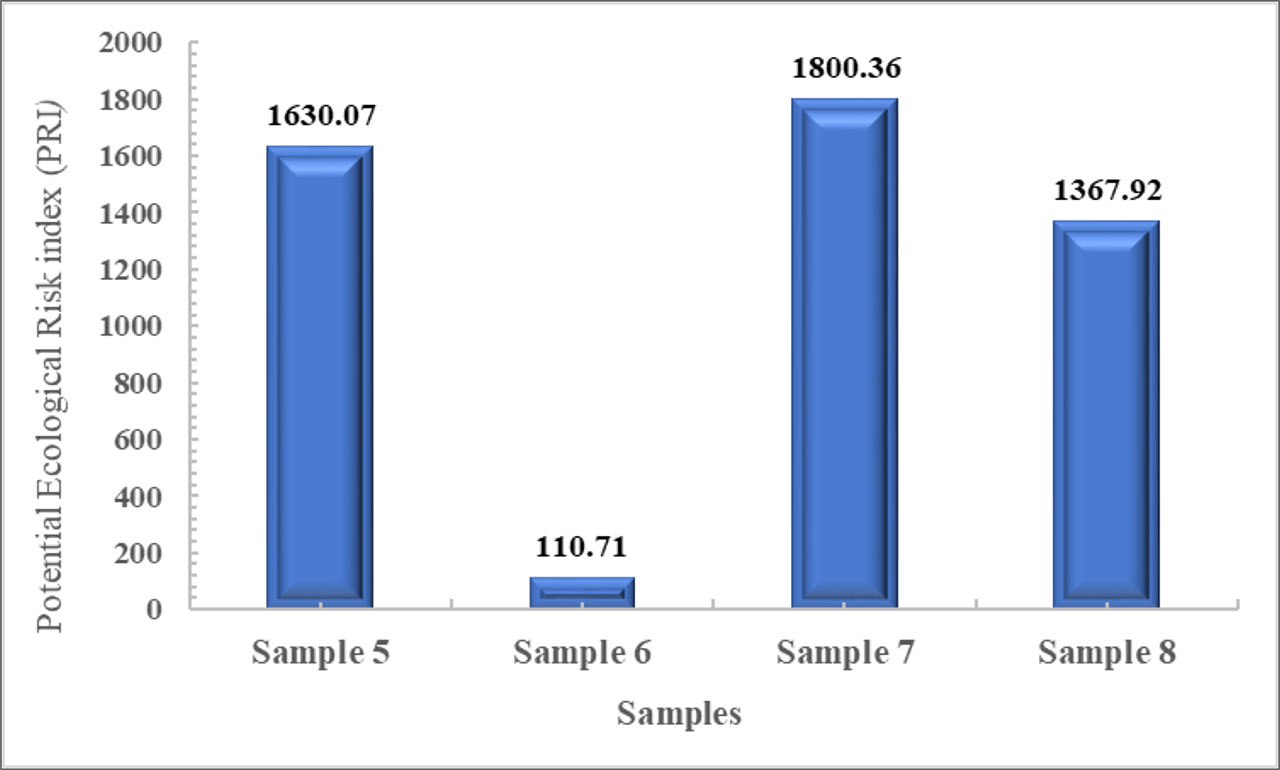
Figure 10:
Outcomes of PRI-Ajeel oil field - Zone 2
For Zone 1, and with mention to table, Figure 9, Figure 11, and Table 3, for the Ajeel oil field, it appears that samples taken from this Zone show varying levels of risk, where Sample1 with a PRI value of 202.64, this sample falls under the “Extreme Risk” classification because its value is greater than 200. Sample2 with a PRI value of 124.52, this sample is classified as “Considerable Risk,” as its value falls between 100 and 150. Sample 3: With a PRI value of 196.62, this sample is classified as “Very High Risk,” as its value falls between 150 and 200. Sample 4 with a PRI value of 205.45, this sample is also classified as “Extreme Risk” because its value is greater than 200. This difference in results within the same area illustrates that environmental pollution varies by place. Sample locations’ closeness to pollution sources, soil features, and groundwater flow patterns may explain this heterogeneity. This explanation matches researchers’ (Hattis and Burmaster, 1994). The mathematical model of the potential hazard index model depends on various variables that may affect some elements more than others, which may explain this variation.
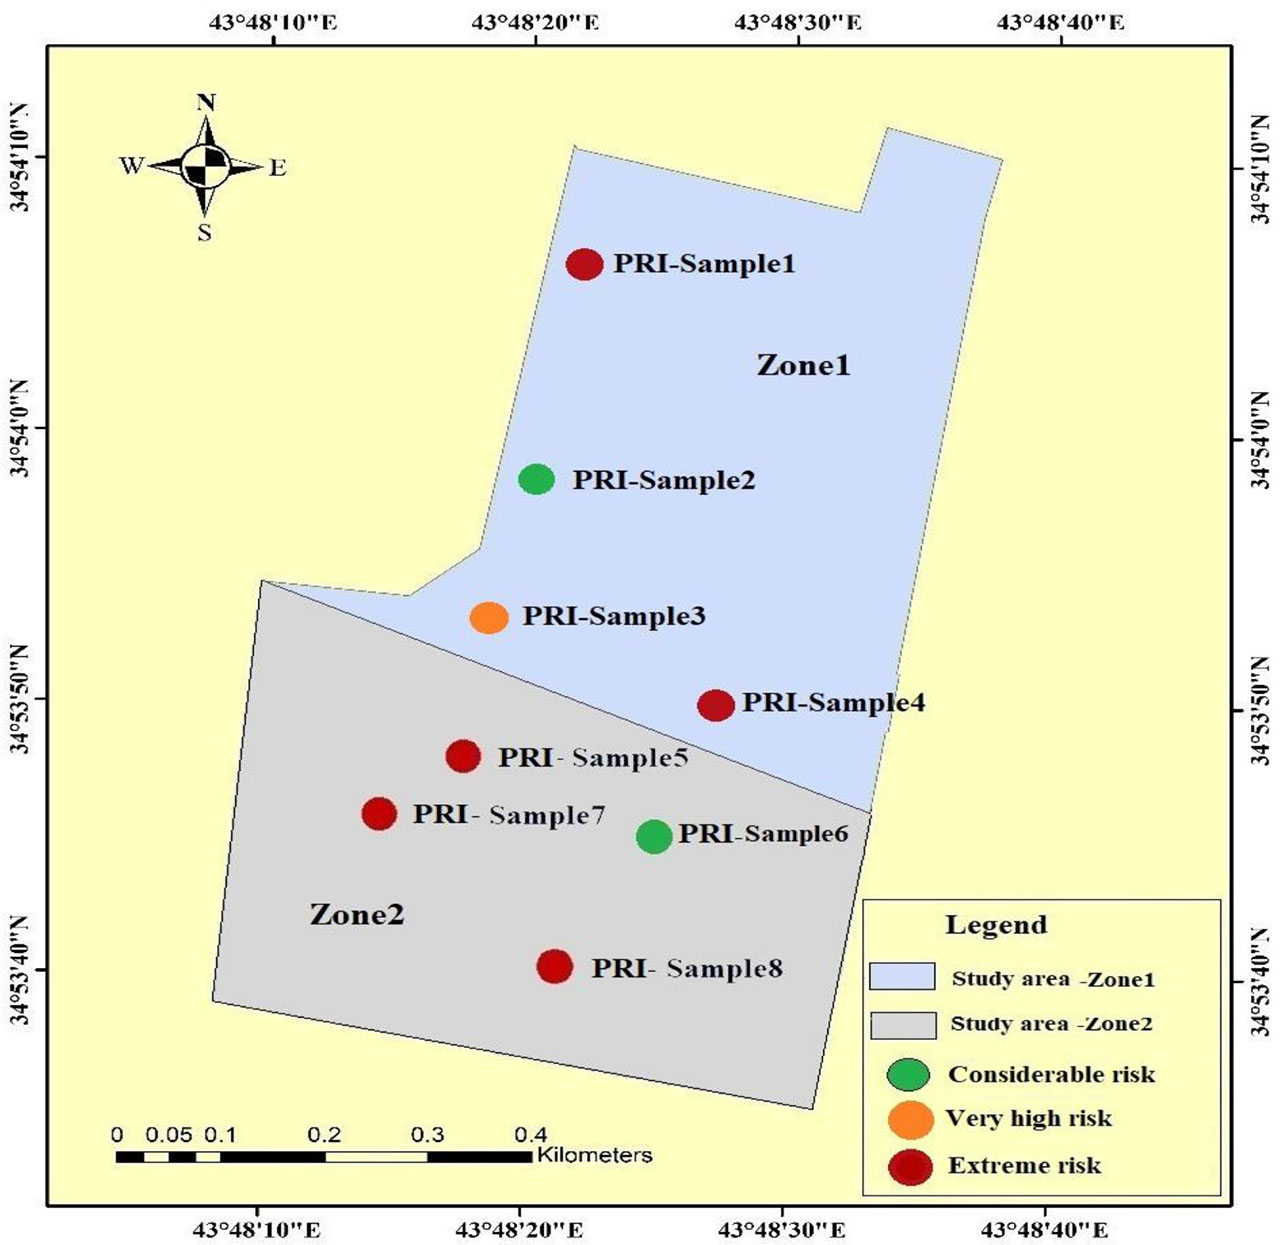
Figure 11:
Map of the distribution of PRI levels, model of environmental risk PRI of Ajeel oil field
For Zone 2, regarding the Ajeel oil field, referring to Figure 10, Figure 11, and table 3, the results for this zone show very high levels of risk, as: sample 5 with a PRI value of 1630.07, this sample is classified as “Extreme Risk.”. Sample 6: With a PRI value of 110.71, this sample is classified as “Considerable Risk.”. Sample 7: With a PRI value of 1800.36, this sample is classified as “Extreme Risk.”. Sample 8: With a PRI value of 1367.92, this sample is classified as “Extreme Risk. The results indicate that area 2 suffers from severe and widespread environmental pollution, especially in samples 5, 7, and 8, which recorded the highest PRI values. These high values indicate very high concentrations of pollutants, which may pose a significant threat to the environmental and living organisms in the area. The reason for this increase may be that the risk is cumulative and there has been no periodic monitoring of previous pollution (Chen et al., 2004). In general, in Ajeel oil field some samples have “extreme risk” and others “high risk” and “very high risk”.
Conclusions
1. Widespread pollution: The results clearly indicate that the soil in the Ajeel oil field is highly or very highly contaminated with heavy metals, according to the Nemerow Pollution Index (PN). These levels exceed safe limits and raise major environmental concerns.
2. Cadmium is the element that contributes significantly to overall pollution in most samples, recording the highest individual pollution index (PI) values in most cases.
Need for intervention: These high levels of pollution require urgent environmental intervention to reduce risks to human health and ecosystems.
3. Regarding the potential risk index PRI, it can be concluded that the results obtained from the Ajeel oil field indicate a danger to the environment, as in general, PRI values appear more prevalent than risks in the Ajeel oil field, especially in region 2, sample 7 (1800.36).
4. In general, the potential environmental risk index PRI values show a statement of risk levels within each site, indicating that pollution may not be homogeneous.
5. The high results of the potential environmental risk index for the Ajeel oil field lead to an urgent need for effective environmental remediation programs to reduce pollution in the affected contaminated areas and rehabilitate the areas.
6. Lead is a stable environmental pollutant that accumulates in soil and plants and transfers to humans through food, causing significant health damage including brain damage, increased blood pressure, kidney failure, and reproductive system harm.
7. Cadmium poses an environmental hazard due to its accumulation in soil. Its serious health effects on humans include kidney damage and severe bone pain. It is classified by the International Agency for Research on Cancer as a Group 1 carcinogen.
8. Chromium, causing contamination of surface and groundwater and reducing agricultural productivity, leading to significant environmental damage. On the health front, its effects on humans are severe, causing respiratory cancer and major skin damage, with high exposure potentially resulting in liver and kidney damage.
9. Exceeding permissible zinc levels leads to soil and water contamination, reducing soil fertility and harming microorganisms, which is the environmental impact. On the health side, high zinc exposure causes anemia, digestive problems, weakened immunity, and copper deficiency in the body.
10. Environmentally, arsenic contaminates groundwater and bio accumulates in the food chain, especially in crops, posing a threat to living organisms. From a health perspective, it is classified as a confirmed human carcinogen causing skin, lung, and bladder cancers, along with distinctive skin lesions.
Acknowledgements
We would like to express our deepest gratitude and thanks to the staff of the chemical engineering and environmental engineering departments laboratories at the University of Tikrit, as well as the staff of the Northern Refineries company laboratories in the oil ministry of Iraq, for their cooperation in completing the tests for this research.