

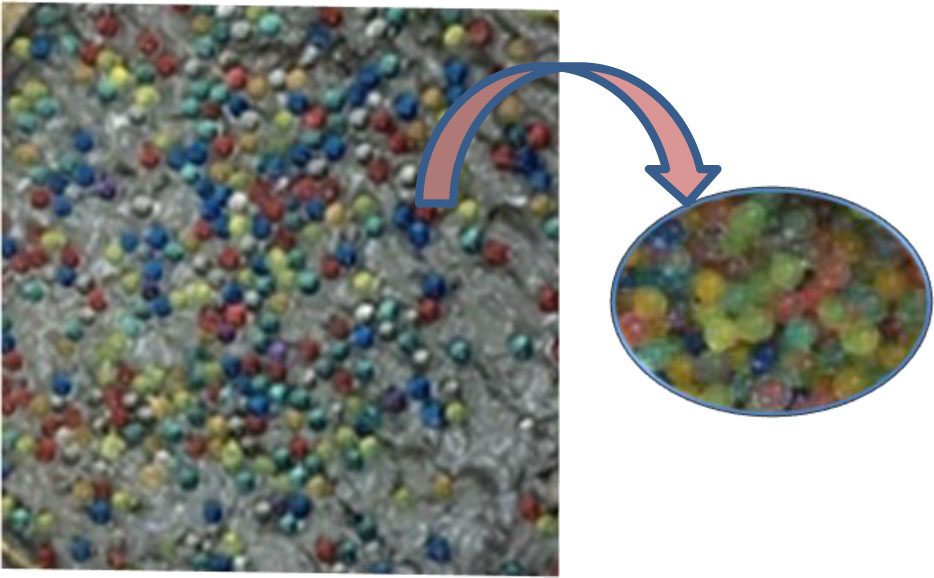
Figure 1:
Water absorption polymer balls (WAPB) in concrete mixes
Table 1:
Polypropylene fibre characteristics
| Characteristics | PP |
|---|---|
| Diameter [µm] | 0.032 |
| Length [mm] | 12 |
| Elongation [%] | 10 |
| Tensile strength [MPa] | 600 – 700 |
| Modulus of elasticity [GPa] | 36 |
| Shape | Straight |
| Density [kg/m3] | 910 |
| Colour | White |
Table 2:
Properties of superplasticizer
| Properties | Description |
|---|---|
| Commercial name | ViscoCrete-180 GS |
| PH | 4–6 |
| Colour | Light brownish liquid |
| Chloride content | Nil |
| Specific gravity, [g/cm3] | 1.070 |
Table 3:
The mix proportions for 65 MPa
| Material | Ref. mix | 1% PP fibre mix | WAPB mix | Hybrid mix |
|---|---|---|---|---|
| Cement [kg/m3] | 450 | 450 | 450 | 450 |
| Sand [kg/m3] | 760 | 760 | 760 | 760 |
| Coarse aggregate [kg/m3] | 810 | 810 | 810 | 810 |
| Silica Fume [kg/m3] | 50 | 50 | 50 | 50 |
| w/b | 0.35 | 0.35 | 0.35 | 0.35 |
| Superplasticizer% | 1.5 | 1.5 | 1 | 1 |
| PP fibres% | - | 1.0 | - | 1.0 |
| WAPB% | - | - | 5 | 5 |
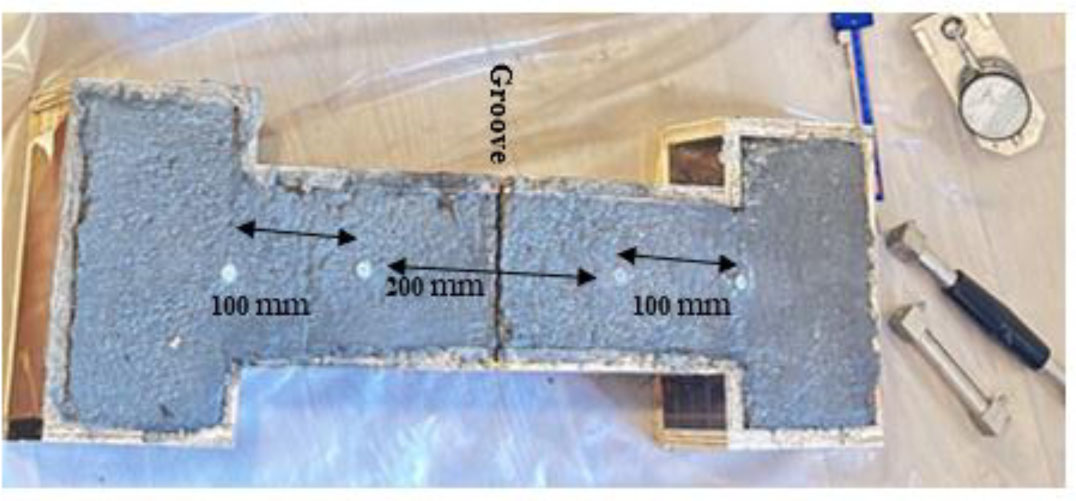
Figure 2:
Specimen for autogenous shrinkage testing
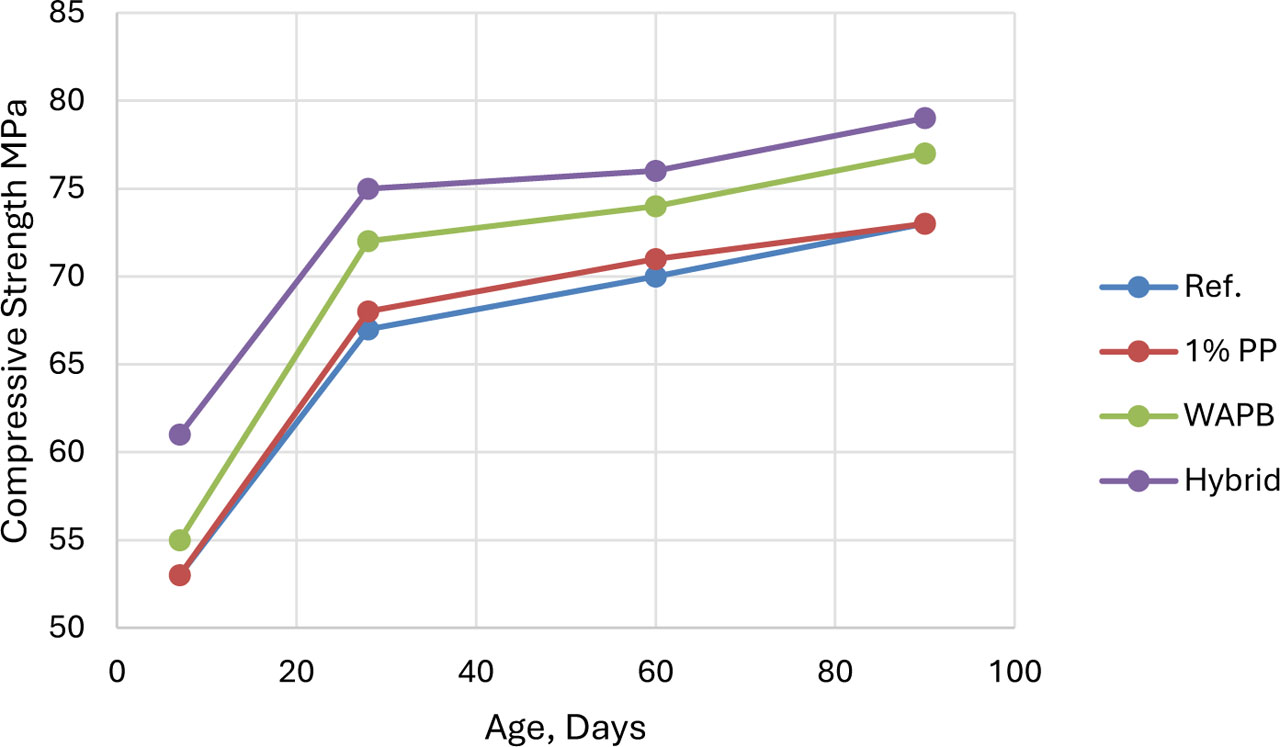
Figure 3:
Compressive strength development of different mixes with time
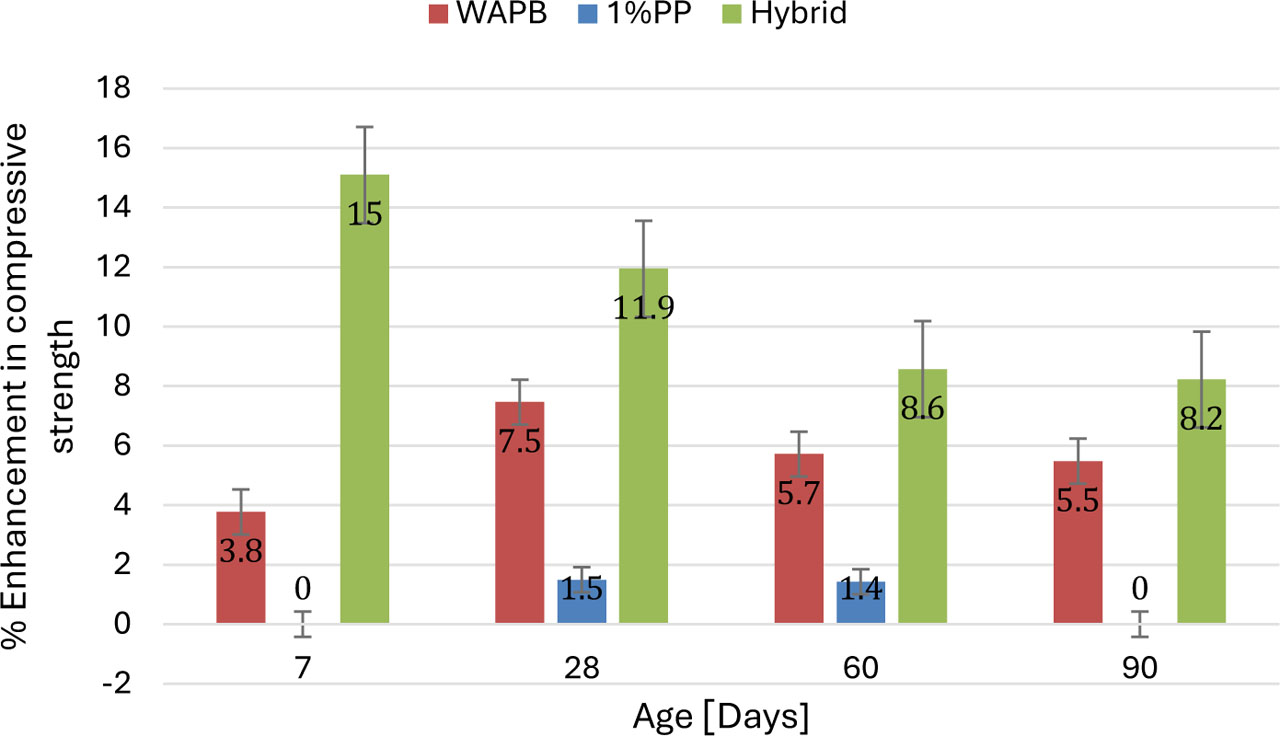
Figure 4:
% Enhancement and standard errors in compressive strength with age compared to the reference mix
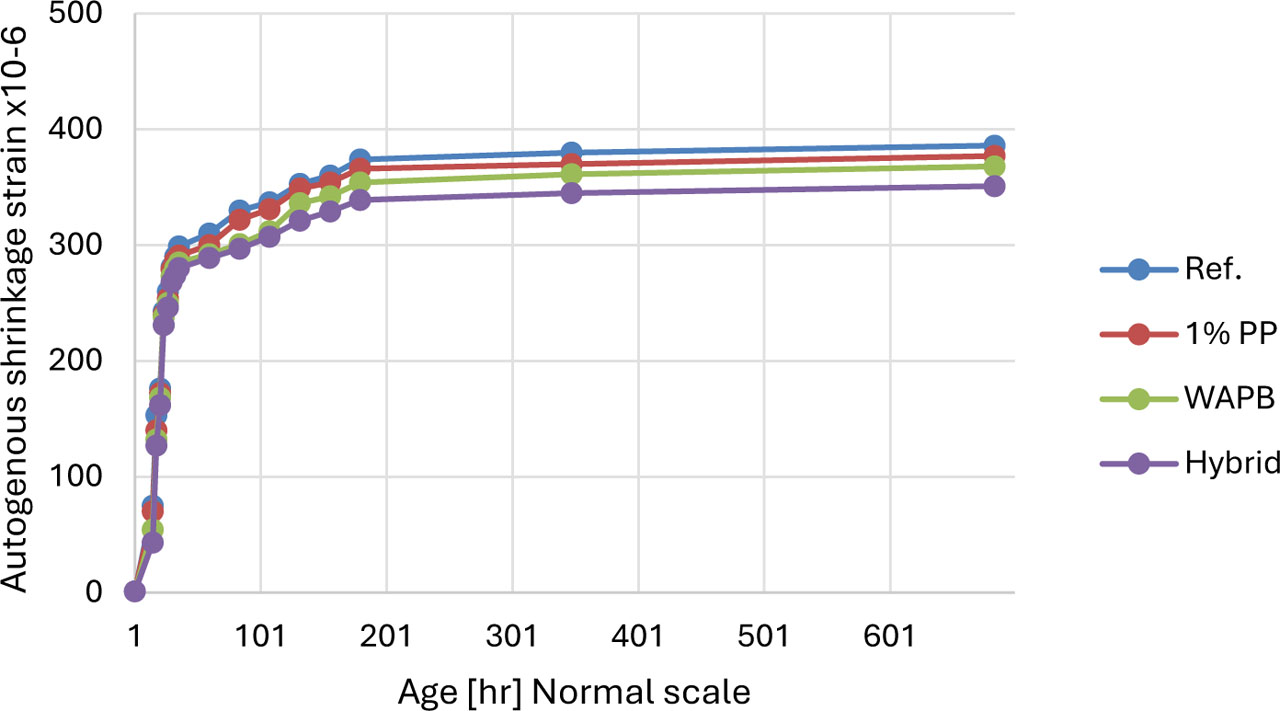
Figure 5:
The expansion zone [200 mm] of the autogenous shrinkage test
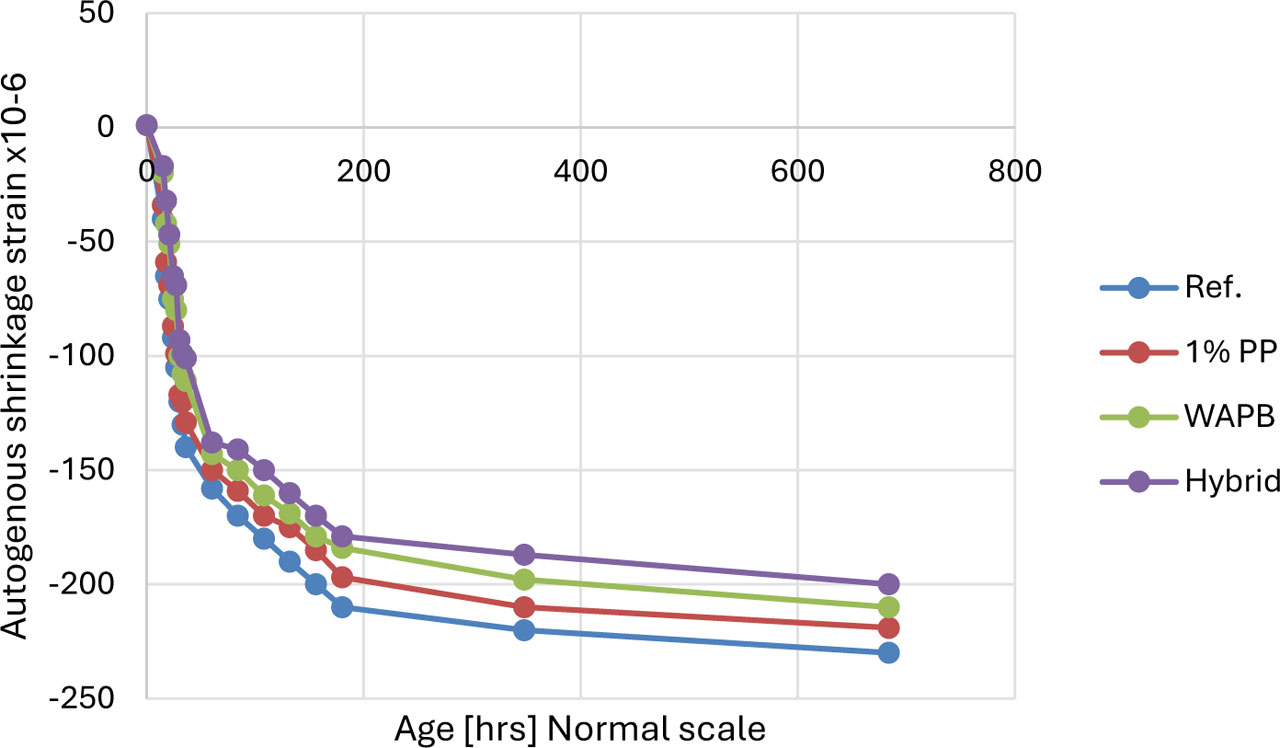
Figure 6:
The contraction zone [100mm] of the autogenous shrinkage test
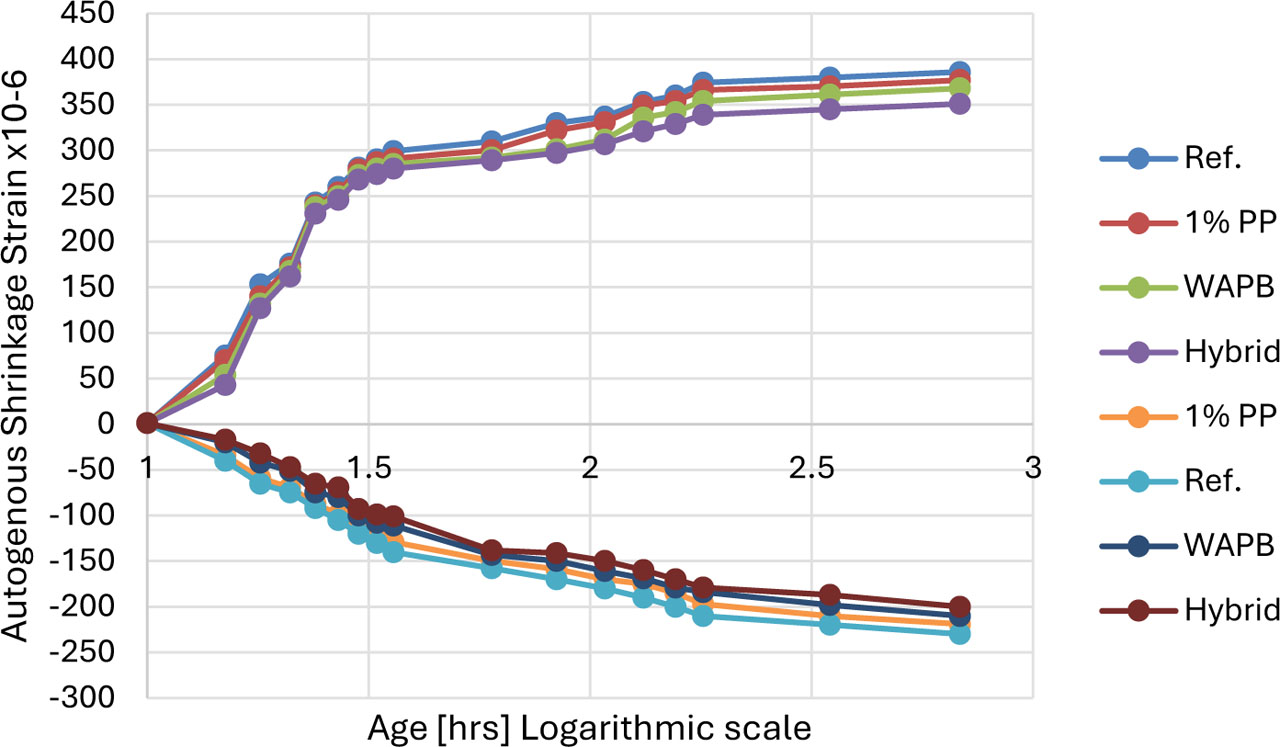
Figure 7:
Autogenous shrinkage of the mixes with Age for both expansion and contraction zones
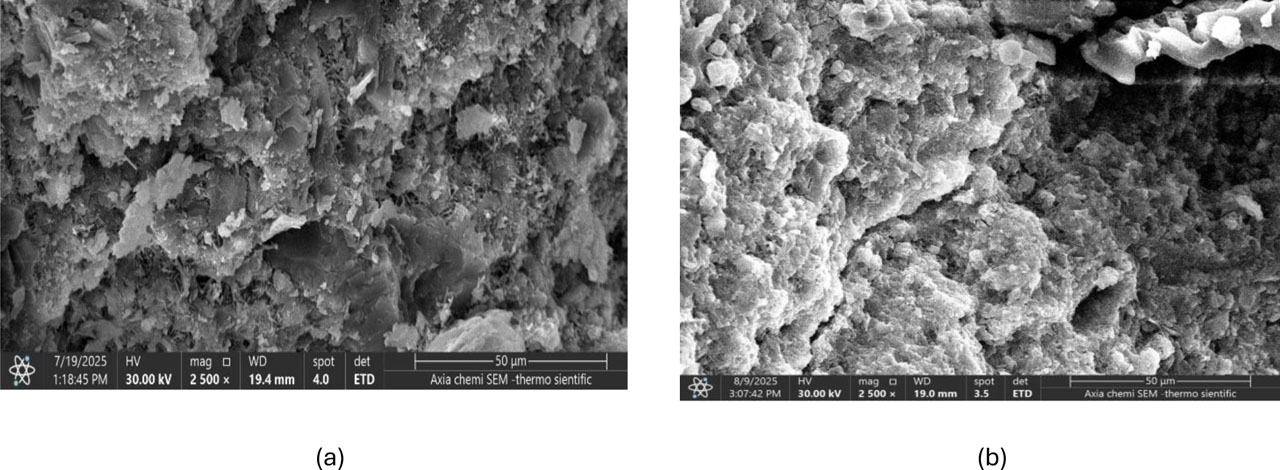
Figure 8:
SEM images declare the enhancement in the microstructure of concrete when using WAPB