

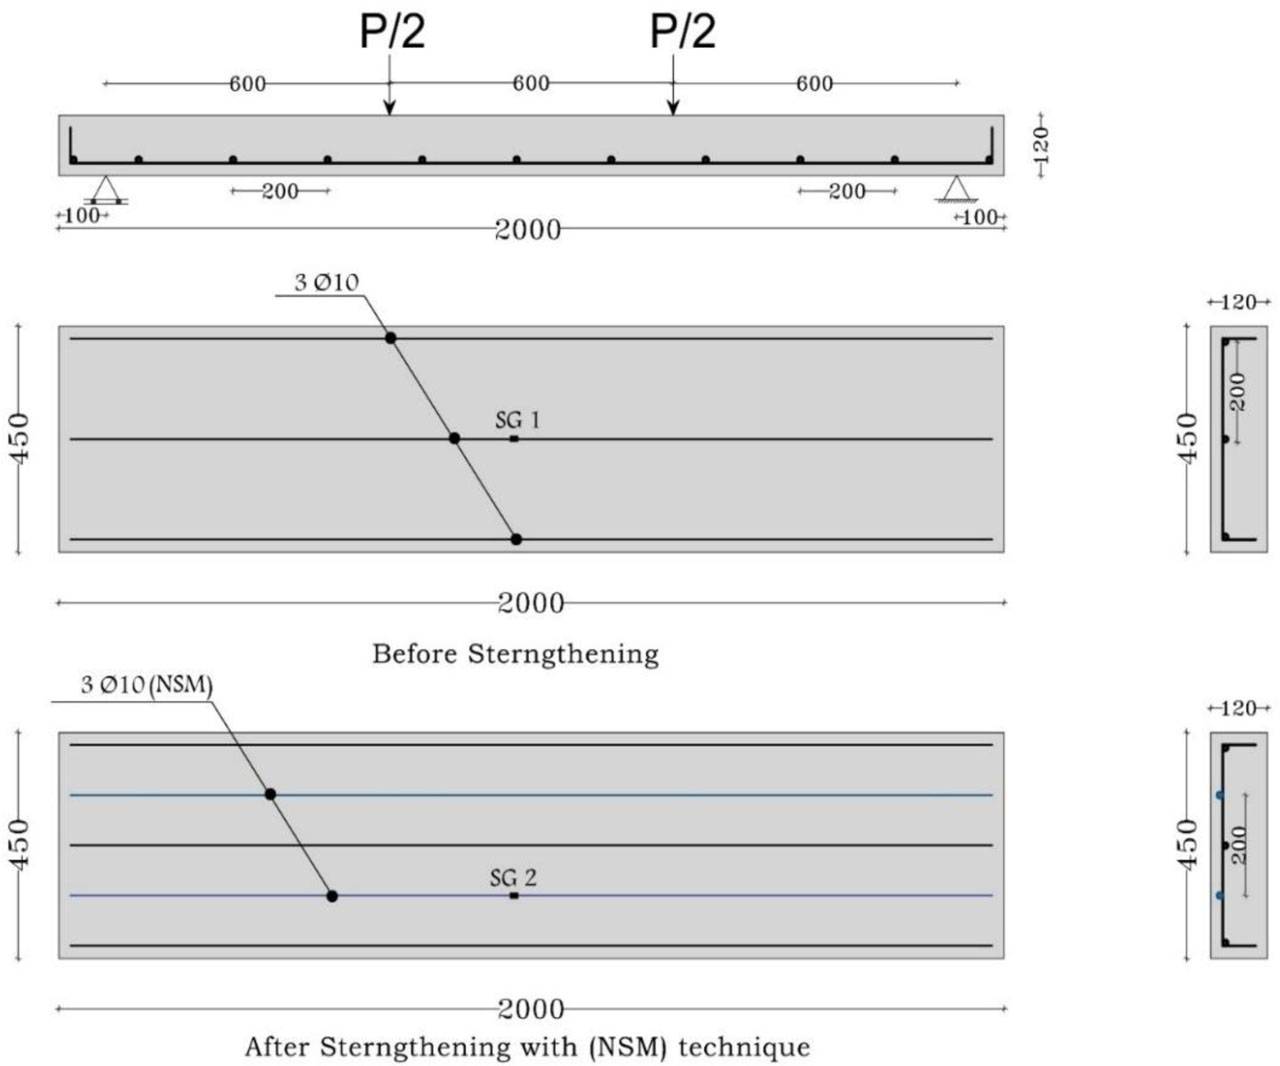
Figure 1:
Details of reinforcement of tested slabs before and after strengthening
Table 1:
Data of tested slabs
| Slab ID | Type of loading | Repeated loading (kN) * | (fc) MPa | (f′c) MPa | (NSM) Strengthening system description |
|---|---|---|---|---|---|
| CSS | Static | ------- | 35 | 30 | Control slab |
| FCS | ------- | 34 | 29 | 2 (Carbon FRP) bars, ϕ 10mm | |
| FGS | ------- | 37 | 32 | 2 (Glass FRP) bars, ϕ 10mm | |
| FBS | ------- | 34 | 29 | 2 (Basalt FRP) bars, ϕ 10mm | |
| SS | ------- | 38 | 33 | 2 Steel reinforcing bars, ϕ 10mm | |
| CSR | Repeated | 30 | 35 | 30 | Control slab |
| FCR | 60 | 34 | 29 | 2 (Carbon FRP) bars, ϕ 10mm | |
| FGR | 52.8 | 37 | 32 | 2 (Glass FRP) bars, ϕ 10mm | |
| FBR | 44.75 | 34 | 29 | 2 (Basalt FRP) bars, ϕ 10mm | |
| SR | 51.25 | 38 | 33 | 2 Steel reinforcing bars, ϕ 10mm |
Table 2:
Mix the amount of concrete
| Compressive strength target [MPa] | Compressive strength as measured [MPa] | The ratio of water to cement | Cement [kg/m3] | Sand [kg/m3] | Gravel [kg/m3] | Water [kg or litres] |
|---|---|---|---|---|---|---|
| 35 | 35.6 | 0.43 | 450 | 567.74 | 1135.47 | 193.5 |
Table 3:
Characteristics of mix design
| Property | Experimentally | ACI 318 M (2019) |
|---|---|---|
| Strength in compression (ƒ’c) [MPa] | 30.6 | --- |
| Tensile splitting strength (f ‘ct) [MPa] | 2.93 | 2.76 (0.5√f′c) |
| Rupture modulus (f r) [MPa] | 5.93 | 3.43 (0.62√f′c) |
| Elasticity modulus (Ec) [GPa] | 26 | (4700√ f′c) |
Table 4:
Results of steel and FRP bars’ tensile tests
| Property | Steel | CFRP | GFRP | BFRP |
|---|---|---|---|---|
| Yield strength [MPa] | 560 | ----- | ----- | ----- |
| Ultimate strength [MPa] | 700 | 1600 | 1200 | 1100 |
| Elasticity modulus [GPa] | 200 | 130 | 47.5 | 41 |
Table 5:
Epoxy resin’s mechanical characteristics
| Properties at 7days and 25°C | |
|---|---|
| Strength of tensile [MPa] | ≥ 30 |
| Elasticity modulus [MPa] | 10000 |
| Strength in compression [MPa] | ≥ 80 |
| Strength of bond [MPa] | ≥ 4 |
| Ratio of mixing | 3.34A:1B |
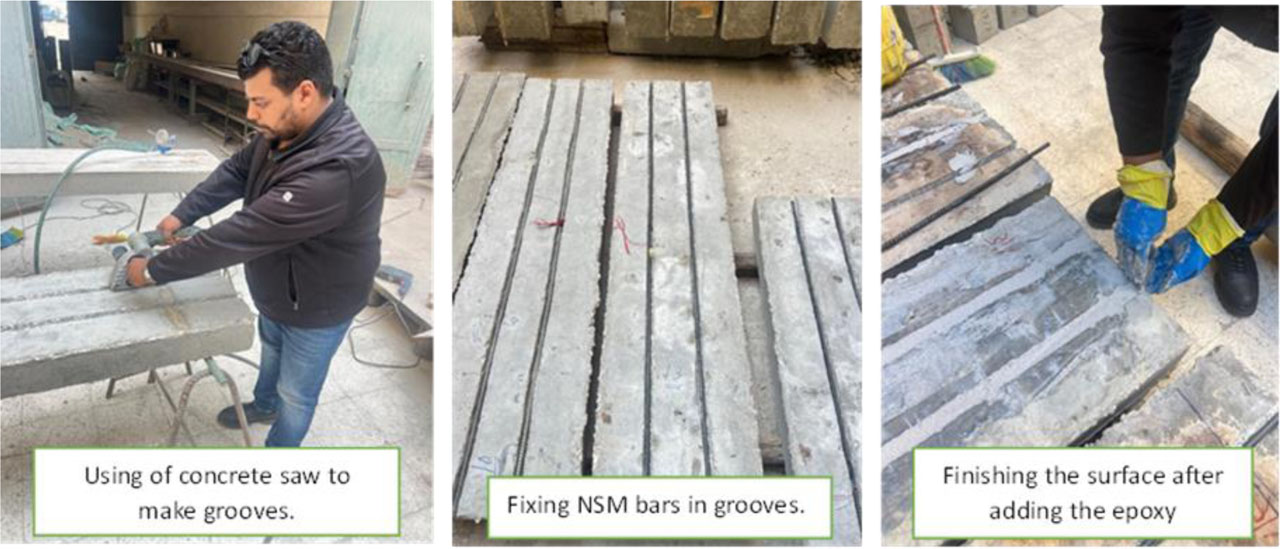
Figure 2:
Preparation of strengthened slabs with different NSM bars
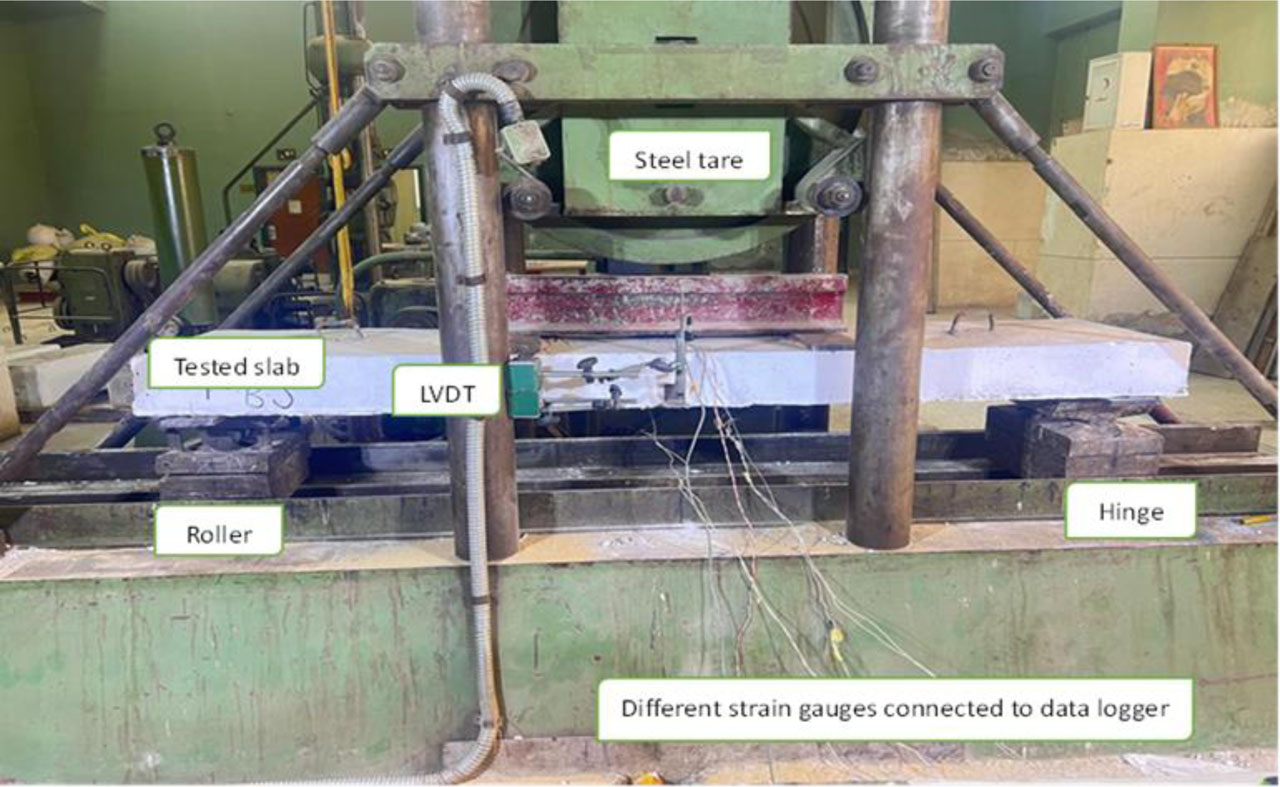
Figure 3:
Test set up
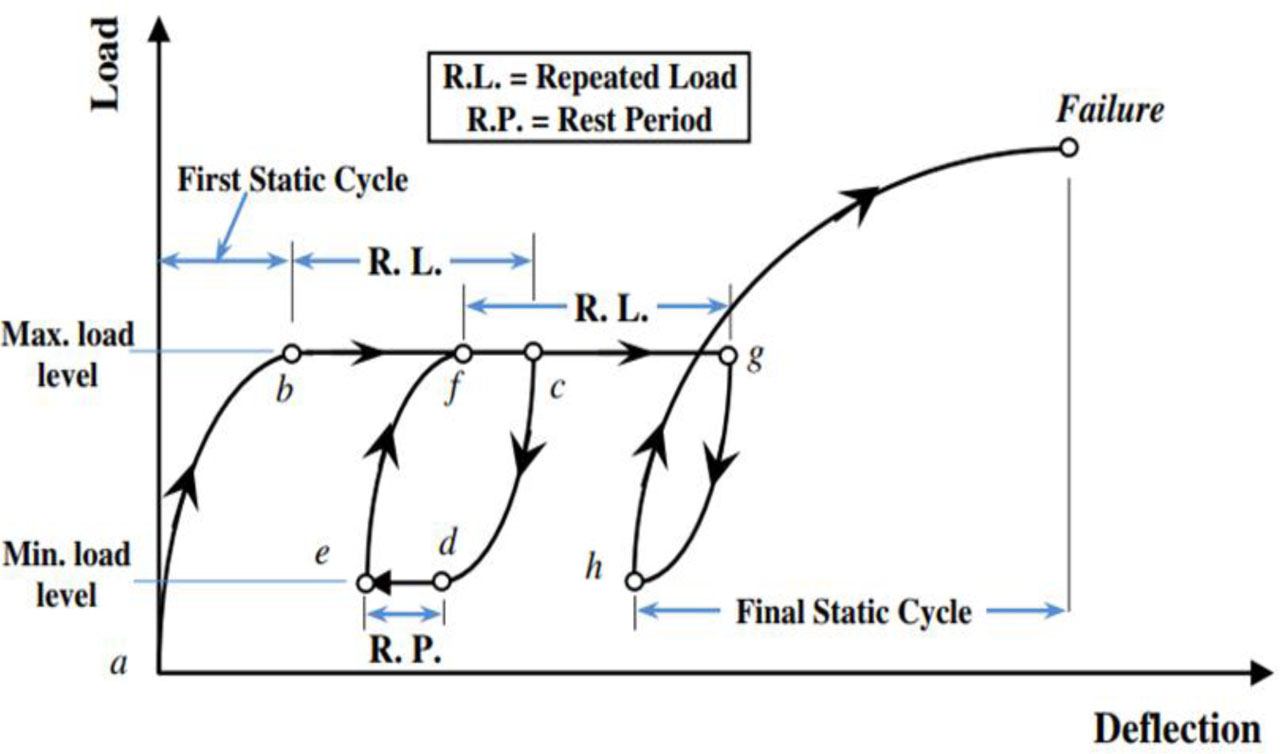
Figure 4:
Sketch of sequence of loading versus deformation [1]
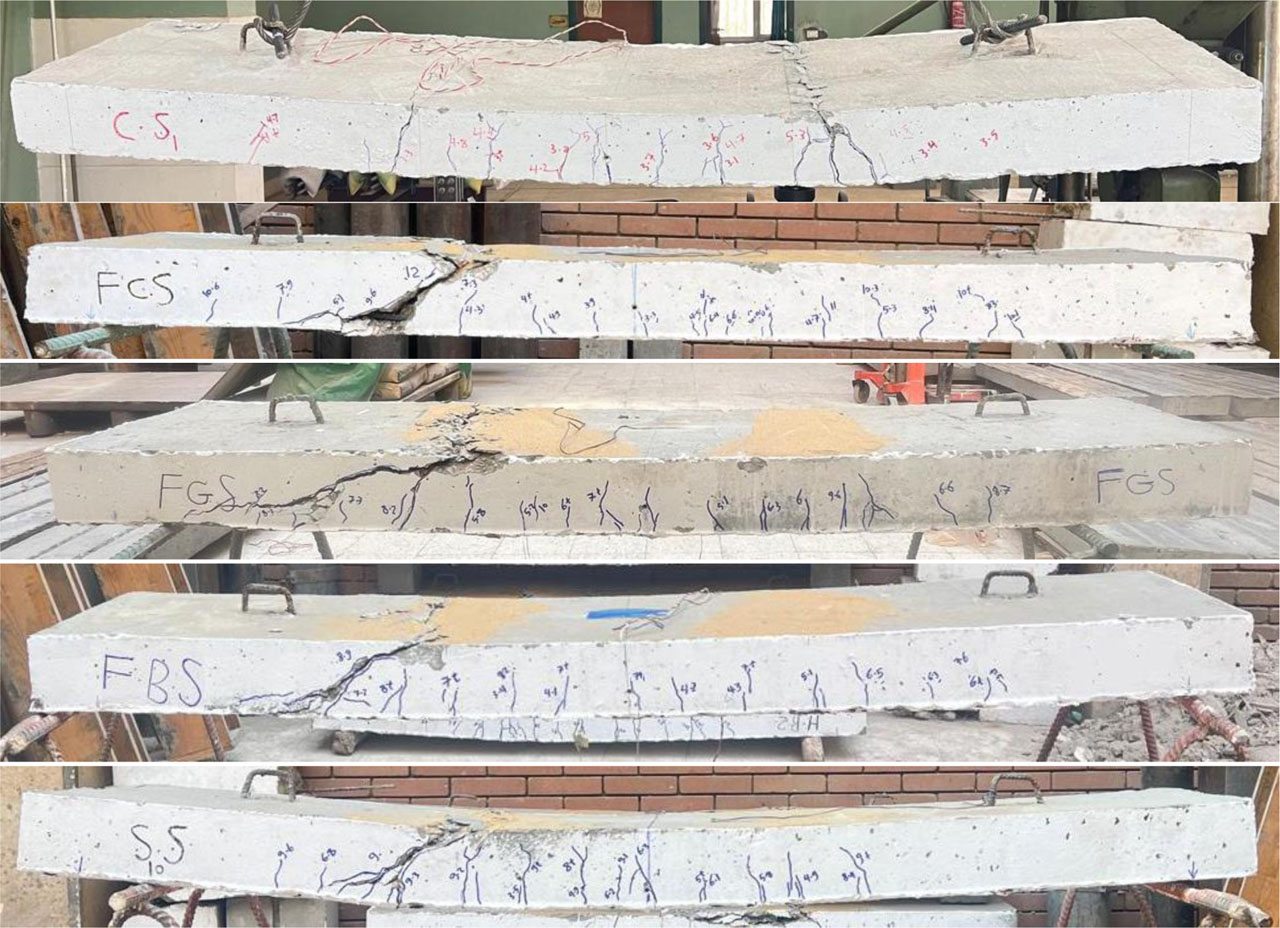
Figure 5:
Cracks pattern of slabs tested under static loading
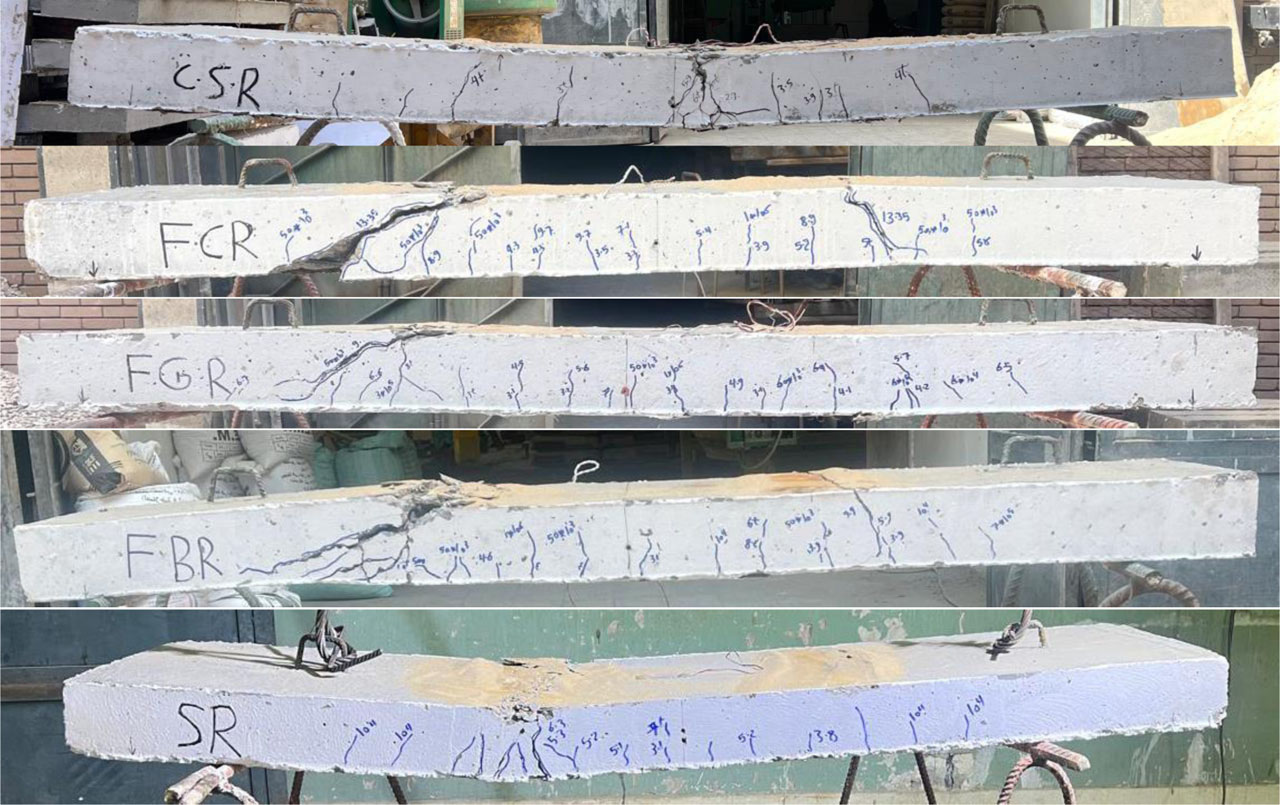
Figure 6:
Cracks pattern of slabs tested under repeated loading.
Table 6:
Summary of the static and repeated tests in terms of loads and deflection
| Slab ID | Cracking load Pcr (KN) | Service load Pser (KN) | Yielding load Py (KN) | Ultimate load Pmax (KN) | R % | Δref | Δref % | Failure type |
|---|---|---|---|---|---|---|---|---|
| CSS | 31 | 36 | 26.7 | 60 | ------- | 45.44 | ------ | Flexure |
| FCS | 33 | 48 | 81.13 | 120 | 100 | 9.9 | 78.21 | Flexure-shear |
| FGS | 33 | 50 | 74 | 105.6 | 76 | 9.7 | 78.75 | Flexure-shear |
| FBS | 34 | 45 | 41.7 | 89.5 | 49.33 | 11.6 | 74.47 | Flexure-shear |
| SS | 35 | 58 | 77.7 | 102.5 | 70.83 | 7.5 | 83.5 | Flexure-shear |
| CSR | 32 | 31.2 | 25.8 | 61.53 | 2.5 | 43 | 5.4 | Flexure |
| FCR | 33 | 55 | 78.2 | 133.51 | 122.52 | 12.9 | 71.61 | Flexure-shear |
| FGR | 30 | 42 | 52.6 | 89.44 | 49.1 | 23.7 | 47.84 | Flexure-shear |
| FBR | 30 | 54 | 31.9 | 96.81 | 61.35 | 12.55 | 72.38 | Flexure-shear |
| SR | 31 | 50 | 28.3 | 73.06 | 21.77 | 20.8 | 54.23 | Flexure |
Table 7:
Ductility index of the tested slabs
| Slab ID | Δ y (mm) | Δ u (mm) | ΔI | ΔInor |
|---|---|---|---|---|
| CSS | 4.3 | 45.44 | 10.56 | 1 |
| FCS | 14.75 | 33.8 | 2.29 | 0.22 |
| FGS | 14.2 | 43.5 | 2.92 | 0.28 |
| FBS | 6.2 | 36.65 | 5.91 | 0.56 |
| SS | 10.6 | 51.45 | 4.85 | 0.46 |
| CSR | 4.5 | 51.25 | 8.78 | 0.83 |
| FCR | 15.15 | 36.55 | 2.41 | 0.23 |
| FGR | 21.85 | 43.55 | 2.00 | 0.19 |
| FBR | 7.4 | 48 | 6.6 | 0.625 |
| SR | 8.9 | 50.9 | 5.72 | 0.54 |
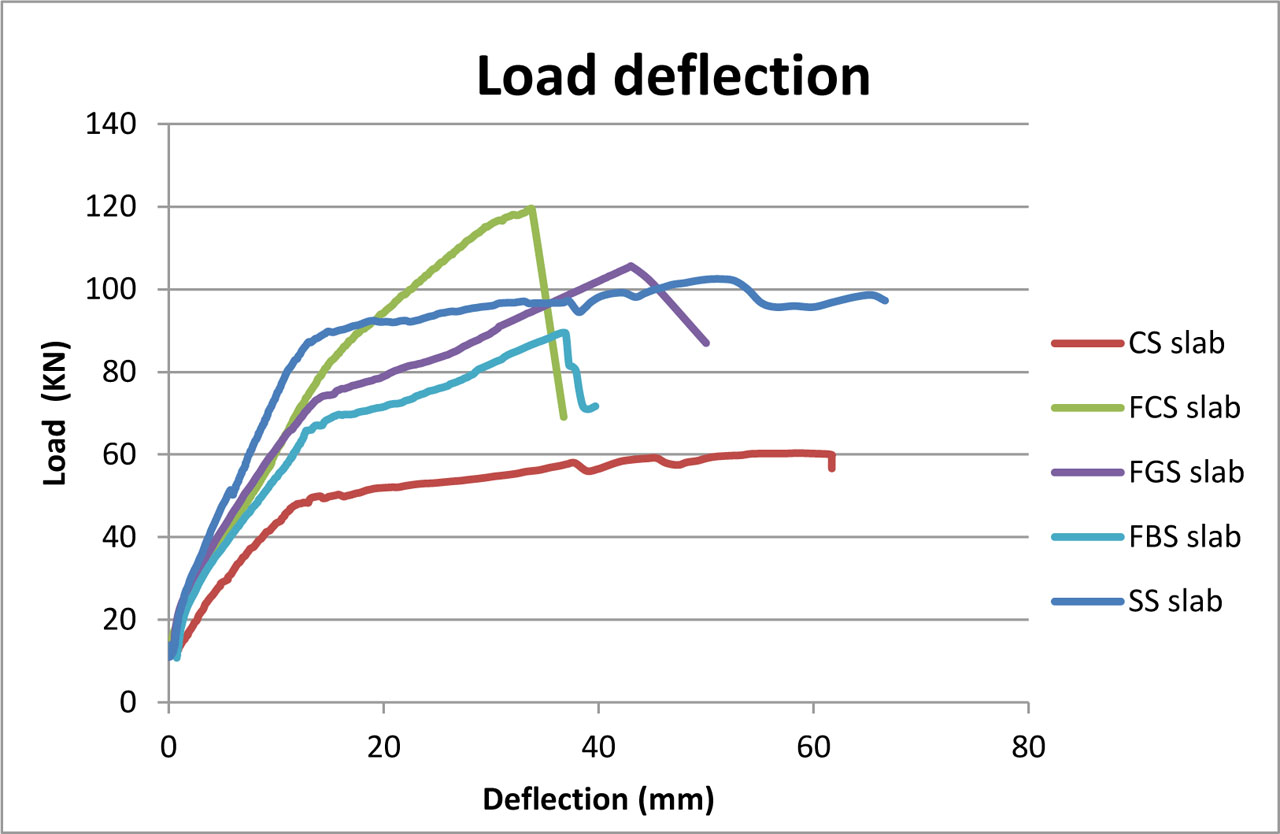
Figure 7:
Comparison between Load mid-span deflection for slabs tested statically
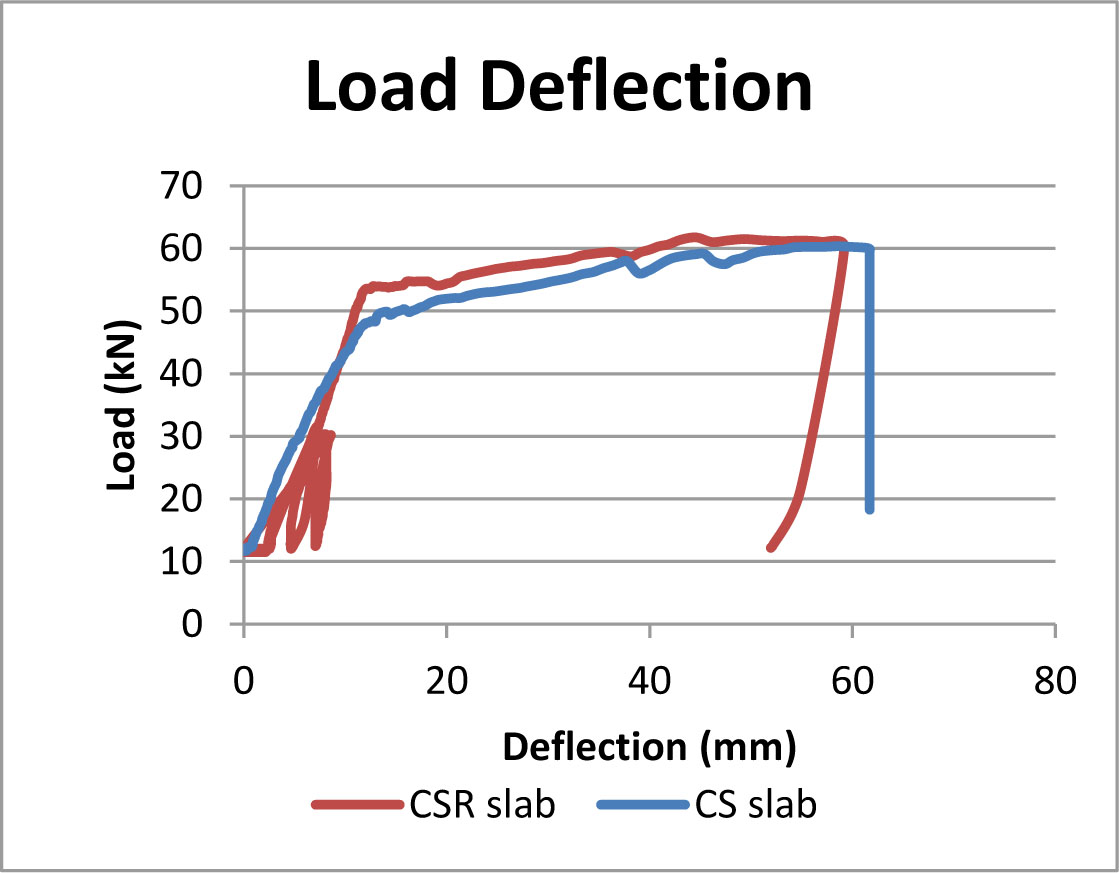
Figure 8:
Load mid-span deflection for slabs tested under repeated load and those tested statically
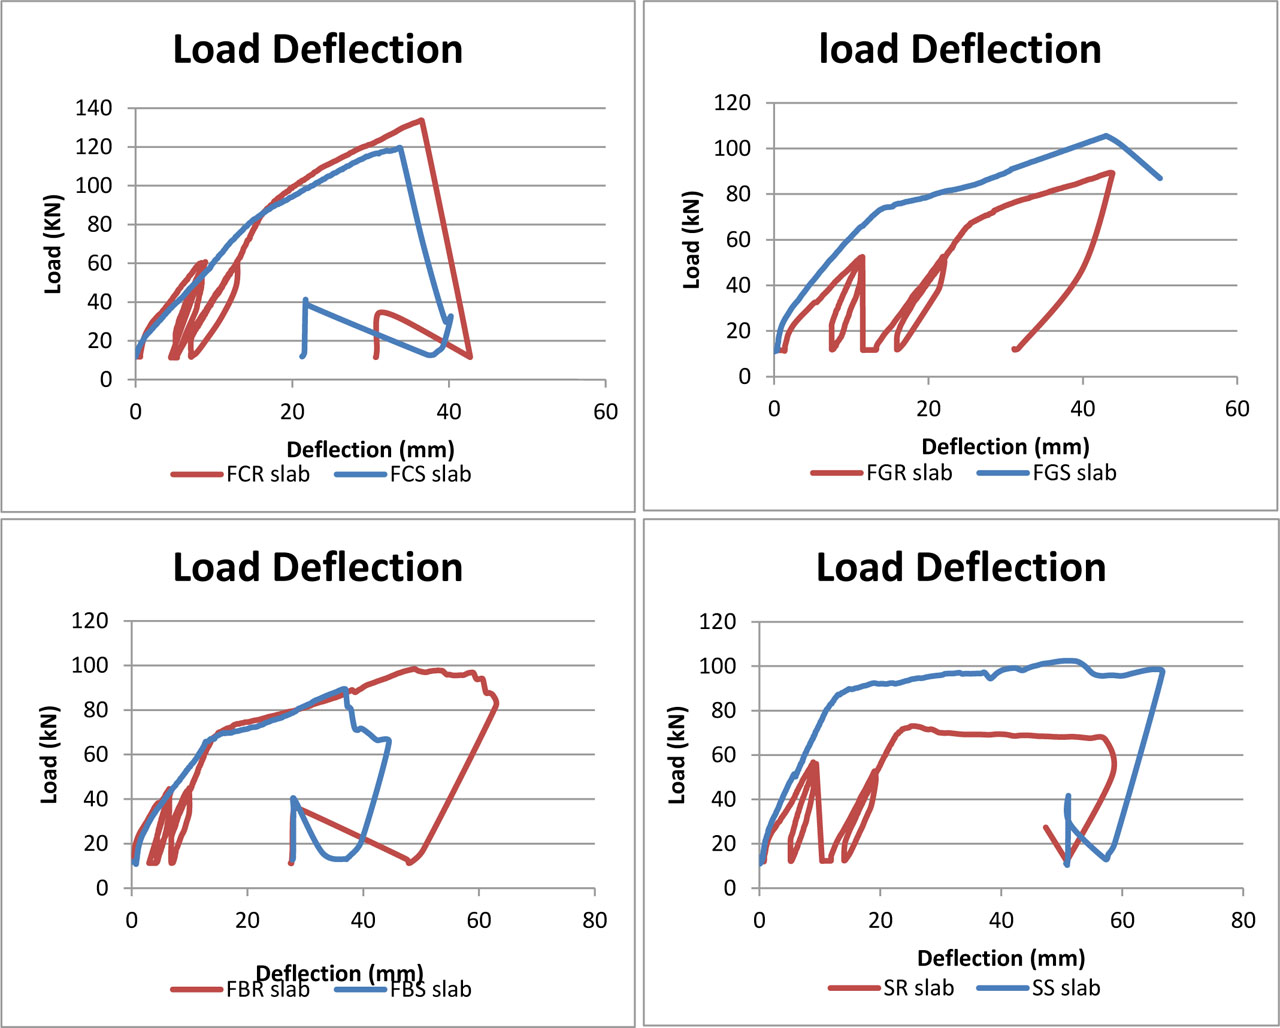
Figure 9:
Load mid-span deflection for slabs tested under repeated load and those tested statically (cont.)
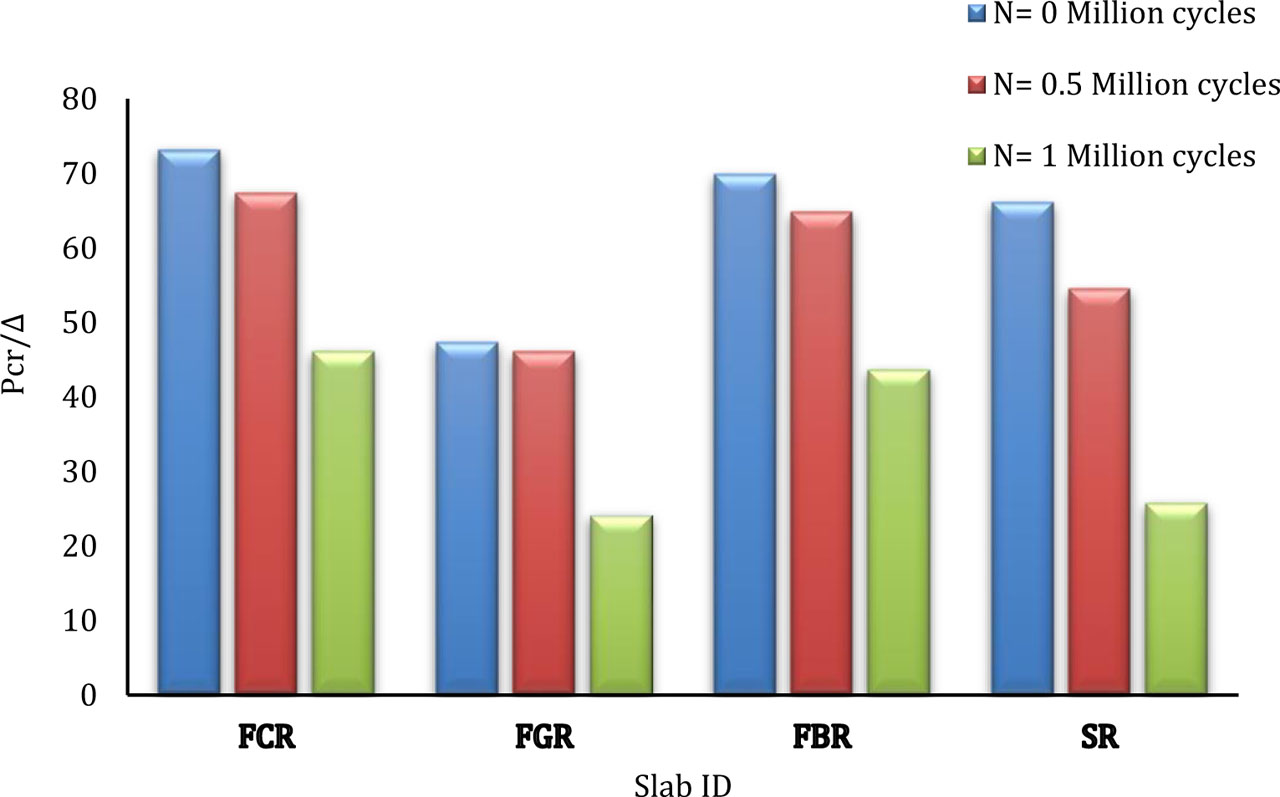
Figure 10:
The ratio of repeated load to mid-span deflection after a number N of zero, one-half and one million cycles (Pr/∆0.5P, Pr/∆1, Pr/∆2)
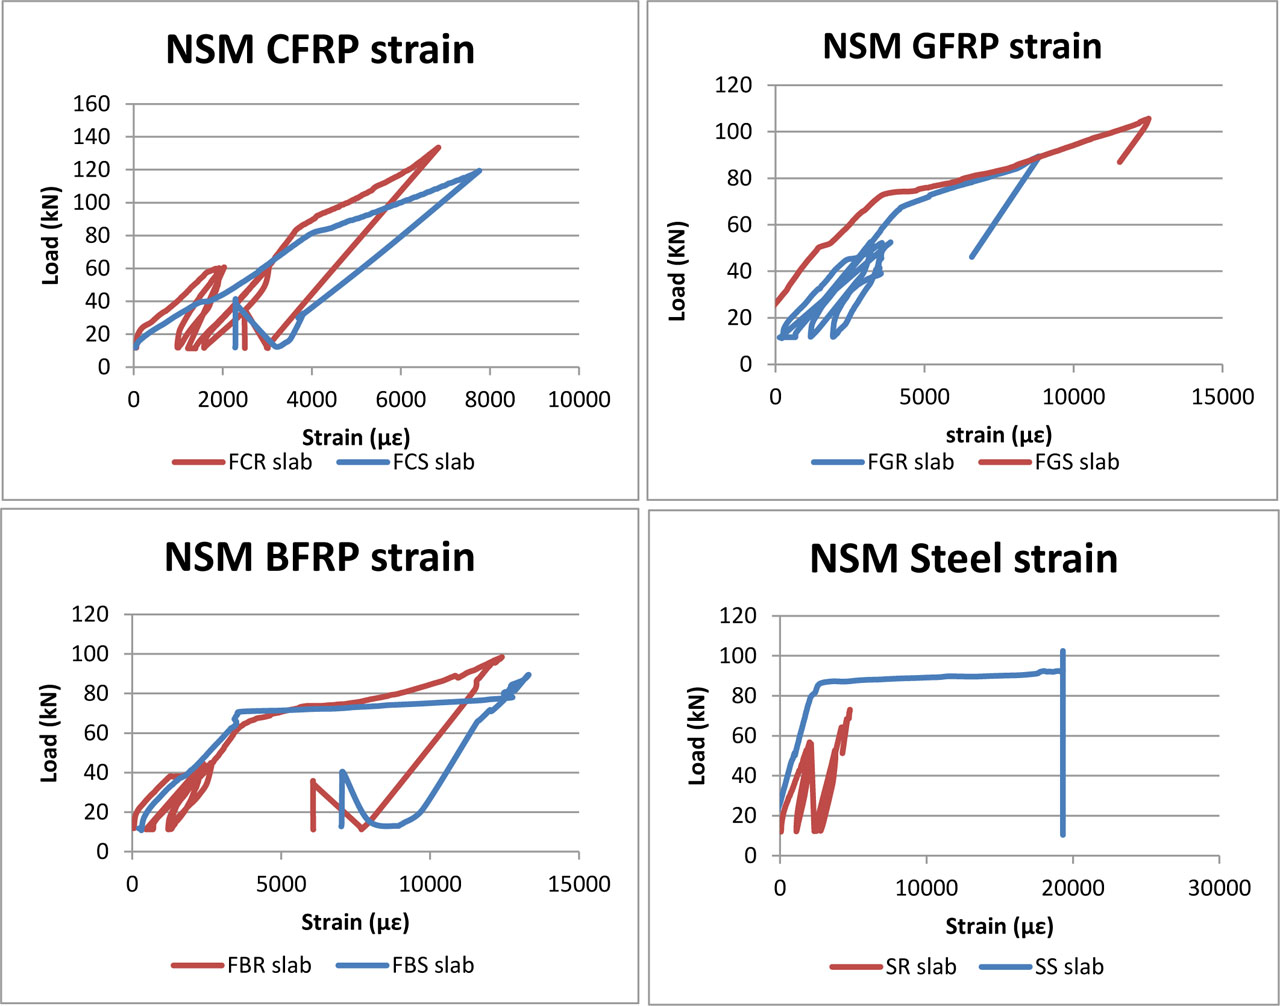
Figure 11:
Load versus strain induced in NSM bars in slabs tested under static and cyclic loading
Table 7:
Values of energy absorption, and deformability index for tested RC slabs
| Slab ID | Δ cr [mm] | Δ f [mm] | Energy absorption | Deformability index |
|---|---|---|---|---|
| CSS | 5.8 | 45.44 | 3153 | 6.83 |
| FCS | 3.65 | 33.8 | 2968 | 8.26 |
| FGS | 2.85 | 43.5 | 2060 | 14.41 |
| FBS | 3.2 | 36.65 | 2383 | 10.45 |
| SS | 4.5 | 26 | 4150 | 4.78 |
| CSR | 5.5 | 51.25 | 3117 | 8.32 |
| FCR | 2.9 | 36.55 | 3550 | 11.6 |
| FGR | 4.4 | 43.55 | 2475 | 8.9 |
| FBR | 2.85 | 48 | 1900 | 15.84 |
| SR | 3.6 | 54 | 3420 | 14 |