

1. Introduction
Concrete structures worldwide such as bridges, parking garages, pavements, and offshore facilities, are invariably subjected to repeated moving wheel loads throughout their service life. Accordingly, the necessity for their strengthening and retrofitting has become increasingly critical, driven by construction imperfections, inherent design limitations, rising load demands, changes in functional utilization, seismic requirements, and the obligation to comply with updated code provisions (Farghal, 2014; Mostakhdemin Hosseini et al., 2022; Schläfli & Brühwiler, 1998; Tian et al., 2022; Xie et al., 2012).
Slabs constitute the most critical elements in these structural systems, as they are continuously subjected to repeated loading throughout their service life. Consequently, extensive research has been directed toward enhancing their performance and durability. Among the various strengthening approaches, the near-surface mounted (NSM) method has gained significant recognition for its efficiency. In this study, the technique is applied using steel, CFRP, GFRP, and BFRP bars, which are embedded within square grooves cut into the soffit of the concrete slabs (Afefy & Fawzy, 2013; Al-Obaidi et al., 2020; Bonaldo et al., 2008; Dalfré & Barros, 2013).
All types of bars are bonded to concrete using an epoxy-based adhesive as (Sikadure31). Experimental tests have shown that the NSM technique is an adequate strengthening strategy to increase the flexural capacity of RC slabs. When we compared to the externally bonded reinforcement (EBR) technique, the NSM technique assures a higher anchoring capacity to the FRP reinforcing material. As a consequence, a high tensile stress can be applied to the CFRP, as long as the member load carrying capacity is not limited by a premature failure mode (Al-Issawi & Kamonna, 2020; Blaschko, M., and Zilch, K. 1999. “Rehabilitation of Concrete Structures with CFRP Strips Glued into Slits.” Proc., 12th Int. Conf. on Composite Materials CD-ROM, Organization of the Int. Conf. on Composite Materials, Paris, 7, n.d.; Fédération Internationale Du Béton FIB. 2001. “Externally Bonded FRP Reinforcement for RC Structures.” Bulletin 14, Lausanne, Switzerland., n.d.; Carolin, 2003; Kazem & Al-Zahra, 2025).
Typically, when a reinforced concrete (RC) member is upgraded with fibre-reinforced polymer (FRP) composites, its mode of failure becomes more brittle compared to the non-strengthened element. This behaviour is largely influenced by the nature of the FRP concrete bond, along with the linear elastic, brittle tensile characteristics of the FRP material. Moreover, early debonding of the FRP reinforcement can greatly reduce the ductility of an RC element strengthened in flexure, often resulting in an abrupt and less predictable failure. In this research, the anchorage length of the NSM bars was taken as 100% of the slab length in order to prevent bond failure during fatigue loading (Al-Obaidi et al., 2020).
Considering these challenges, this research investigates the behaviour of RC slabs strengthened with NSM bars using conventional steel, CFRP, GFRP, and BFRP. The novelty lies in directly comparing the fatigue performance and residual strength of FRP-strengthened slabs against those reinforced with traditional steel. The study aims to evaluate flexural capacity, ductility, serviceability, and durability under repeated loading, thereby providing practical guidance for selecting suitable reinforcement materials for fatigue-prone structures such as bridge decks and pavements.
2. Experimental Program and Test Procedure
2.1. Experimental Program
The experimental program comprised ten one-way reinforced concrete (RC) slabs, each tested under a four-point bending configuration over a simply supported span of 2000 mm, with two equal loads applied symmetrically to create a constant bending moment region. All slabs had a cross-section of 120 mm (thickness) and 450 mm (width) and the clear span between the centres of two supports was 1800 mm as shown in Figure 1. The adopted main steel reinforcement consisted of 3 bars of 10 mm diameter (3ϕ10) in the tension zone (the percentage of main tensile steel bars [ρsl] was 0.5%). One steel bar of 10 mm diameter spaced at 200 mm (ϕ10@200 mm) was adopted as transverse reinforcement to keep the main steel reinforcement in the targeted position. Each pair of slabs (one static and one fatigue specimen) was cast from the same concrete batch to minimize material variability.
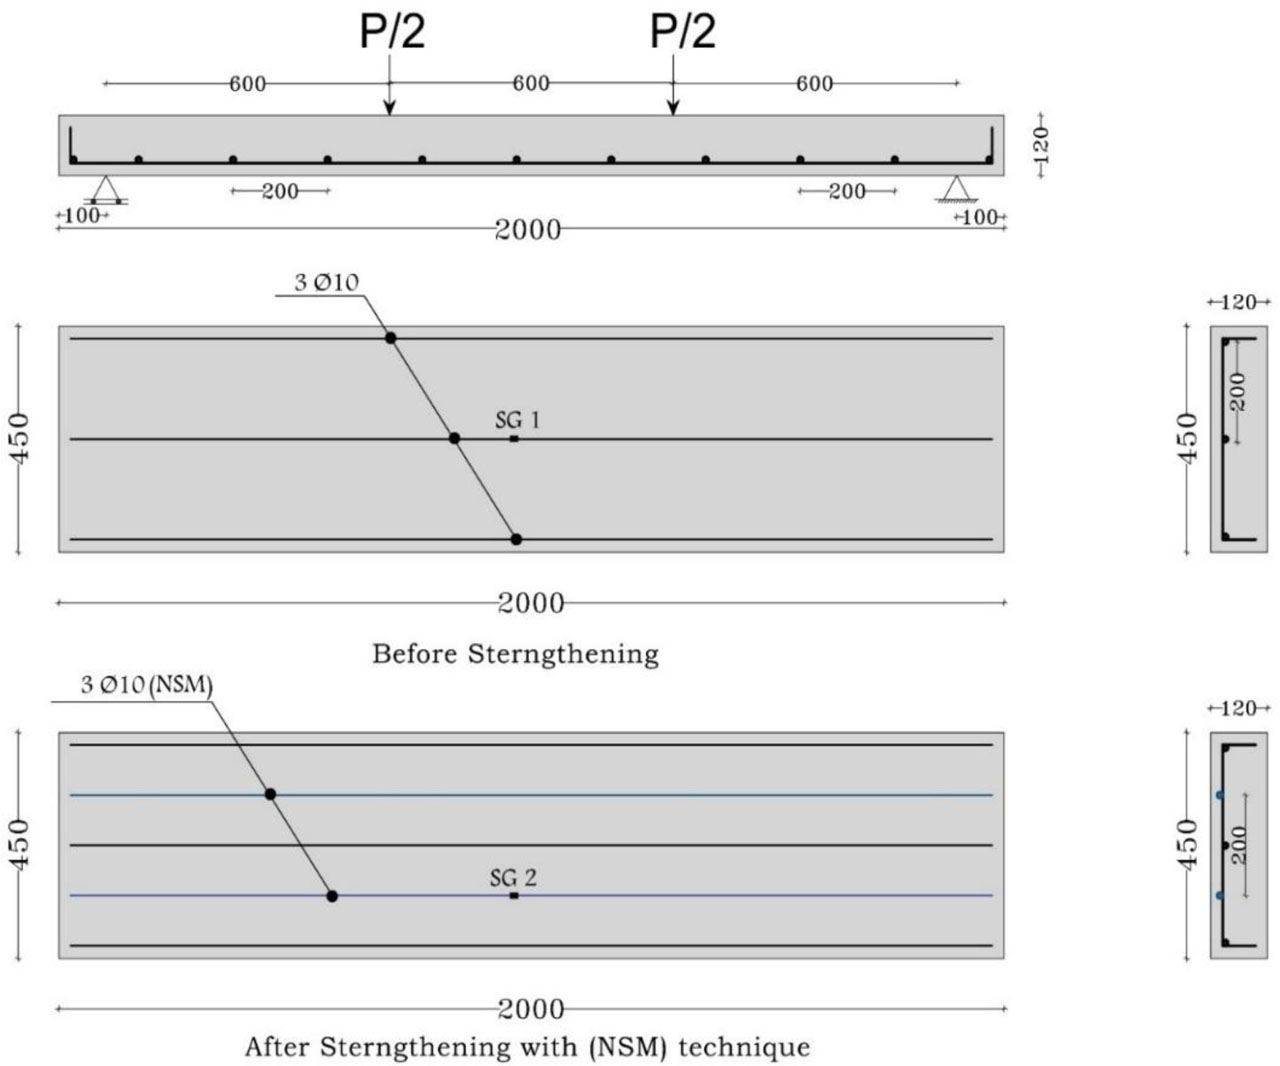
Figure 1:
Details of reinforcement of tested slabs before and after strengthening
To avoid the cutting of the reinforcements during the execution of the slits to apply the NSM Bars, 20 mm for the concrete cover of the transversal reinforcement was adopted (see the cross section of the slab after strengthening in Figure 1). The adopted (NSM) bars used in strengthening of slabs had anchorage length of bars 100% and their length equal to total length of slabs due to fatigue test considerations as case study. Two slabs were without (NSM) strengthening and conducted as control slabs, one of them was tested under static loading and the other control slab was tested under repeated loading.
The experimental program was structured into two main phases to assess the static and fatigue performance of reinforced concrete (RC) one-way slabs strengthened using near-surface mounted (NSM) bars. In the static loading group, four RC slabs were strengthened with different NSM bar materials as steel, carbon fibre-reinforced polymer (CFRP), glass fibre-reinforced polymer (GFRP), and basalt fibre-reinforced polymer (BFRP) and were labelled SS, FCS, FGS, and FBS, respectively. The results from these static tests were used as control references for evaluating the effect of fatigue loading on similarly strengthened specimens. The details of the tested slabs are presented in Table 1.
Table 1:
Data of tested slabs
| Slab ID | Type of loading | Repeated loading (kN) * | (fc) MPa | (f′c) MPa | (NSM) Strengthening system description |
|---|---|---|---|---|---|
| CSS | Static | ------- | 35 | 30 | Control slab |
| FCS | ------- | 34 | 29 | 2 (Carbon FRP) bars, ϕ 10mm | |
| FGS | ------- | 37 | 32 | 2 (Glass FRP) bars, ϕ 10mm | |
| FBS | ------- | 34 | 29 | 2 (Basalt FRP) bars, ϕ 10mm | |
| SS | ------- | 38 | 33 | 2 Steel reinforcing bars, ϕ 10mm | |
| CSR | Repeated | 30 | 35 | 30 | Control slab |
| FCR | 60 | 34 | 29 | 2 (Carbon FRP) bars, ϕ 10mm | |
| FGR | 52.8 | 37 | 32 | 2 (Glass FRP) bars, ϕ 10mm | |
| FBR | 44.75 | 34 | 29 | 2 (Basalt FRP) bars, ϕ 10mm | |
| SR | 51.25 | 38 | 33 | 2 Steel reinforcing bars, ϕ 10mm |
The fatigue loading group consisted of another four RC slabs, also strengthened with the same types of NSM bars and labelled as SR, FCR, FGR, and FBR. These slabs were subjected to cyclic loading following a predefined fatigue protocol designed to simulate long-term service conditions. The fatigue test setup, as illustrated in Figure 4, included one million loading cycles at 50% of the ultimate static load determined from their respective control counterparts. Upon completion of the fatigue cycles, each specimen was subsequently tested under static loading to assess its residual load-bearing capacity. This two-phase approach allowed for a comprehensive evaluation of both the immediate and long-term structural performance of NSM-strengthened RC slabs under realistic service conditions.
2.2. Materials
2.2.1. Concrete
The tested slabs were cast using normal-strength concrete with coarse aggregate having a maximum nominal size of 20 mm. The average compressive strength after 28 days was 35.6 MPa for standard cubes (fc) and 30.6 MPa for standard cylinders (f′c), as summarized in Table 1. Detailed information on the concrete materials is provided in Table 2, which lists the mixture proportions required to produce one cubic meter of concrete. The properties of the adopted concrete mix design, determined in accordance with the ACI 318 provisions, are presented in Table 3 (ACI Standard and Report, 2014; American Concrete Institute (ACI) Committee 318. Building Code Requirements for Structural Concrete (ACI 318-08) and Commentary. Farmington Hills, Michigan, USA; 2008., n.d.). The strength value of 31 MPa shown in Table 3 represents the average concrete strength obtained from all casting batches.
2.2.2. Steel and FRP (NSM) Reinforcing Bars
Deformed steel bars (EZZ Steel B500DWR) with a diameter of 10 mm were employed as both the primary tensile reinforcement and as NSM strengthening bars. For comparison, three types of FRP bars: carbon, glass, and basalt were also incorporated into the NSM strengthening system, each with a nominal diameter of 10 mm. The average experimentally determined properties of the reinforcement bars are reported in Table 4.
2.2.3. Epoxy
The same epoxy-based adhesive (Sikadur®-31, a two-component epoxy resin) was used for all NSM bars, including steel, CFRP, GFRP, and BFRP specimens. It is a fast-curing anchoring adhesive consisting of two parts: adhesive and hardening agent. The two parts were sealed separately in one tube. A mixing nozzle and an adhesive gun were used to mix and apply the epoxy adhesive. The mechanical properties, as provided by the manufacturer, are shown in Table 5 (Al-Obaidi et al., 2020).
2.3. Specimens’ Preparation
Grooves for the NSM reinforcement were formed by executing two longitudinal cuts with a diamond blade saw, after which the intervening concrete was carefully removed using a hammer and chisel to obtain the final channel. Rectangular grooves of 20×20 mm were cut into the soffit of each slab to accommodate the NSM bars and epoxy adhesive, ensuring adequate confinement and bond capacity. Prior to bar installation, compressed air was applied to eliminate any remaining dust and debris. The placement process began with filling nearly half the groove depth with epoxy, upon which the bar was embedded and subsequently covered with an additional layer of adhesive. The surface was then levelled to remove excess epoxy, as presented in Figure 2. The epoxy was then left to cure for at least seven days at approximately 17.0 °C (Al-Obaidi et al., 2020).
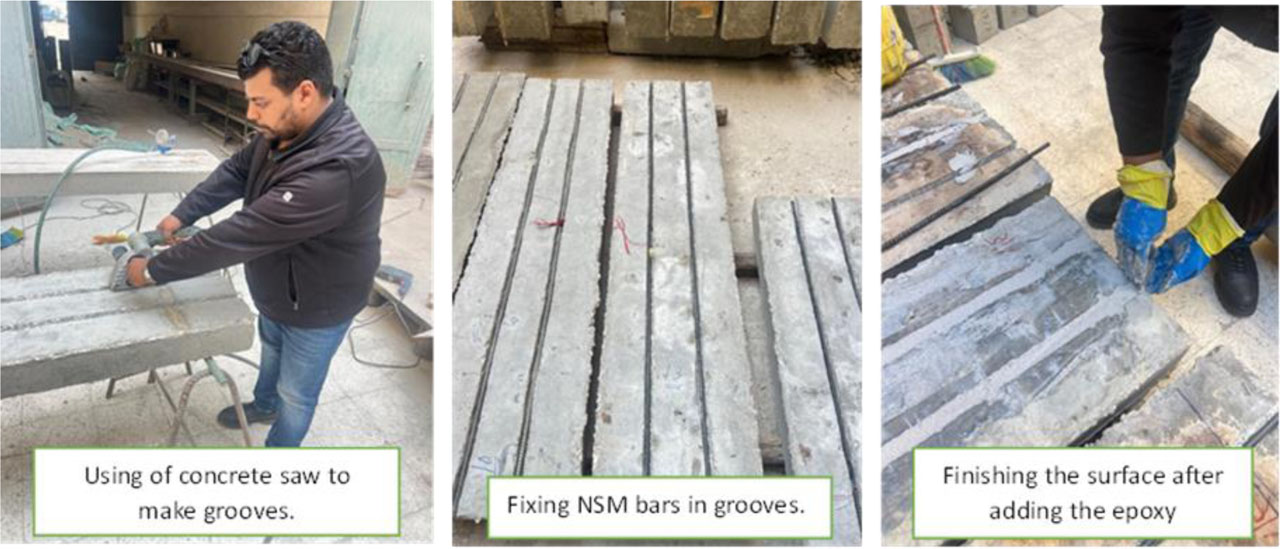
Figure 2:
Preparation of strengthened slabs with different NSM bars
2.4. Measuring Devices
The mid-span deflection was measured using a Linear Variable Differential Transformer (LVDT) with an accuracy of 0.01 mm, which was securely mounted at the mid-span of the tested slabs to ensure precise readings. The strain in the main steel reinforcement was monitored using a strain gauge (SG1), attached at the midpoint of the central reinforcing bar. Additionally, a steel strain gauge (SG2) was fixed at the mid-length of the NSM bar to record its strain response. A concrete strain gauge (SG3), 10 cm in length, was also installed at the mid-span on the top surface of all slabs to measure the concrete strain during various testing phases. All measurements were continuously recorded using a data logger, as illustrated in the corresponding Figure 3.
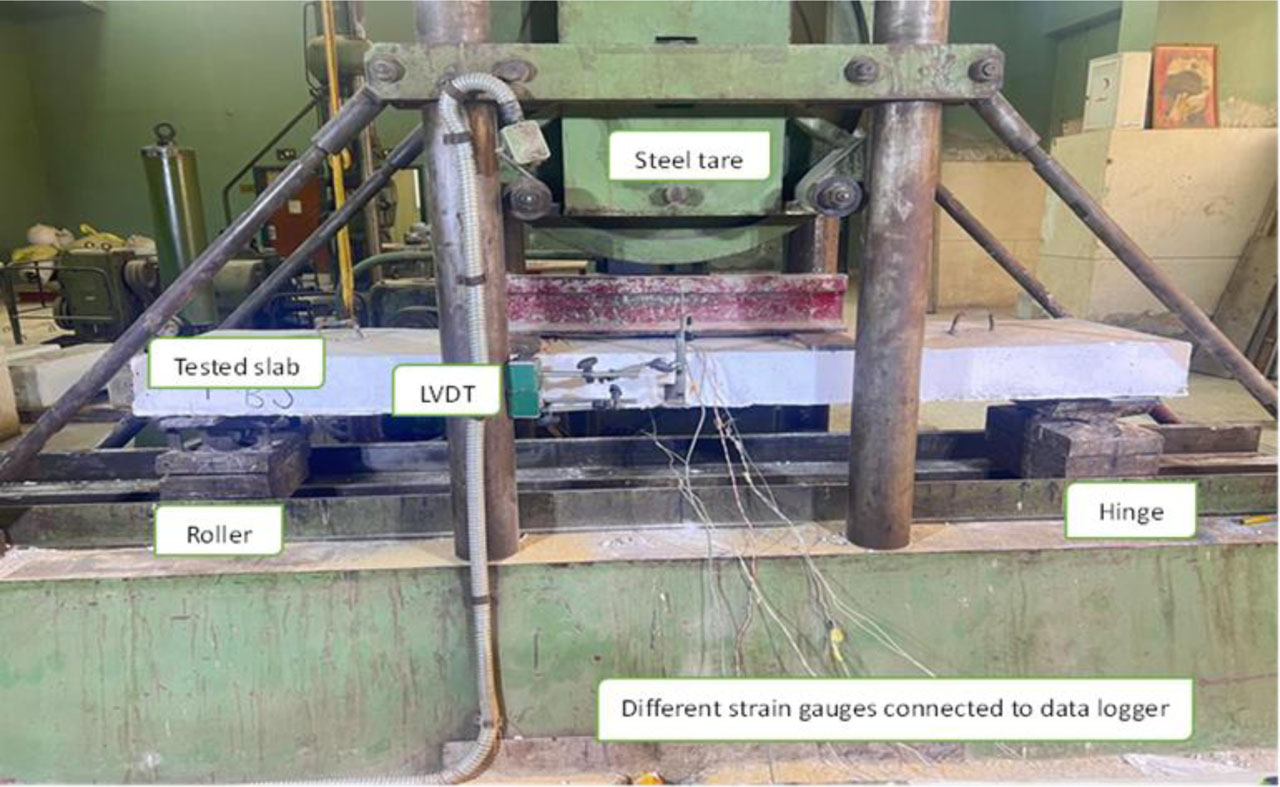
Figure 3:
Test set up
2.5. Test Procedure
Before preparing for the testing process, the specimens were painted in white colour to observe the first cracks during the application of loads on the samples.
All slabs were tested over a simply supported span of 2000 mm, with a clear span of 1800 mm between supports. The applied load was introduced through two symmetrically spaced points located 600 mm apart, as illustrated in Figure 1. For the slabs tested under static loading, the load was applied incrementally in steps of 2 kN every 1 minute until failure, allowing continuous monitoring of deflection, and strain development throughout the test.
For the fatigue loading tests, the maximum repeated load was set at 50% of the ultimate load capacity of the corresponding slab tested statically, while the minimum load was maintained at 14 KN, representing the self-weight (tare) of the testing apparatus. A loading frequency of 500 cycles per minute (equivalent to 8.33 Hz) was selected for the repeated tests to simulate accelerated fatigue conditions.
The loading protocol for the fatigue-tested slabs is illustrated in Figure 4 and consisted of several stages. Initially, the slabs were subjected to a static cycle (segment ab), beginning with the application of the minimum load followed by incremental increases up to the maximum fatigue load level. Once this static cycle was completed, cyclic loading was applied for the first half million cycles (segment bc). Following this, the repeated loading was paused, and the load was gradually reduced back to the minimum level (segment cd). After a rest period, the slab was reloaded statically using the same loading sequence (segment ef), followed by another half million loading cycles (segment fg). Finally, the fatigue loading was stopped, and the load was once again reduced to the minimum level (segment gh), after which a final static loading phase was conducted until failure (segment hk).
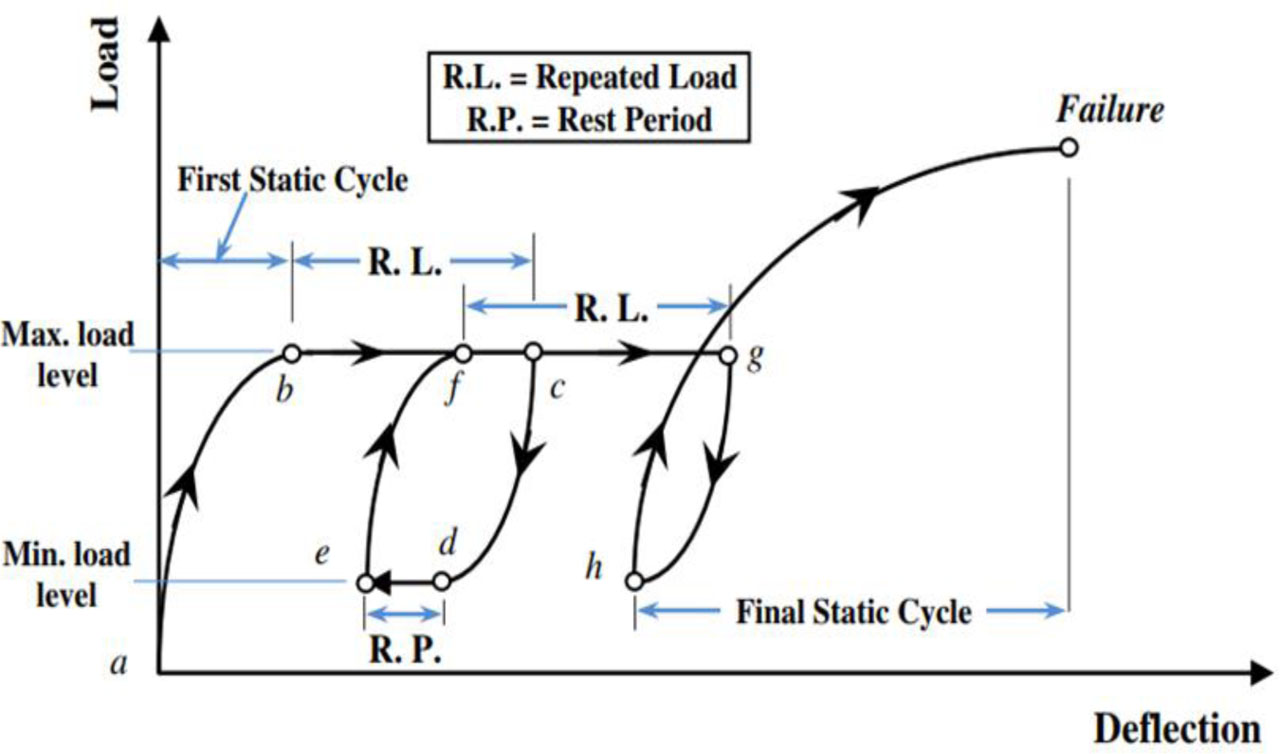
Figure 4:
Sketch of sequence of loading versus deformation [1]
Throughout the entire testing procedure, both photographic and schematic documentation of the setup were collected. The readings from strain gauges and dial gauges were continuously monitored and recorded at various load intervals. In addition, the initiation and progression of cracks were carefully observed and documented to assess damage development during both static and cyclic loading phases (Farghal, 2014).
3. Discussion and Analysis of Experimental Results
3.1. Cracks Pattern and Mode of Failure
Half of the slabs which were tested statically and served as reference specimens for the other half which were tested under repeated loading. For these slabs lastly mentioned, the first cycle was carried out up to one-half of the maximum static load corresponding to the similar slab tested under static loading.
All tested slabs exhibited a similar behaviour in terms of first cracking, which was a flexural crack observed at a cracking load ranging between 30 KN and 35 KN for all specimens (see Figures 5 and 6).
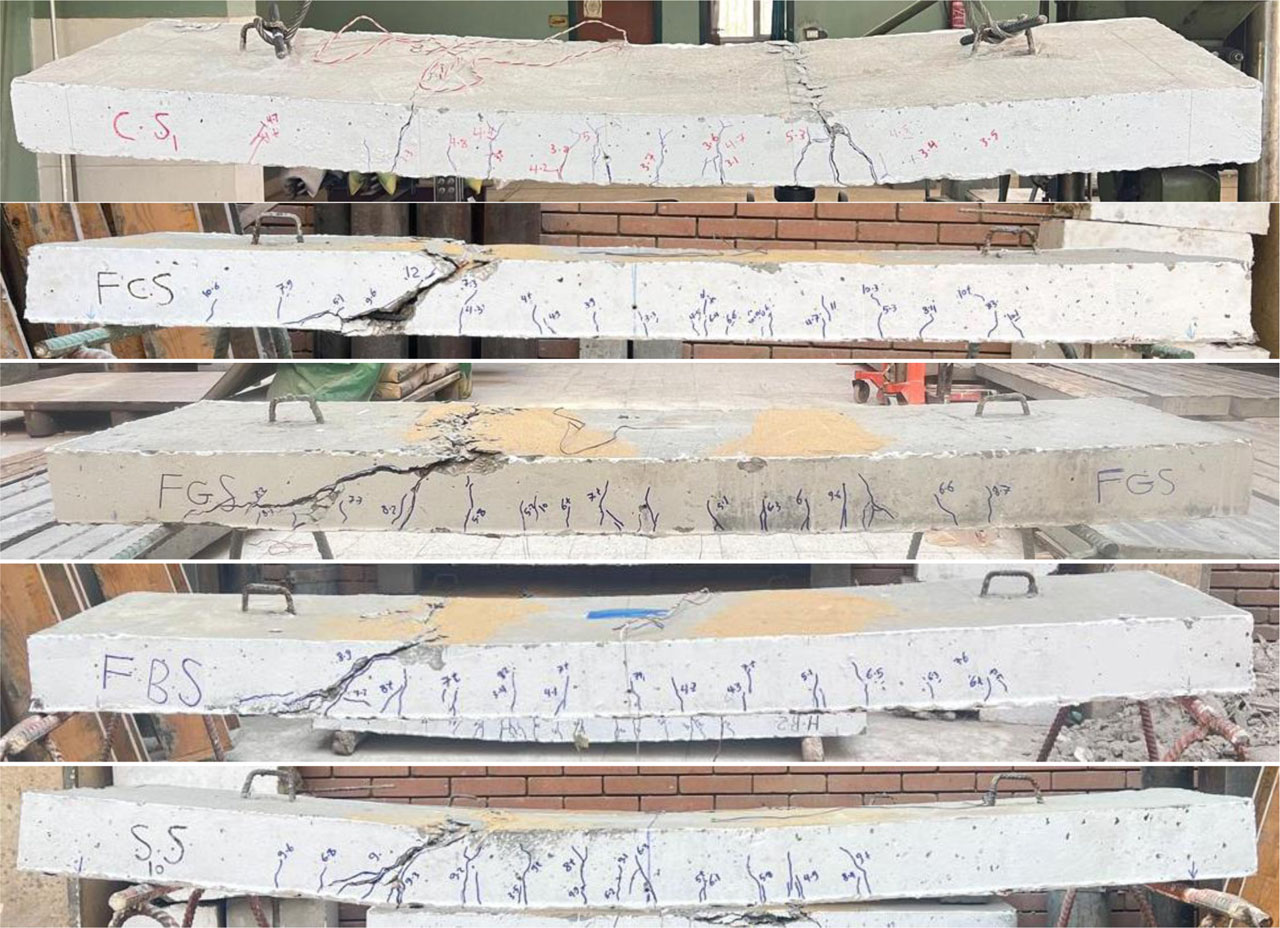
Figure 5:
Cracks pattern of slabs tested under static loading
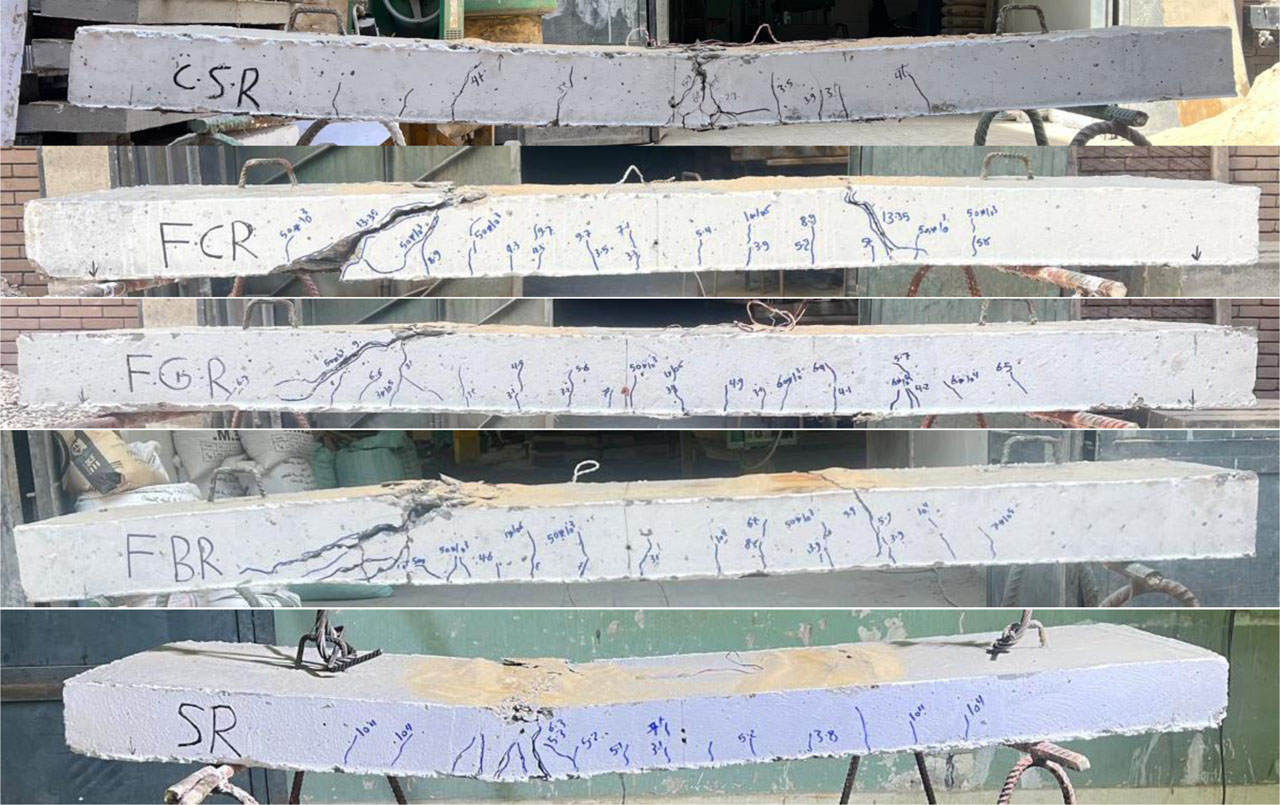
Figure 6:
Cracks pattern of slabs tested under repeated loading.
For the slabs tested under static loading:
In the control slab (CS), flexural cracks appeared at the early stage of loading. These cracks continued to propagate as the load increased, the mode of failure was flexural failure, as shown in figure 5.
In the strengthened slabs tested under static loading, flexural cracks appeared at the beginning of loading and gradually widened as the load increased. Just before failure, a sudden shear crack developed, accompanied by concrete crushing near the roller support. The level of damage among the strengthened slabs increased sequentially, with slabs SS, FGS, FBS, and FCS showing progressively greater damage. This shear crack combined with existing flexural cracks and was located away from the support, near the direct loading position under the loading plate, as shown in Figure 5.
For the slabs tested under repeated loading:
The control slab CSR could survive one million cycles of loading according to the specified loading procedure. Flexural cracks appeared from the beginning of loading and gradually widened as the number of load cycles increased. and the mode of failure was obvious flexural ductile failure as shown in Figure 6.
The strengthened slabs tested under repeated loading survived one million cycles according to the specified loading procedure. Flexural cracks appeared during the first load cycle and gradually widened as the number of cycles increased. Most of cracks were observed around the 300th, 350th, and 500th loading cycles. After reaching one million cycles, the slabs were loaded statically up to failure. Just before failure, a sudden shear crack occurred, accompanied by concrete crushing near the roller support.
The level of damage in the strengthened slabs increased progressively in slabs FGR, FBR, and FCR. The shear crack was combined with existing flexural cracks and was located away from the support, close to the direct loading position under the loading plate, as shown in Figure 6. Slab SR sustained almost one million cycles before the final static load was applied, and its mode of failure was a ductile flexural failure, as shown in Figure 6.
3.2. Load-carrying Capacity of the Tested Slabs
For the different tested slabs, a summary of the experimental results related to cracking load, service load, yielding load, and maximum load is presented in Table 6. In addition, Table 6 provides both the maximum static load Pmax and the percentage improvement (R%) in maximum load, defined as the ratio of the increase in maximum load of the strengthened slab to that of its corresponding control slab.
Table 6:
Summary of the static and repeated tests in terms of loads and deflection
| Slab ID | Cracking load Pcr (KN) | Service load Pser (KN) | Yielding load Py (KN) | Ultimate load Pmax (KN) | R % | Δref | Δref % | Failure type |
|---|---|---|---|---|---|---|---|---|
| CSS | 31 | 36 | 26.7 | 60 | ------- | 45.44 | ------ | Flexure |
| FCS | 33 | 48 | 81.13 | 120 | 100 | 9.9 | 78.21 | Flexure-shear |
| FGS | 33 | 50 | 74 | 105.6 | 76 | 9.7 | 78.75 | Flexure-shear |
| FBS | 34 | 45 | 41.7 | 89.5 | 49.33 | 11.6 | 74.47 | Flexure-shear |
| SS | 35 | 58 | 77.7 | 102.5 | 70.83 | 7.5 | 83.5 | Flexure-shear |
| CSR | 32 | 31.2 | 25.8 | 61.53 | 2.5 | 43 | 5.4 | Flexure |
| FCR | 33 | 55 | 78.2 | 133.51 | 122.52 | 12.9 | 71.61 | Flexure-shear |
| FGR | 30 | 42 | 52.6 | 89.44 | 49.1 | 23.7 | 47.84 | Flexure-shear |
| FBR | 30 | 54 | 31.9 | 96.81 | 61.35 | 12.55 | 72.38 | Flexure-shear |
| SR | 31 | 50 | 28.3 | 73.06 | 21.77 | 20.8 | 54.23 | Flexure |
For the slabs tested under repeated loading, the initial static loading cycle was applied up to 50% of the maximum static load of their corresponding reference slabs tested under monotonic loading (Pr = 30, 60, 52.8, 44.75 and 51.25 KN for slabs CSR, FCR, FGR, FBR, and SR respectively).
It is obvious that, in case of slabs tested under repeated loading, the flexural cracks initiated during the application of the first static cycle of loading at number of cycles of 50, 100 and 300 thousand respectively; however, the flexural cracks initiated within the second cycle of repeated loading at a number of cycles of 550, 600, and 700 thousand for strengthened slabs FGR, FBR and FCR respectively except for slab SR the main flexural crack initiated at a number of cycles of 850 thousand and could survive up to one million cycle before its major flexural crack width reached 1.5 mm according to Chinese code (GB/T 50152, Standard for Test Method of Concrete Structure, Ministry of Housing and Urban-Rural Construction, China, 2012, in Chinese., n.d.).
After repeated loading, different slabs tested under final static loading up to failure. In other words, with respect to the first cracking stage, the different slabs tested under repeated loading behave similarly as those of the corresponding slabs tested statically.
For the slabs tested under static loading, the NSM-strengthened specimens demonstrated substantial increases in maximum load (R) capacity compared to the control slab (CS). Specifically, slabs FCS, FGS, FBS, and SS showed capacity improvements of 100%, 76%, 49.33%, and 70.83%, respectively, as summarized in Table 6.
For the slabs tested under repeated loading, the strengthened specimens exhibited a higher number of cycles (N) than their corresponding control specimens, despite the in the repeated load. Moreover, compared to the control slab (CS), the NSM-strengthened slabs showed increases in maximum load capacity percentage of 122.5%, 49.1%, 61.35%, and 21.77% for slabs FCR, FGR, FBR, and SR, respectively, as presented in Table 6. The FCR slab (subjected to fatigue loading) exhibited slightly higher ultimate resistance than FCS due to concrete densification and microcrack stabilization during cyclic loading, which enhanced stiffness before the final static phase.
It is worth noting that, compared with their corresponding control slabs, CSR showed a 2.5% increase in maximum load over CS, FCR increased by 22.52% over FCS, FGR decreased by 15.3% compared with FGS, FBR increased by 8% over FBS, and SR decreased by 28.72% compared with SS.
3.3. Deflections and Flexural Stiffness
The load mid-span deflection curves for each slab tested under repeated loading, together with those of the corresponding slabs tested under static loading, are presented in Figure 8. The figure also includes the collective load mid-span deflection responses of the different slabs tested under static loading. Furthermore, the maximum mid-span deflections corresponding to cracking, yielding, and ultimate failure loads are summarized in Table 7 for all tested slabs. It is important to note that, for slabs failing primarily in flexure, the service load is defined as the load at which significant flexural cracks first appeared.
Table 7:
Ductility index of the tested slabs
| Slab ID | Δ y (mm) | Δ u (mm) | ΔI | ΔInor |
|---|---|---|---|---|
| CSS | 4.3 | 45.44 | 10.56 | 1 |
| FCS | 14.75 | 33.8 | 2.29 | 0.22 |
| FGS | 14.2 | 43.5 | 2.92 | 0.28 |
| FBS | 6.2 | 36.65 | 5.91 | 0.56 |
| SS | 10.6 | 51.45 | 4.85 | 0.46 |
| CSR | 4.5 | 51.25 | 8.78 | 0.83 |
| FCR | 15.15 | 36.55 | 2.41 | 0.23 |
| FGR | 21.85 | 43.55 | 2.00 | 0.19 |
| FBR | 7.4 | 48 | 6.6 | 0.625 |
| SR | 8.9 | 50.9 | 5.72 | 0.54 |
Based on Figures 7 and 8 and Table 7, the following observations can be made: During the first static loading cycle, all tested slabs exhibited an approximately linear-elastic response up to the onset of cracking. Beyond this stage, the behaviour became nonlinear as multiple flexural cracks developed along the constant moment region. The initial flexural cracks appeared at nearly the same mid-span deflection for all tested slabs. Furthermore, within this initial cycle, the load–mid-span deflection responses of the slabs subjected to repeated loading were found to be comparable to those of the corresponding slabs tested under monotonic static loading (Farghal, 2014).
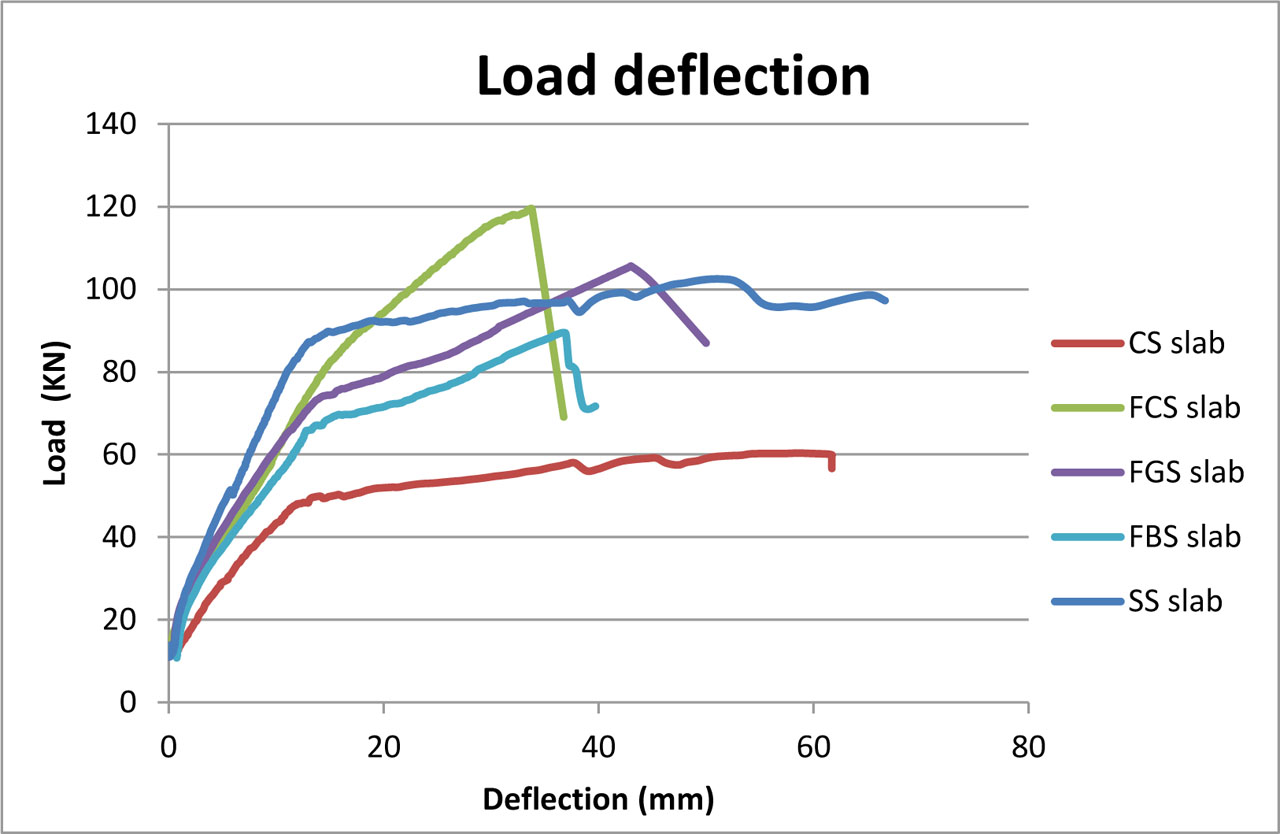
Figure 7:
Comparison between Load mid-span deflection for slabs tested statically
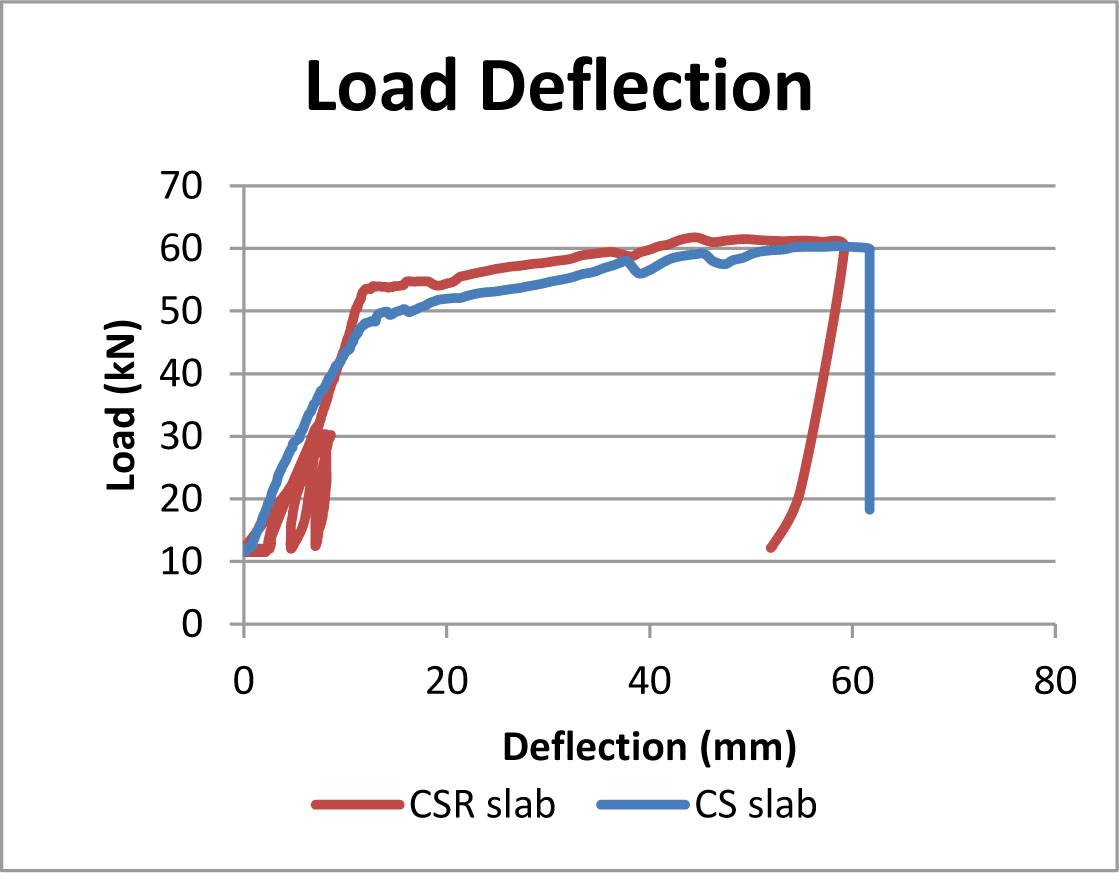
Figure 8:
Load mid-span deflection for slabs tested under repeated load and those tested statically
The mid-span deflection at failure for the slabs tested statically were 45.44, 33.8, 43.5, 36.65 and 26 mm for slabs CS, FCS, FGS, FBS and SS respectively. After the exposure to one million cycles, the mid-span deflection of the different slabs tested under repeated loading were 51.25, 36.55, 43.55, 48, and 27 mm for slabs CSR, FCR, FGR, FBR and SR respectively.
On the other hand, comparing the deflection values of the tested slabs at the failure load of the control slab CS, as presented in Table 6, the mid-span deflection was 9.9 mm for FCS, 9.7 mm for FGS, 11.6 mm for FBS, and 7.5 mm for SS, in comparison to 45.44 mm for slab CS. This corresponds to an improvement in flexural stiffness and a reduction in mid-span deflection of 78.21%, 78.75%, 74.47%, and 83.50% respectively.
The strengthened slabs tested under repeated loading showed deflection values at the failure load of the control slab (CS) corresponding to 71.61%, 47.84%, 72.38%, and 54.23% for slabs FCR, FGR, FBR, and SR, respectively. It can be noted that these values are lower than those of the control ones, indicating that the strengthened slabs retained greater stiffness under static testing even after being subjected to repeated loading.
This is attributed to the fact that flexural stiffness, measured in terms of mid-span deflection, was not significantly affected during this static cycle. Even after exposure to repeated loading whether after 0.5 million or one million cycles. the strengthened slabs, despite being subjected to higher repeated loads than the control slab, exhibited mid-span deflections that were generally comparable to those of the control slab.
This confirms the effectiveness of the NSM strengthening technique in resisting repeated loading. Specifically, the repeated loads were 30, 60, 52.8, 44.75, and 51.25 KN for slabs CSR, FCR, FGR, FBR, and SR, respectively. After 0.5 million cycles, this stiffness ratio was 67.40%, 46.86%, 64.86%, and 54.52% for slabs FCR, FGR, FBR, and SR, respectively. Following one million cycles, these ratios were 46.15%, 24.16%, 43.65%, and 25.75%, respectively.
In other words, under repeated loading, the flexural stiffness expressed as the ratio of the repeated load to mid-span deflection (Pr/∆0.5P, Pr/∆1, Pr/∆2) showed a significant improvement due to the NSM strengthening technique, especially in slabs subjected to repeated loading (Figure 9) (Farghal, 2014).
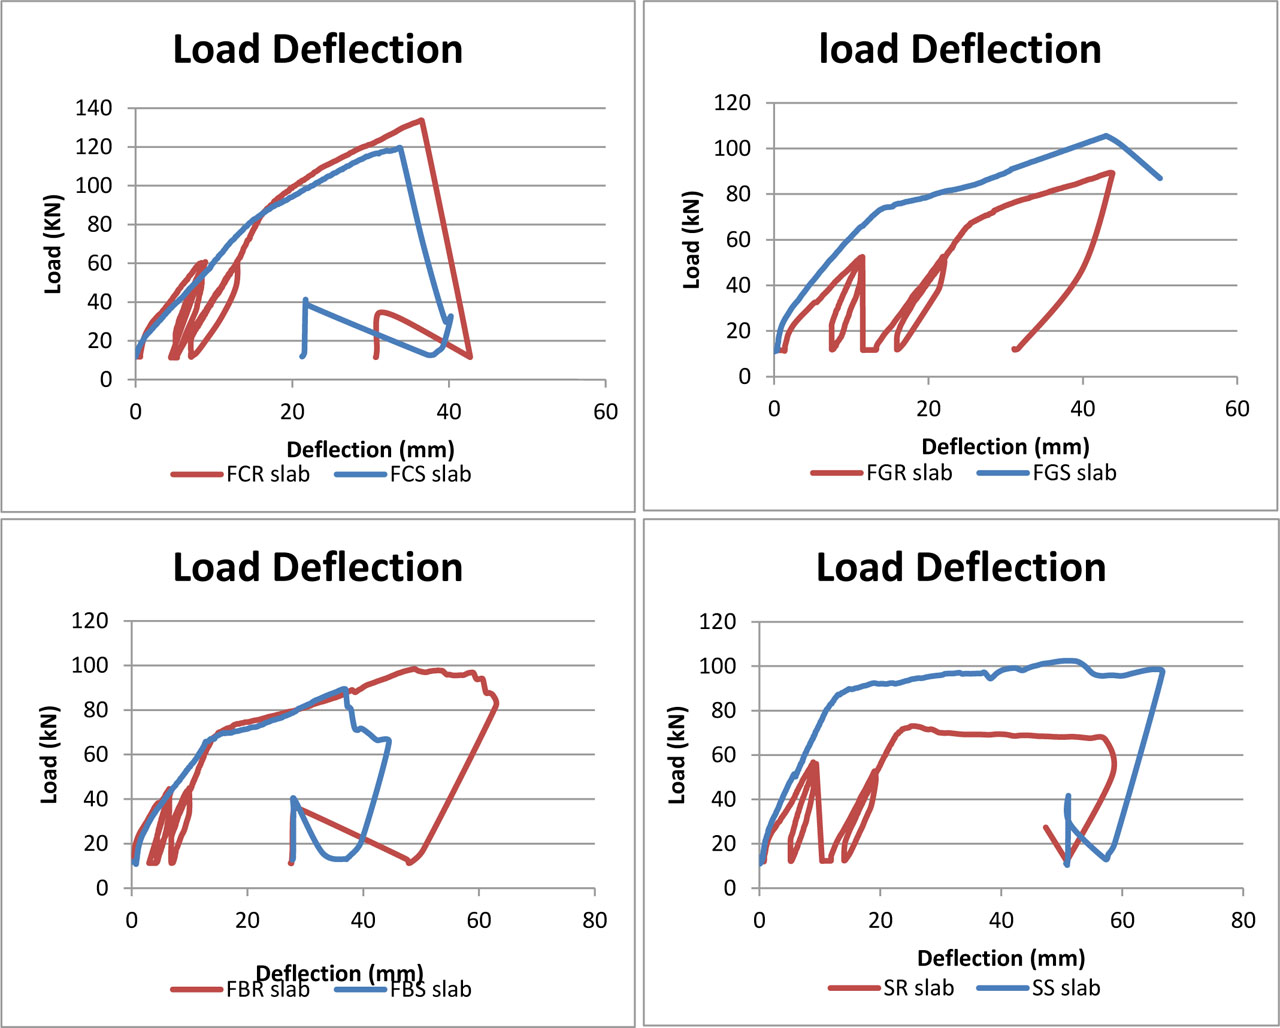
Figure 9:
Load mid-span deflection for slabs tested under repeated load and those tested statically (cont.)
3.4. Residual Bearing Capacity
In the fatigue test, none of the strengthened slabs fractured after exposure to one million load cycles. These slabs were subsequently tested under static loading until failure to determine their residual bearing capacity. Figure 8 presents the residual capacity deflection curves at mid-span after repeated loading.
As shown in Figure 8, the residual bearing capacity varied depending on the type of NSM bars. Specifically, slabs FCR and FBR, strengthened with NSM CFRP and BFRP bars, showed increases of 11.26% and 8.17%, respectively, compared to their control slabs FCS and FBS. Moreover, the load–deflection curves revealed no obvious stiffness degradation or capacity loss as a result of fatigue loading.
In contrast, slabs FGR and SR, strengthened with NSM GFRP and steel bars, experienced a decrease in residual bearing capacity of 15.3% and 28.72%, respectively, relative to their control slabs FGS and SS.
Overall, all slabs strengthened with NSM bars demonstrated good fatigue performance and retained ductility after repeated loading. Based on this analysis, it can be concluded that the fatigue performance of the composite slabs was not significantly different from their static performance under suitable fatigue loads (Liu & Yang, 2021).
3.5. Strains in NSM Bars
Strain gauges were affixed to the NSM bars at locations corresponding to the regions of maximum flexural stress in the tested slabs. The resulting strain values, as depicted in Figure 10, illustrate the behaviour of the NSM bars under loading. The load-strain curves in Figure 10 exhibit a similar trend to the load-deflection curves presented in Figure 8.
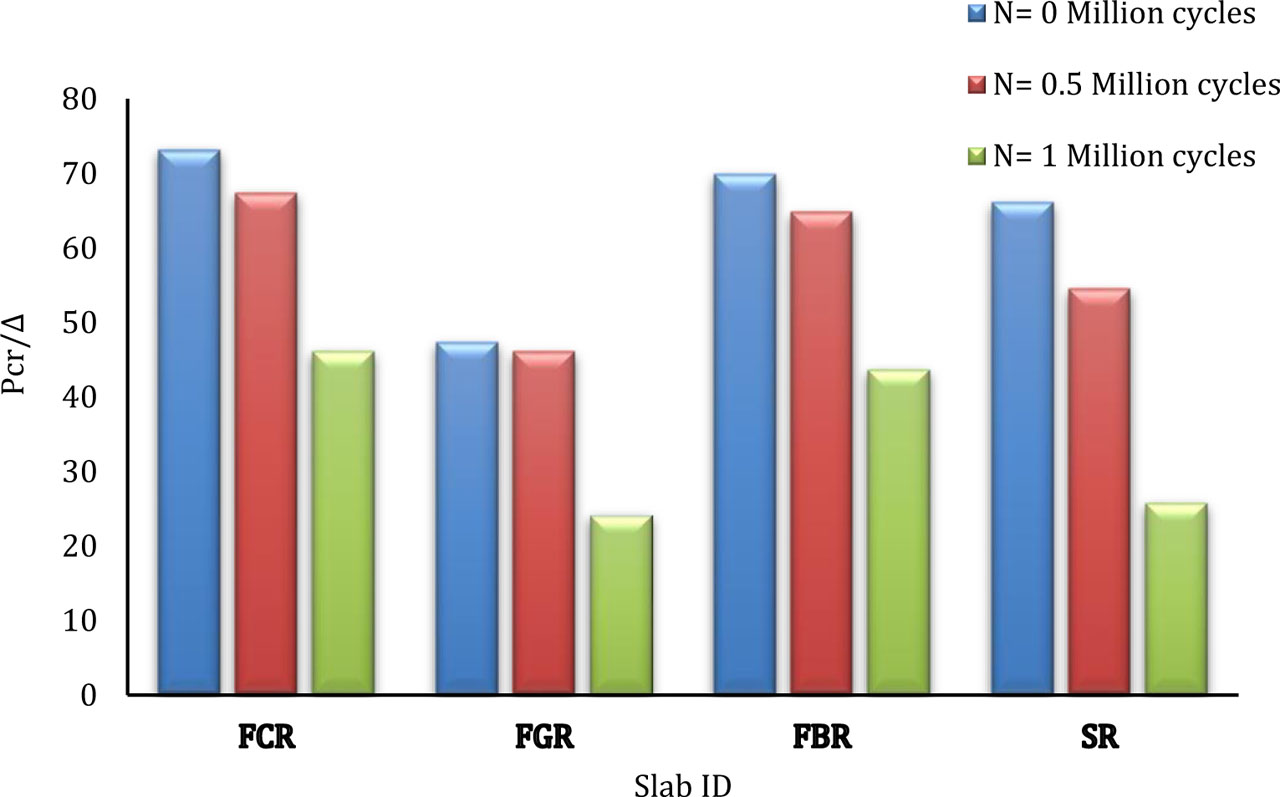
Figure 10:
The ratio of repeated load to mid-span deflection after a number N of zero, one-half and one million cycles (Pr/∆0.5P, Pr/∆1, Pr/∆2)
For the tested specimens, as the applied load or number of cycles increased, the dynamic evolution of tensile strain in the NSM bars could be categorized into three distinct stages: an initial stage, a stable development stage, and an accelerated growth stage. During the intermediate (stable) stage of cyclic loading, the increase in strain in the NSM bars was primarily attributed to the accumulation of residual strain.
It is important to note that the mechanism of fatigue failure differs from that of static loading. Although the tensile strain in the steel reinforcement increased during fatigue failure, the peak strain values remained significantly lower than those observed under static loading conditions (Zhang et al., 2018).
3.6. Ductility of the Strengthened Slabs
The ductility index (ΔI) is defined as the ratio of the mid-span deflection at the ultimate load (Δu) to the mid-span deflection at the yielding load (Δy). A higher ductility index indicates a greater capacity of the slab to undergo significant deformation before failure, providing better warning. This index was used to evaluate the impact of NSM–CFRP, GFRP, BFRP, and steel bar strengthening on the ductility of the slabs compared to the control slab (Aljidda, 2024).
Table 7 lists the mid-span deflections at yielding and ultimate loads, along with the corresponding ductility indices, while Figure 7 presents the normalized ductility of each slab relative to the control slab. In general, the strengthened slabs with NSM FRP bars showed a significant decrease in their ductility indices from 62.5% to 22% compared to the control slab (CS) as shown in table 7. This reduction can be attributed to the high modulus of elasticity of the FRP bars, which limited the amount of deformation prior to failure. However, the NSM FRP bars considerably enhanced the flexural strength and load-carrying capacity of the slabs, allowing them to sustain higher loads and, consequently, larger absolute deflections at failure.
Among the FRP-strengthened slabs, those strengthened with BFRP bars displayed greater ductility than those strengthened with other types of FRP, as shown in Table 7. Furthermore, slabs strengthened with steel bars exhibited acceptable ductility values compared to the NSM FRP strengthened slabs. The enhanced ductility of the BFRP-strengthened slab can be attributed to the lower stiffness and higher strain capacity of basalt fibres, which allowed for greater deformation prior to failure. Moreover, the better bond compatibility between BFRP bars and concrete facilitated more gradual crack propagation and delayed debonding, thereby promoting a more ductile failure mode relative to the CFRP and GFRP systems.
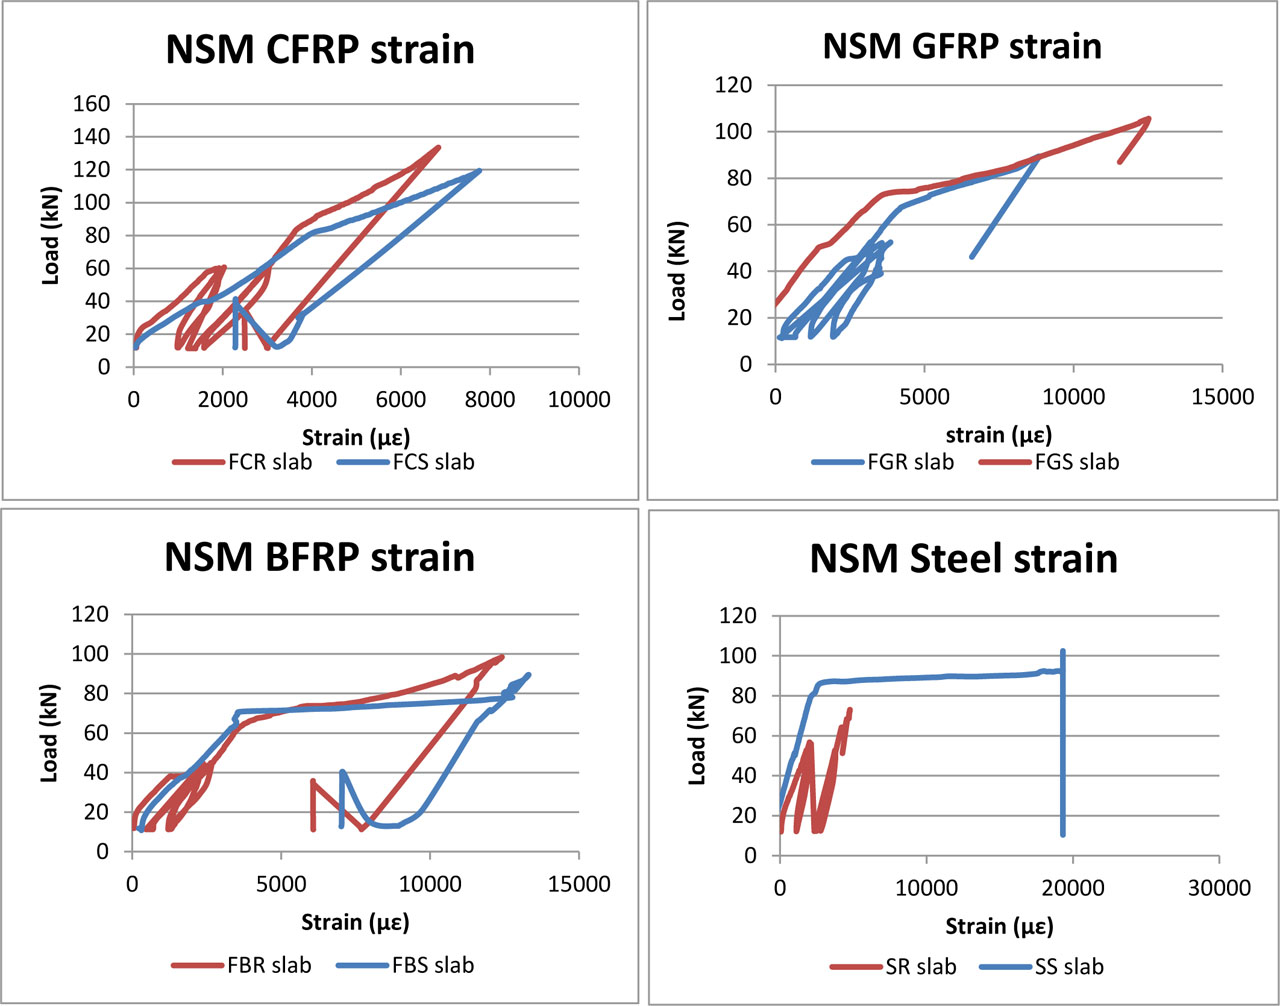
Figure 11:
Load versus strain induced in NSM bars in slabs tested under static and cyclic loading
3.7. Energy Absorption Capacity
The system must possess a substantial energy-absorption capacity to ensure robust behaviour. In other words, it should be able to store the initial kinetic energy imparted by the impulse as potential energy without reaching failure. This energy-absorption capacity must remain below the deformation capacity, as this corresponds to the region with the most significant displacement and the greatest potential energy. The total area under the load–deflection curve up to the point of ultimate failure is commonly computed as a measure of energy absorption capacity (Henrik et al., 2004; Ling et al., 2023; Spadea et al., 2001).
The deformability index (DI) (Zou, 2003) is defined as the ratio of the deflection at a given load to the final deflection at fracture, and it characterizes the material’s capacity for deformation prior to failure. Specifically, DI is calculated as the final deflection minus the deflection corresponding to the desired load level (Hassan et al., 2018; Tann et al., 2003). Equation (1) can be used to obtain the deformability index (Hameed & Daud, 2024).
Table 8 presents the energy absorption and deformability index values for the slabs in this inquiry and all the factors required to compute them.
Table 7:
Values of energy absorption, and deformability index for tested RC slabs
| Slab ID | Δ cr [mm] | Δ f [mm] | Energy absorption | Deformability index |
|---|---|---|---|---|
| CSS | 5.8 | 45.44 | 3153 | 6.83 |
| FCS | 3.65 | 33.8 | 2968 | 8.26 |
| FGS | 2.85 | 43.5 | 2060 | 14.41 |
| FBS | 3.2 | 36.65 | 2383 | 10.45 |
| SS | 4.5 | 26 | 4150 | 4.78 |
| CSR | 5.5 | 51.25 | 3117 | 8.32 |
| FCR | 2.9 | 36.55 | 3550 | 11.6 |
| FGR | 4.4 | 43.55 | 2475 | 8.9 |
| FBR | 2.85 | 48 | 1900 | 15.84 |
| SR | 3.6 | 54 | 3420 | 14 |
Δcr = deflection at cracking load; Δf.= deflection at failure.
4. Conclusion
Based on the experimental investigations carried out under both static and repeated loading conditions on one-way RC slabs strengthened with NSM bars, the following conclusions can be drawn:
○ Using the NSM technique clearly improved the flexural strength of RC slabs under repeated loading, with the best results seen in the slabs strengthened with CFRP bars. All the strengthened slabs survived one million load cycles without showing visible damage, which highlights how effective this method is in extending the fatigue life of concrete members.
○ All tested slabs were able to sustain 50% of their static maximum load for one million loading cycles without failure. Consequently, failure occurred only during the final static loading stage. As a result, the slabs subjected to repeated loading exhibited failure modes that were mostly like those of their corresponding specimens tested under static loading.
○ Two mechanisms of failure were observed. The first one was in a ductile manner and occurred in case of the control slabs (without strengthening). The second mechanism was a brittle one (a combination of sudden shear crack, crushing of concrete struts and rupture of NSM bras).
○ For the slabs tested under repeated loading, those strengthened with NSM CFRP and BFRP bars exhibited greater residual bearing capacity than their corresponding control specimens. Conversely, slabs strengthened with NSM GFRP and steel bars demonstrated lower residual bearing capacity compared to their respective control slabs tested statically following the fatigue loading.
○ Due to exposure to repeated loading, the strengthened slabs were able to carry higher repeated loads compared to their corresponding control slabs. Despite the increased load levels, these strengthened slabs exhibited mid-span deflections that were generally comparable to those of the control slabs. However, both the control and strengthened slabs tested under repeated loading showed higher maximum mid-span deflections (Δmax) than those of their corresponding counterparts tested under static loading.
Notes
[6] Conflicts of interest Declaration of competing interests
The authors declare no competing interests.
[7] Availability of Data and Materials
The datasets used and/or analysed during the current study are available from the corresponding author on reasonable request.
[8] Contributed by Author Contributions
Y.T. designed the study and supervised the project, M.E. conducted the experiments and developed the methodology, A.Dr. performed the data analysis and visualization, and Y.H. contributed to data interpretation and manuscript writing. All authors critically reviewed and approved the final version of the manuscript and agreed to be accountable for all aspects of the work.