

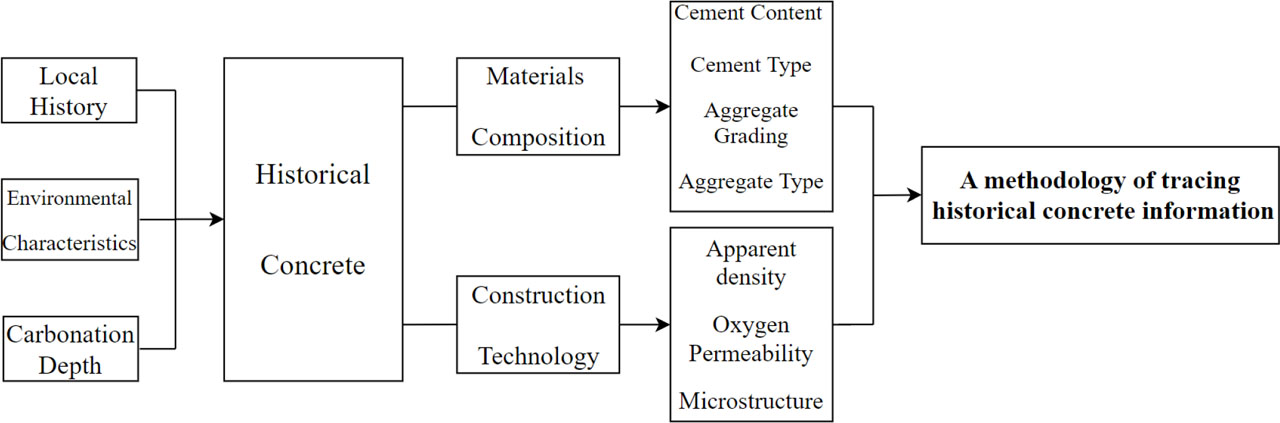
Figure 1:
Flowchart of methodology of tracing historical concrete information
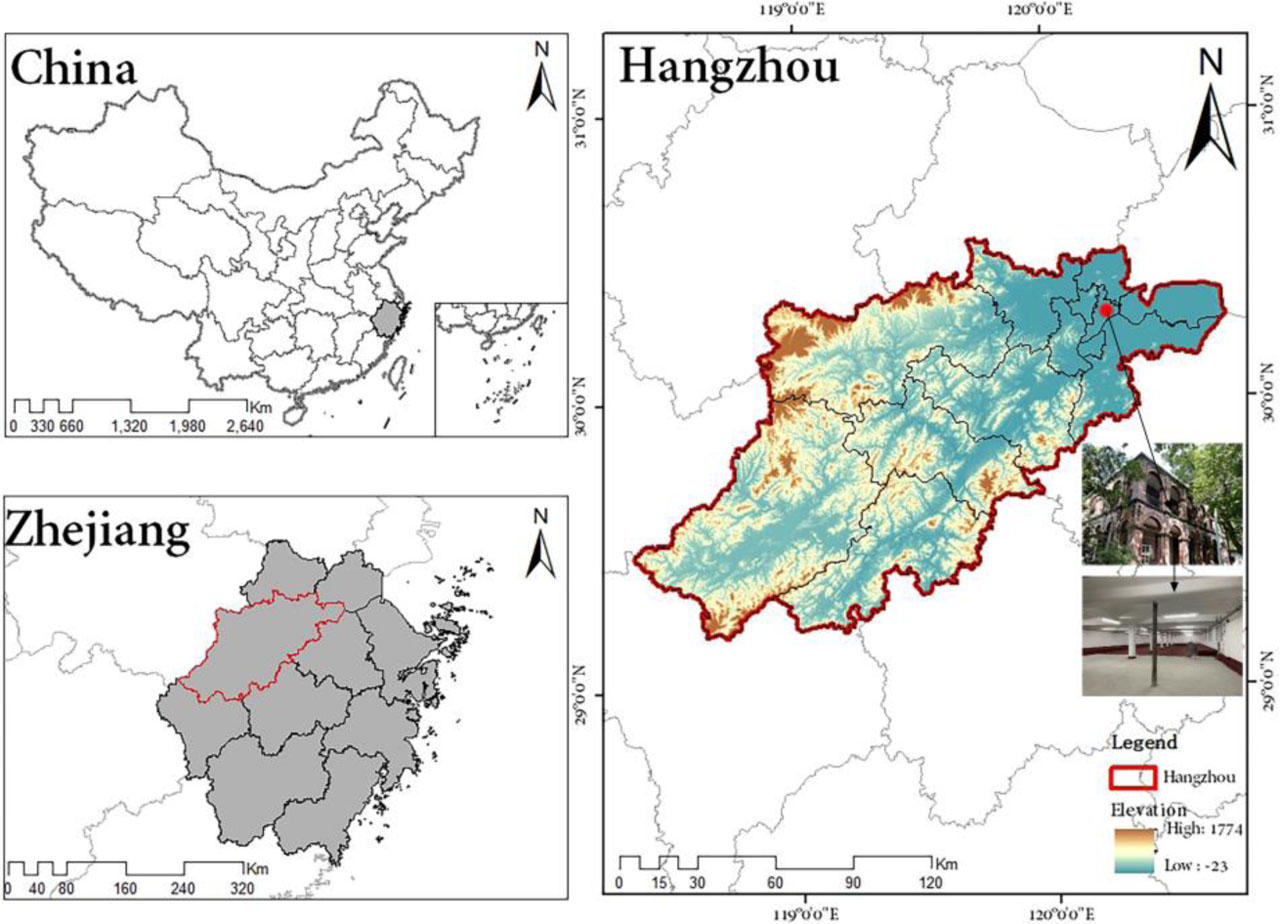
Figure 2:
Geographical location
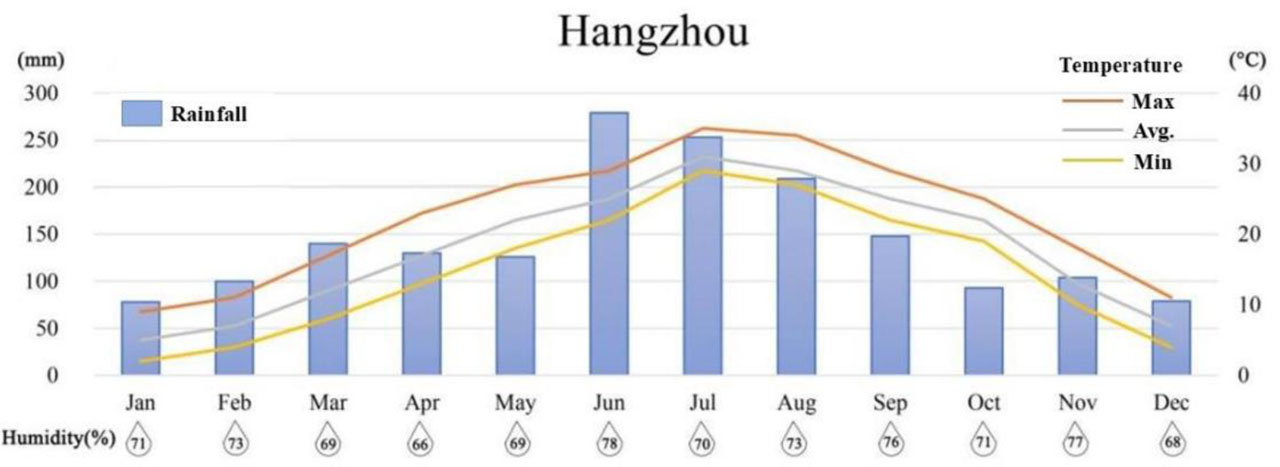
Figure 3:
Changes in Precipitation, Temperature, and Humidity in Hangzhou
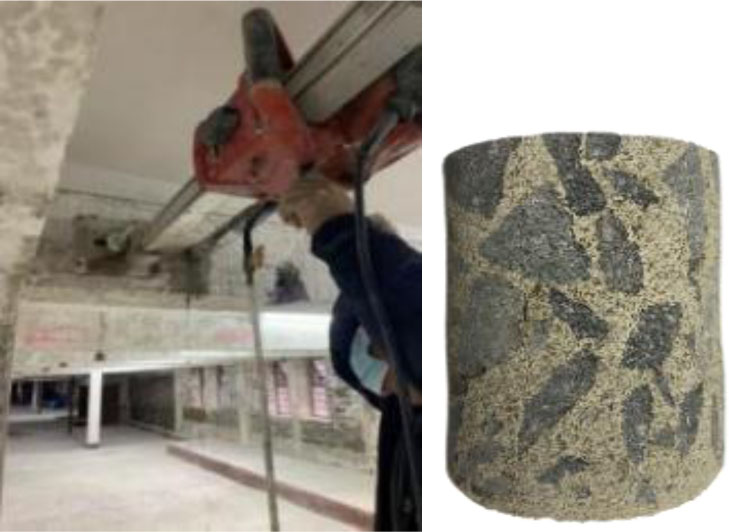
Figure 4:
Sampling process and sample
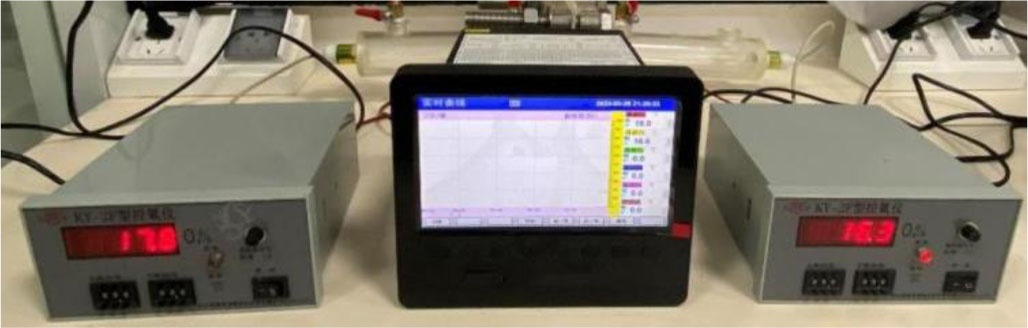
Figure 5:
Oxygen diffusion testing apparatus
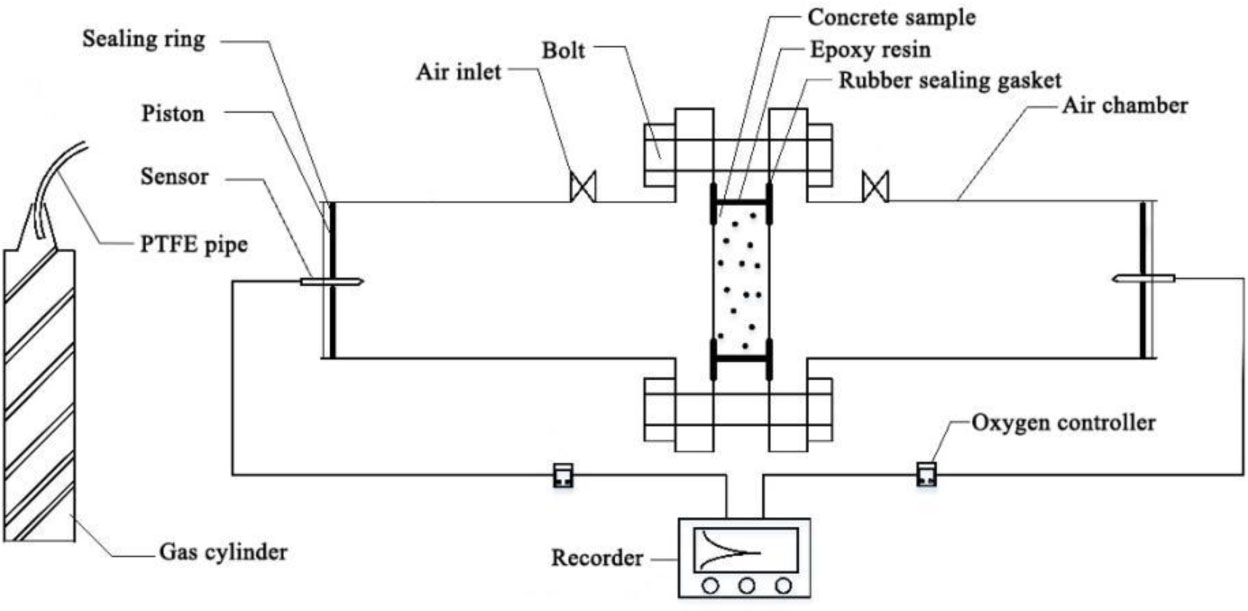
Figure 6:
Oxygen diffusion coefficient testing apparatus
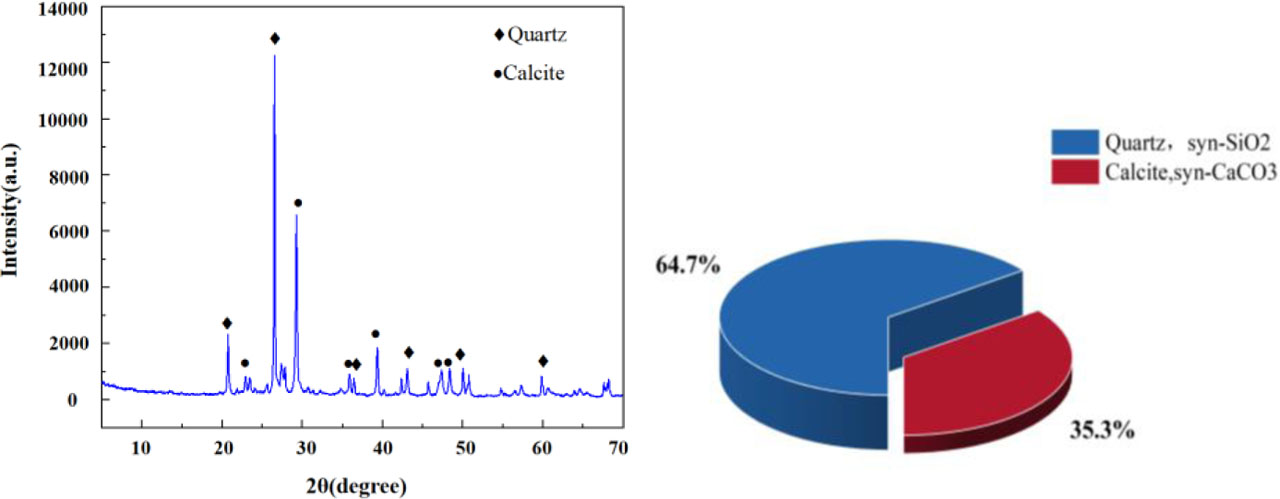
Figure 7:
Historical concrete samples composition and mass proportion
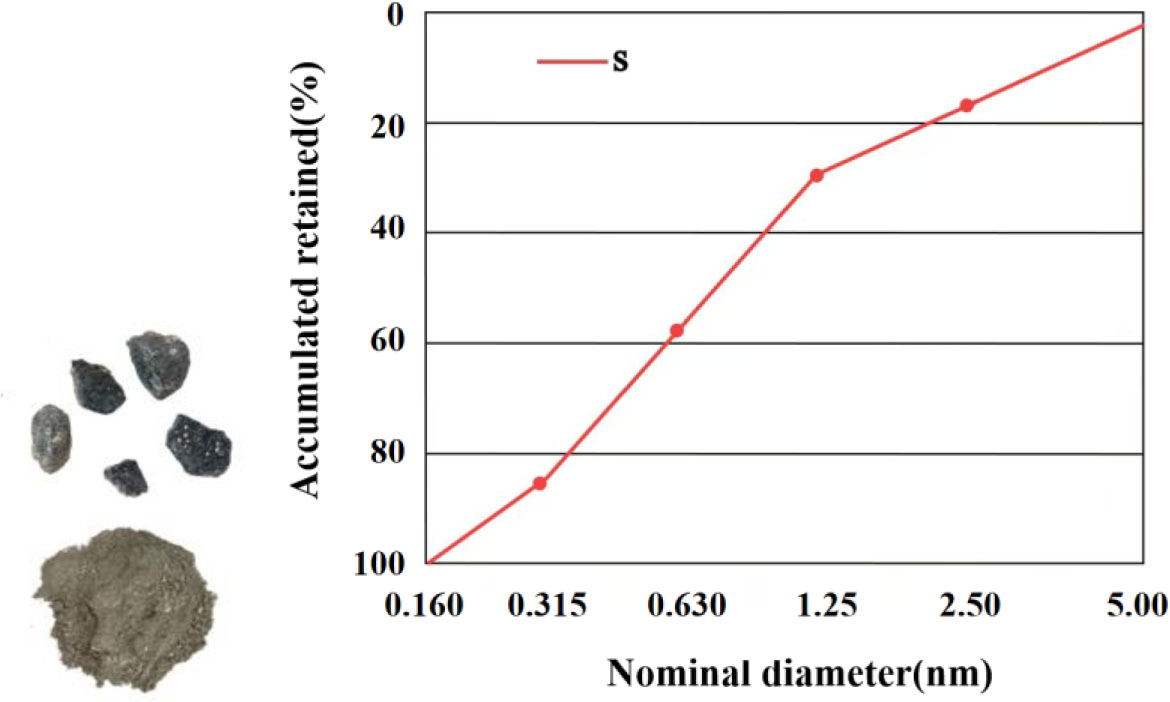
Figure 8:
Aggregates and Result of sand sieving
Table 1:
Regression models, curves and results of their fitting performances.
| Regression Model | Specimen | Regression curve | R2 | SSR |
|---|---|---|---|---|
| Exponential fitting | S1 | y=3245.9×exp(−x/25396.3)+479.9 | 0.99998 | 56.48 |
| S2 | y=3334.9×exp(−x/31777.5)+515.1 | 0.99996 | 12.98 | |
| S3 | y=2766.7×exp(−x/38286.4)+893.6 | 0.99997 | 23.74 | |
| Linear fitting | S1 | y=−0.07976x+3543.4 | 0.98401 | −0.99 |
| S2 | y=−07171x+3721.2 | 0.98966 | −0.99 | |
| S3 | y=−0.0526x+3582.9 | 0.99283 | −0.99 | |
| Logistic fitting | S1 | y=6473.6/[1+(x/56027.2)0.92] −2709.8 | 0.99998 | 7.77 |
| S2 | y=6582.8/[1+(x/67427.9)0.95] −2712.7 | 0.99996 | 10.78 | |
| S3 | y=5984.7/[1+(x/92594.8)0.94] −2309.8 | 0.99997 | 5.10 |
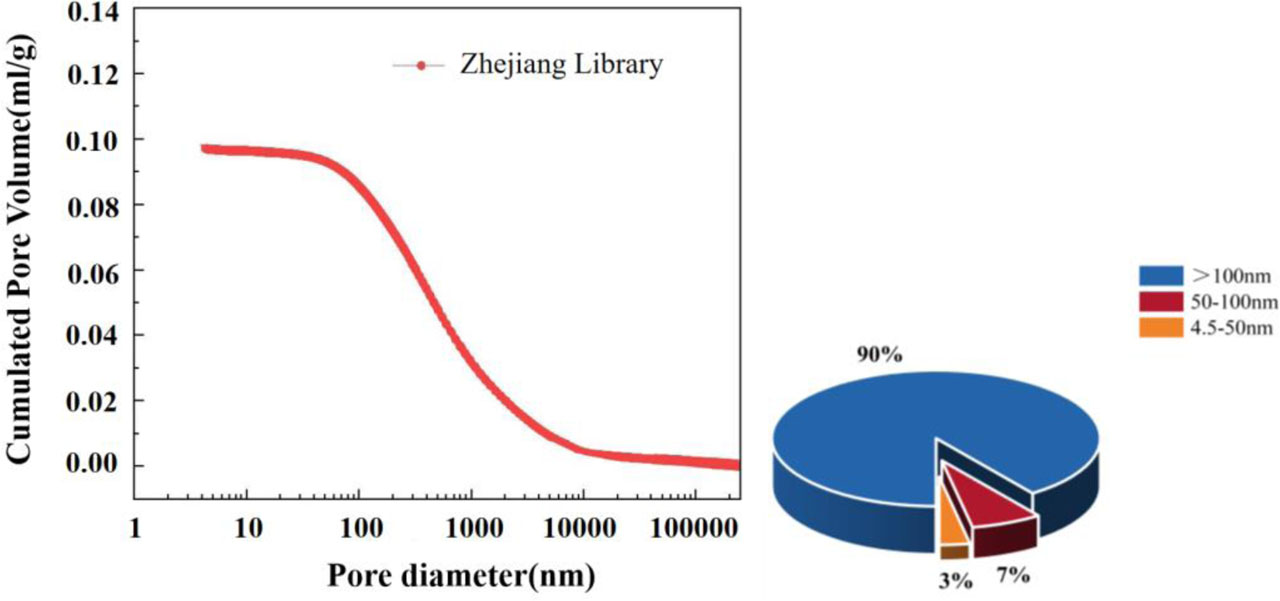
Figure 9:
Pore diameter of historical concrete samples and Ratio of corresponding dimensions
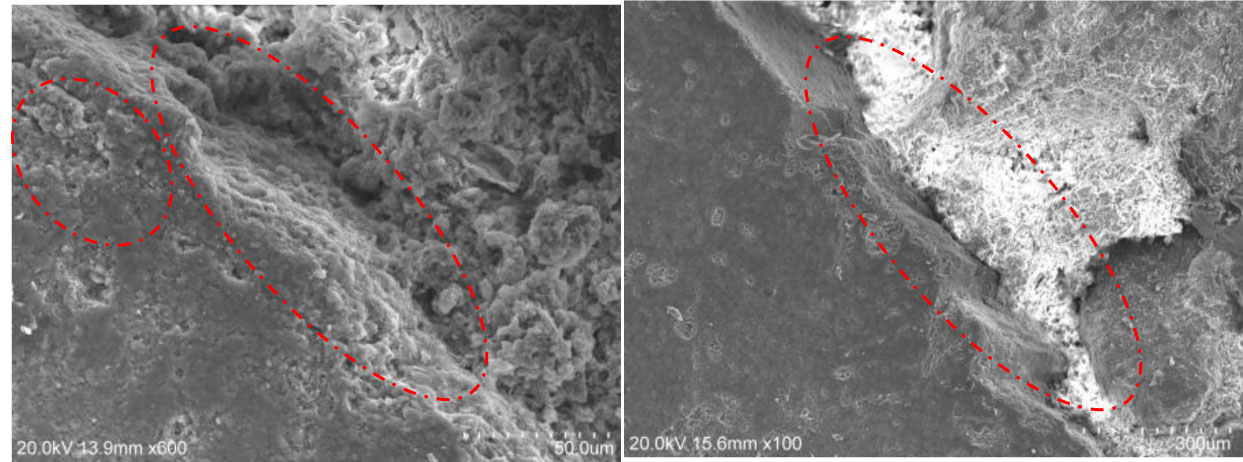
Figure 10:
Pores and cracks in interface transition zone