

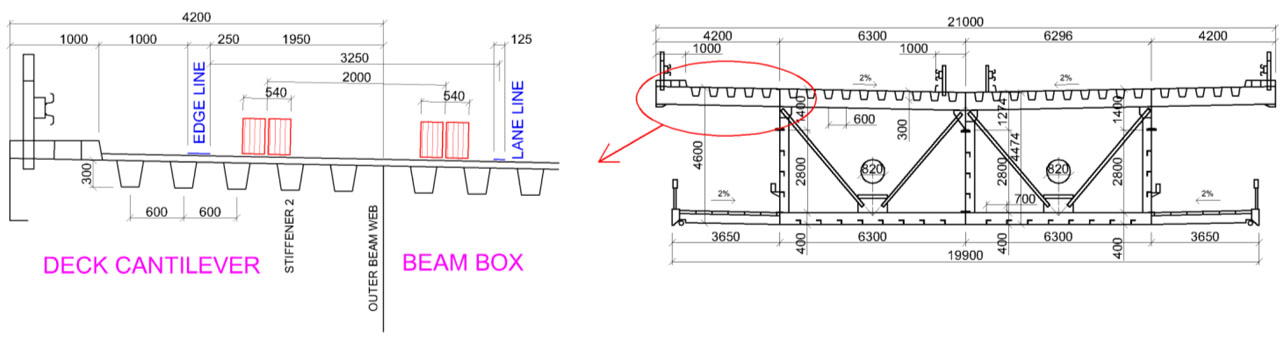
Figure 1:
Detail of the bridge cross-section and position of vehicles in the outer traffic lane
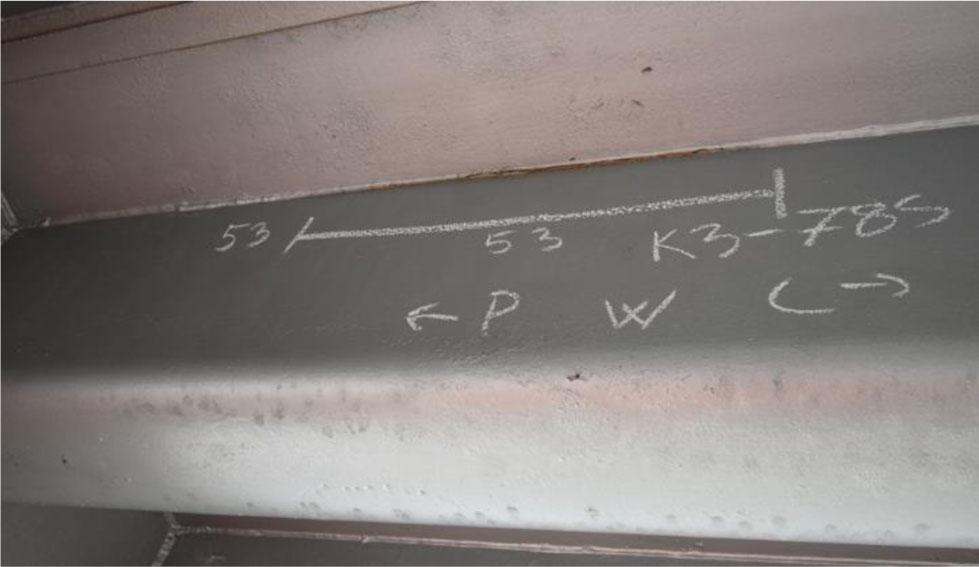
Figure 2:
Crack in the weld between the longitudinal stiffener and the deck plate
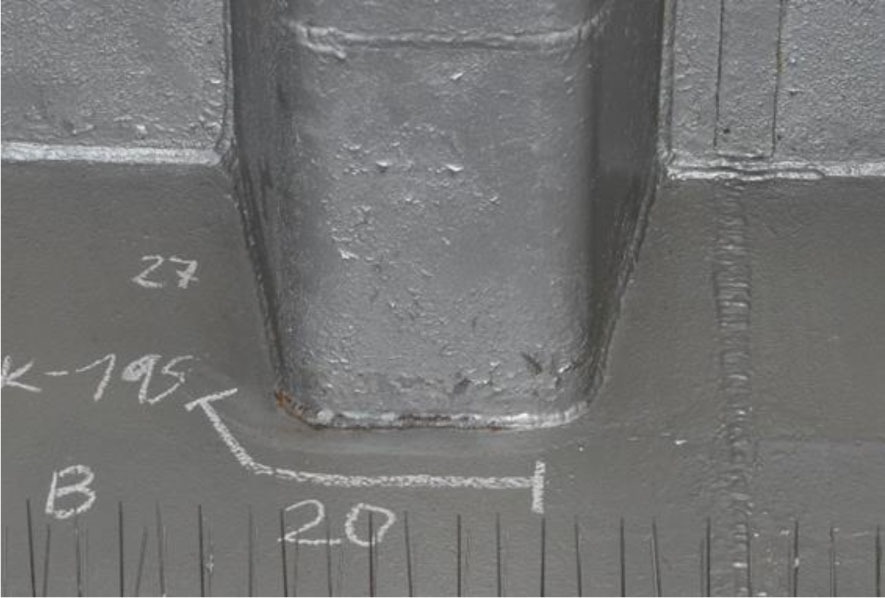
Figure 3:
Crack in the weld between the longitudinal stiffener and the crossbeam
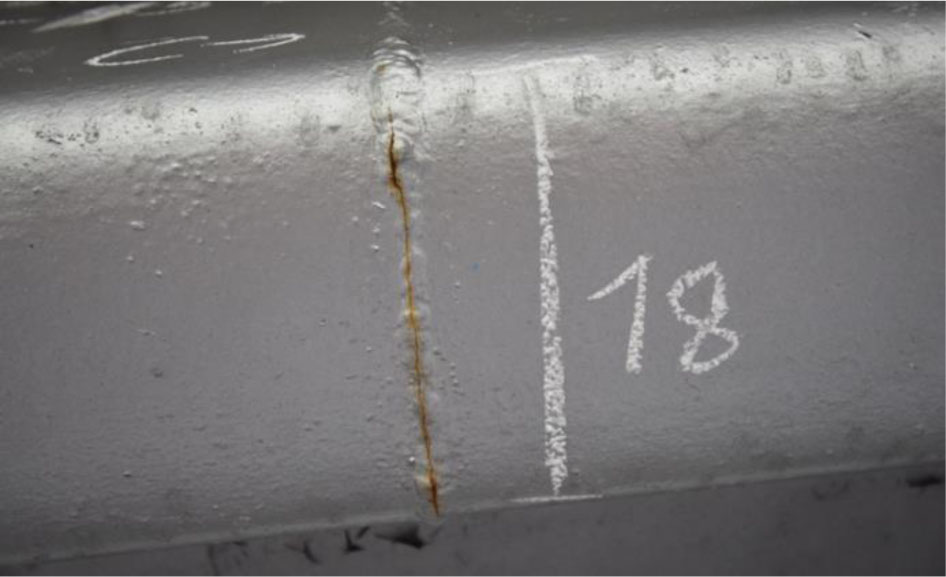
Figure 4:
Crack in the weld at the longitudinal stiffener splice
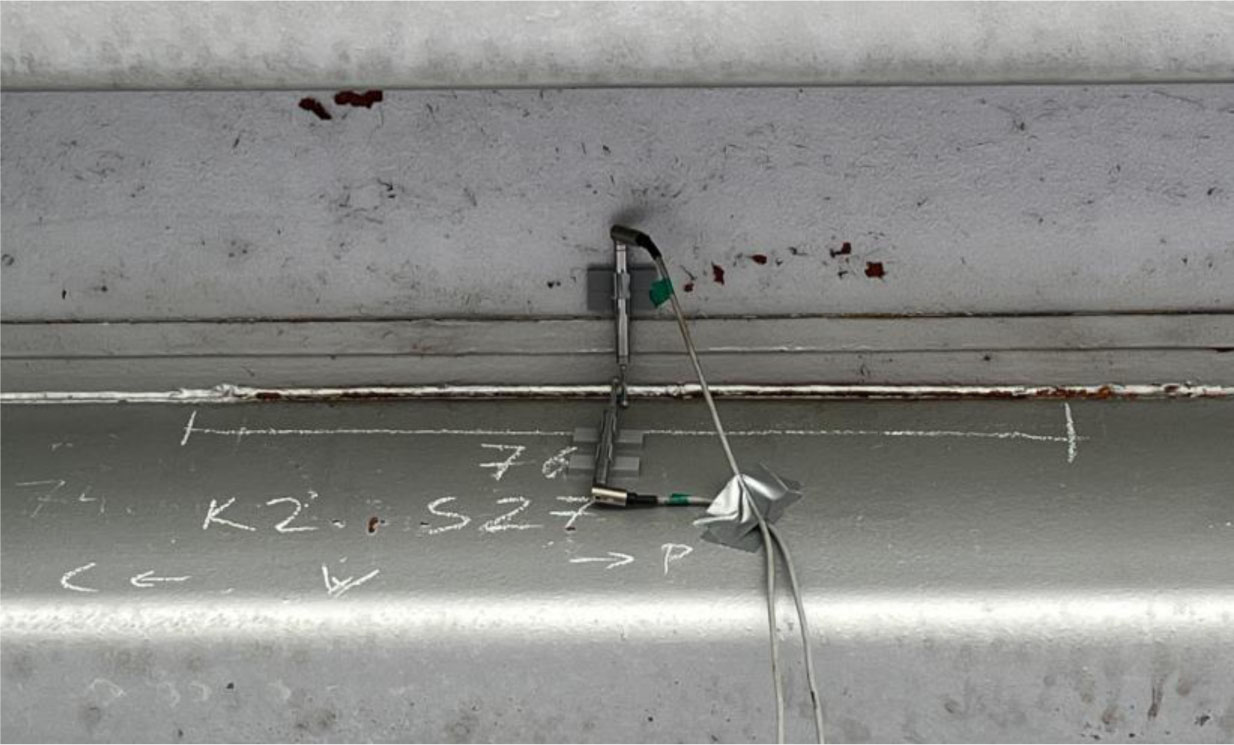
Figure 5:
LVDT placement at Section 27 - vertical and horizontal
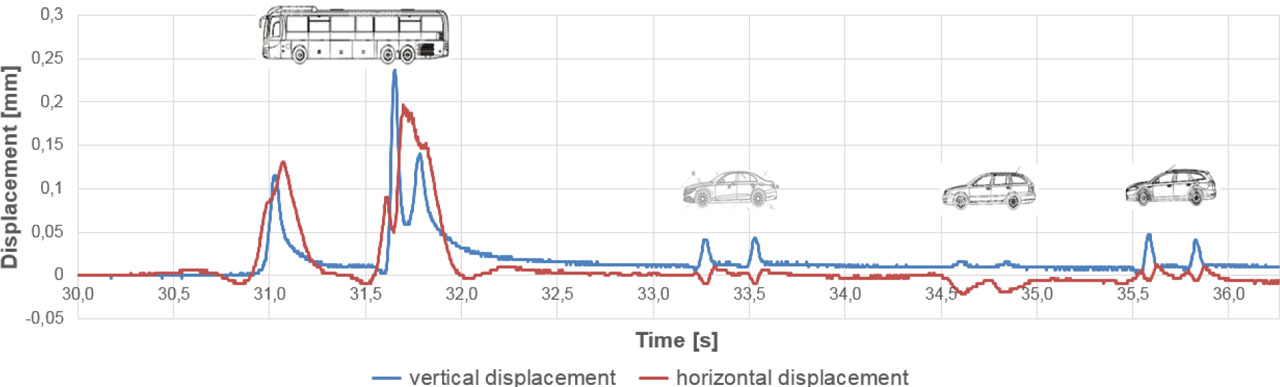
Figure 6:
Measured displacement of crack flanks - Case 1, Scenario 1
Table 1:
Vertical and horizontal displacements - Case 1, Scenario 1
| Load | Car axle | Displacement [mm] | |
|---|---|---|---|
| Vertical | Horizontal | ||
| Bus Regio | Front | 0.116 | 0.1131 |
| Rear 1 | 0.2375 | 0.194 | |
| Rear 2 | 0.141 | 0.153 | |
| Car 1 | Front | 0.041 | −0.009 |
| Rear | 0.044 | −0.009 | |
| Car 2 | Front | 0.006 | −0.022 |
| Rear | 0.006 | −0.019 | |
| Car 3 | Front | 0.047 | 0.013 |
| Rear | 0.038 | 0.013 | |
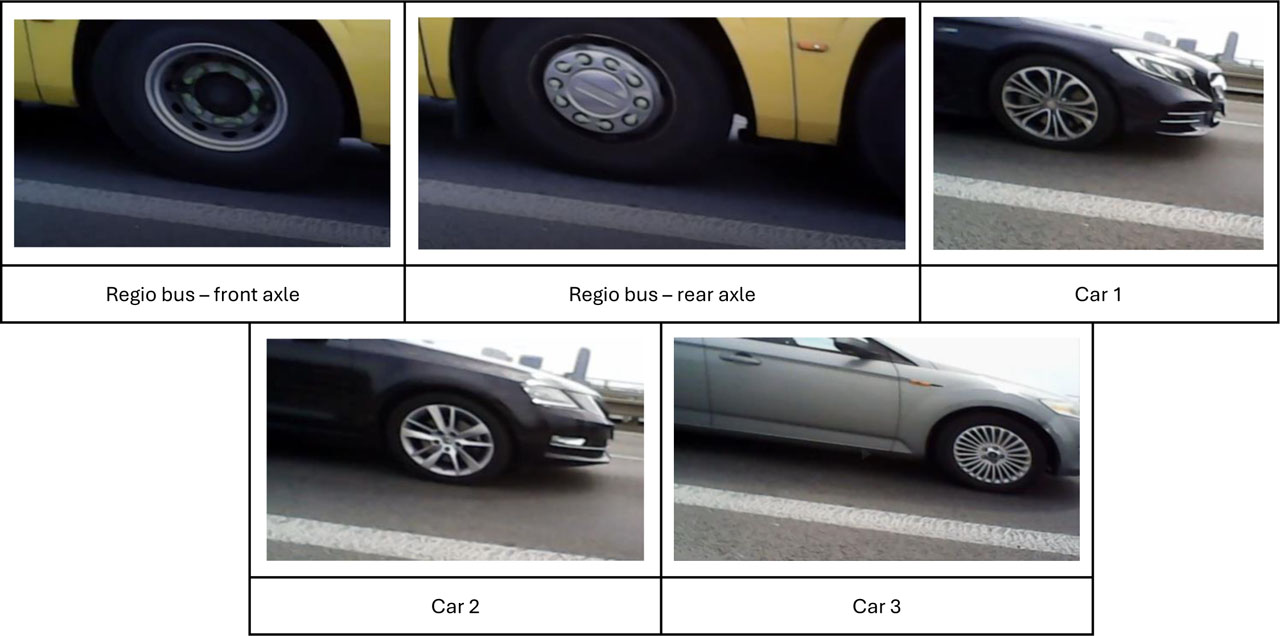
Figure 7:
Vehicle positions relative to the edge line – Case 1
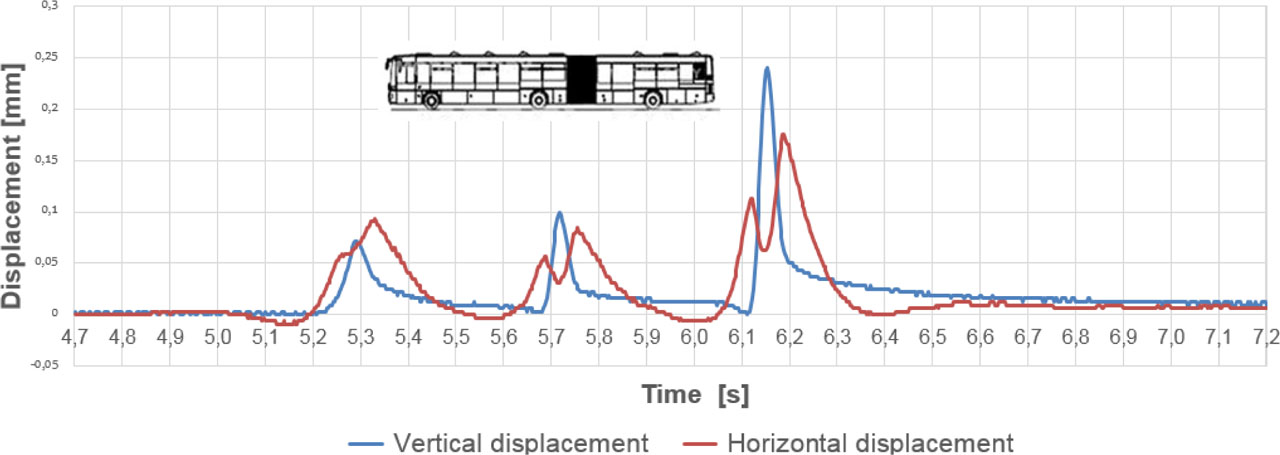
Figure 8:
Measured displacement of crack flanks - Case 1, Scenario 2
Table 2:
Vertical and horizontal displacements - Case 1, Scenario 2
| Load | Car Axle | Displacement [mm] | |
|---|---|---|---|
| Vertical | Horizontal | ||
| Bus SOR 1 | Front | 0.072 | 0.094 |
| Middle | 0.097 | 0.084 | |
| Rear | 0.241 | 0.172 | |
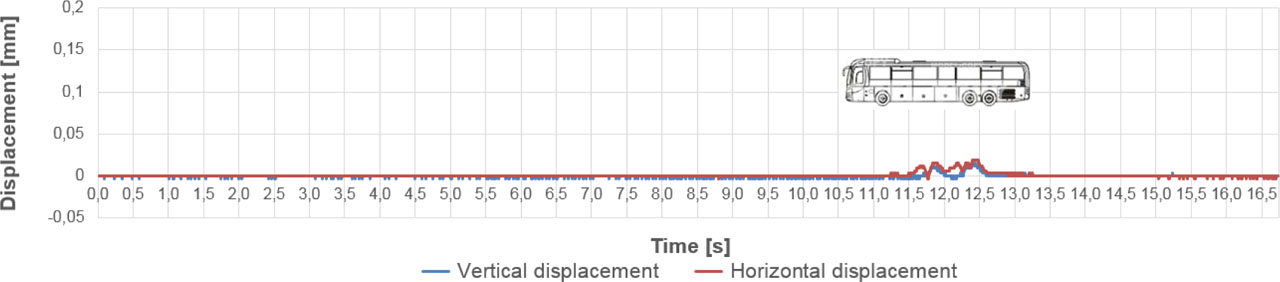
Figure 9:
Measured displacement of crack flanks - Case 2, Scenario 3
Table 3:
Vertical and horizontal displacements - Case 2, Scenario 3
| Load | Car axle | Displacement [mm] | |
|---|---|---|---|
| Vertical | Horizontal | ||
| Bus Regio | Front | 0.013 | 0.016 |
| Rear 1 | 0.013 | 0.016 | |
| Rear 2 | 0.016 | 0.019 | |
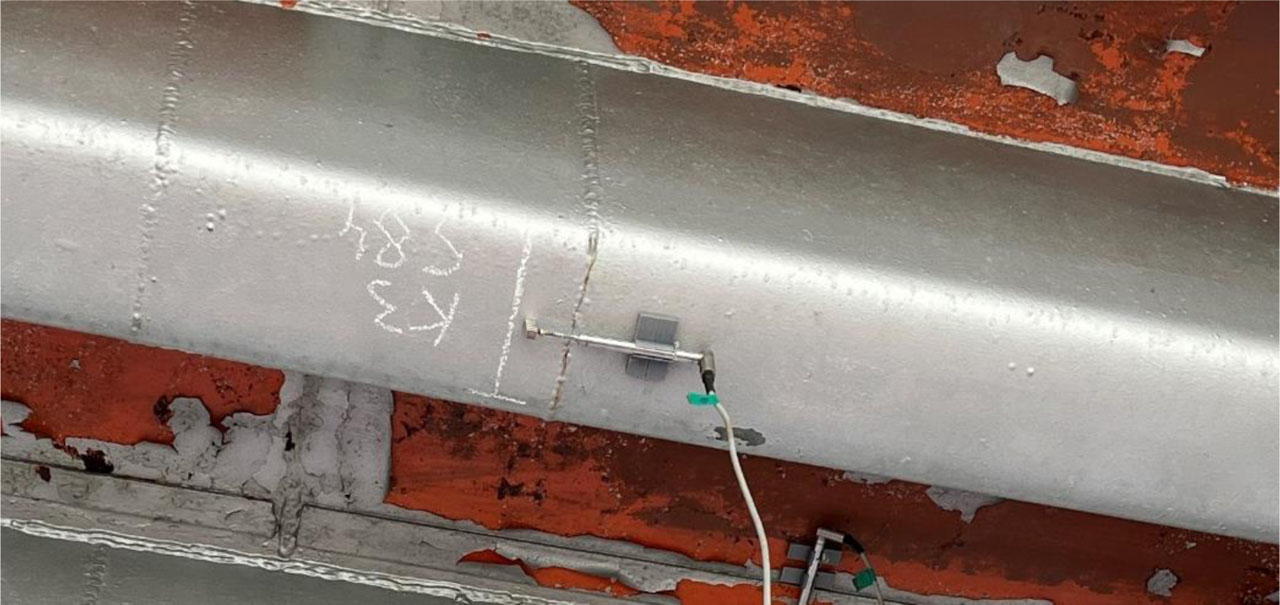
Figure 10:
LVDT placement at Section 84 - horizontal
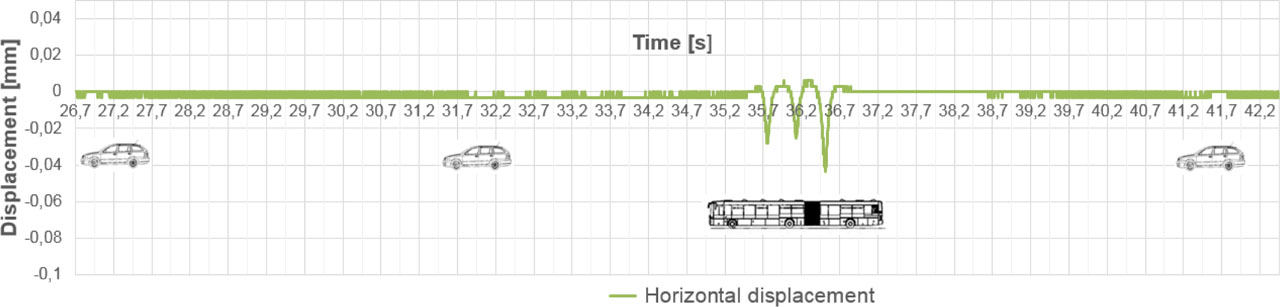
Figure 11:
Measured displacement of crack flanks - Case 3, Scenario 4