

In 2019, several fatigue cracks were detected in the orthotropic deck of the SNP Bridge, a prominent landmark in Bratislava. The cracks were mainly found in the welds connecting the longitudinal stiffeners to the deck plate (Figure 1, left)). The stiffeners have a closed trapezoidal cross-section fabricated from 6 mm thick steel plates, while the deck plate has a thickness of 12 mm. The connection between these load-bearing elements was achieved using single-sided fillet welds with a leg length of 5 mm, corresponding to an effective throat thickness of approximately 3.5 mm (Figure 1, right). According to EN 1993-2, such welds are not recommended for use in roadway deck regions due to their limited fatigue resistance.
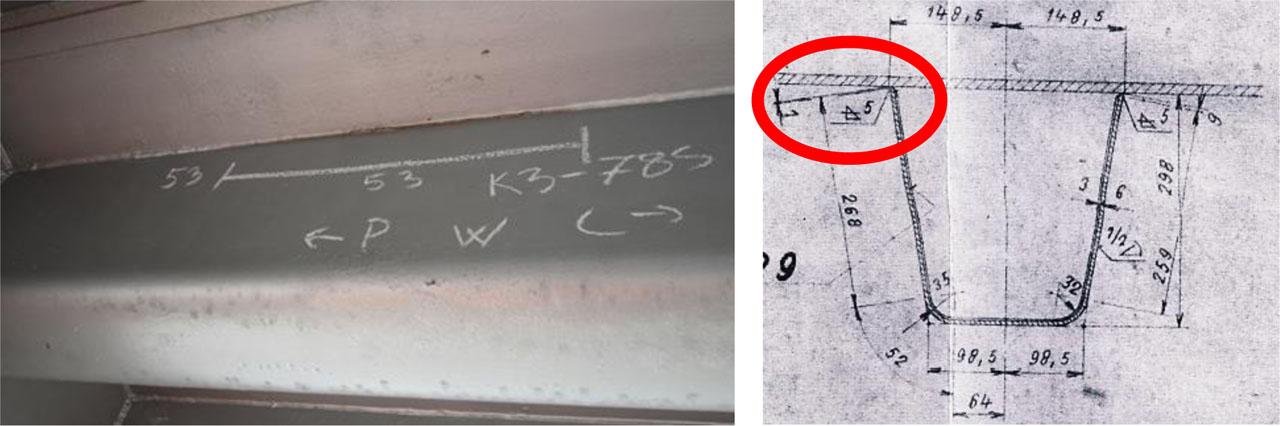
Crack in the weld between the longitudinal stiffener and the deck plate (left); original fabrication drawing of the same detail (right)
The draft of the 2nd generation Eurocode (FprEN 1993-1-9:2024) introduces three different approaches for the fatigue verification (nominal stress, hot-spot stress, and effective notch stress approach). A lot of research work was done recently on the development and improvement of these methods for the assessment of orthotropic bridge details.
Re-evaluation and extension of the notch catalogue according to the nominal stress approach was done by Feldmann et al. (2019).
The nominal stress approach may, however, not be adequate for details with steep stress gradients around welds. Maljaars et al. (2023a) addressed this limitation by deriving fatigue resistance of rib-to-deck, crossbeam-to-deck, and deck-to-deck welds using structural stress methods (hot-spot). This new design approach, based on local stresses, has led to Technical Specification TS 1993-1-901, which provides hot-spot stress–based S–N curves and practical guidance for fatigue verification of orthotropic bridge decks (Maljaars et al., 2023b). The finite element (FE) models typically use shell elements, but conventional approaches often fail to capture hot-spot stresses accurately at welded connections. To address this limitation, Rodenburg et al. (2023) proposed a generic local thickening method in shell element models, which significantly improves the agreement with solid element FE models.
For a rib-to-deck joint Chotickaia & Srisawatb (2020) investigated the effects of the wheel load location and weld penetration ratio on the nominal and effective notch stresses. The potential locations of fatigue crack initiation were evaluated. An increase in the weld penetration ratio decreased the root notch stress and significantly increased the potential for toe-deck cracking. For the 0% weld penetration ratio, fatigue cracks originated at the weld root and propagated into the weld throat in most loading cases.
Using a parametric model to perform a sensitivity analysis Exterkate (2024) showed that load position and local stiffness variations significantly affect fatigue performance, with detail-specific parameters governing crack initiation.
Special effects were investigated by Wang et al. (2020). The mechanism of the load dispersal through asphalt surfacing was clarified, as well as the influencing mechanism of temperatures. Results show that the contact forces among aggregates, instead of bonding forces, mainly explain the load dispersal through asphalt surfacing. The dispersed wheel loads tend to concentrate above rib-to-deck welds rather than uniformly distribute onto the surface of the orthotropic steel deck. Conventional fatigue evaluations often neglect the effect of stress reversals caused by sequential vehicle passages at different transverse positions, which can lead to significant overestimation of fatigue life. Zou et al. (2022) demonstrated that stress reversals may increase the effective stress range by more than 40% and reduce fatigue life by up to 95%, highlighting the importance of accounting for vehicle transverse distribution in orthotropic steel deck fatigue assessment.
This paper evaluates the above-mentioned critical fatigue-prone detail (stiffener to deck plate) using these fatigue assessment methods.
Diagnostics of the SNP Bridge conducted by Ároch et al. (2021) revealed several deficiencies in the weld execution, including deviations in dimensions and asymmetry in the weld cross-sections. Weld quality ranged from acceptable to locally unsatisfactory. All identified cracks initiated at the weld root and propagated toward the weld surface.
The primary cause of fatigue crack initiation and growth was attributed to the insufficient load-bearing cross-section of the welds, combined with cyclic loading from vehicles with high axle loads. Cracks occurrence was most frequent at the connections between the longitudinal stiffeners and the deck plate within the right-hand traffic lanes in both travel directions. These lanes carry the highest proportion of heavy vehicles and, consequently, experience greater fatigue demand. Based on diagnostic data, computational models were developed to simulate the fatigue behaviour of the welds.
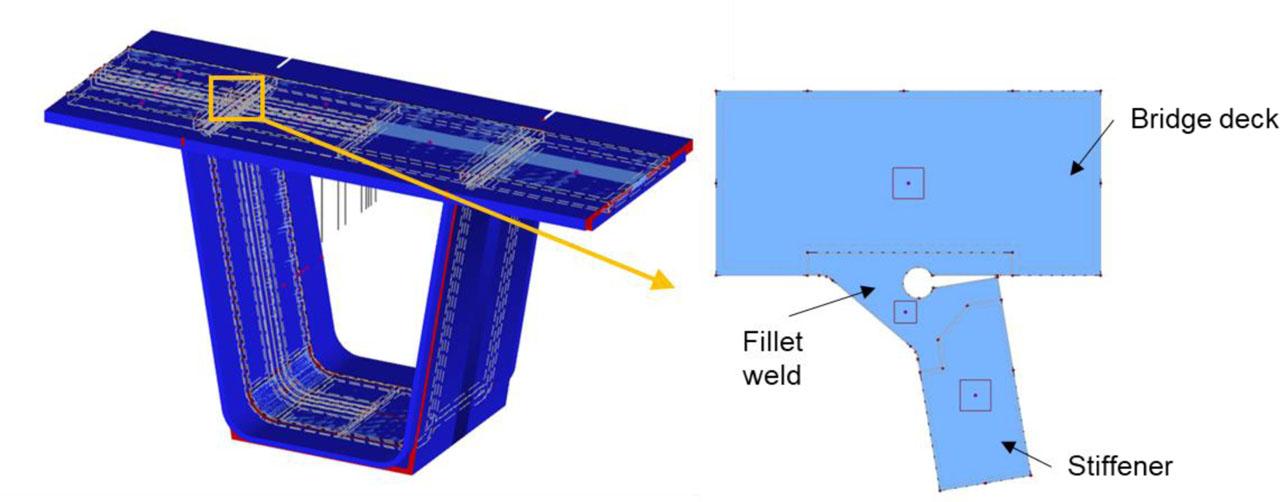
A numerical model of the steel orthotropic deck (Figure 2) was developed using the Dlubal RFEM software. The model comprised three segments between crossbeams, supported by the webs of the bridge’s box-girder cross-section. Stress analysis focused on the weld joint between the trapezoidal longitudinal stiffener and the deck plate. The selected segment length ensured adequate representation of internal forces and stresses within the weld connection, enabling subsequent fatigue assessments.
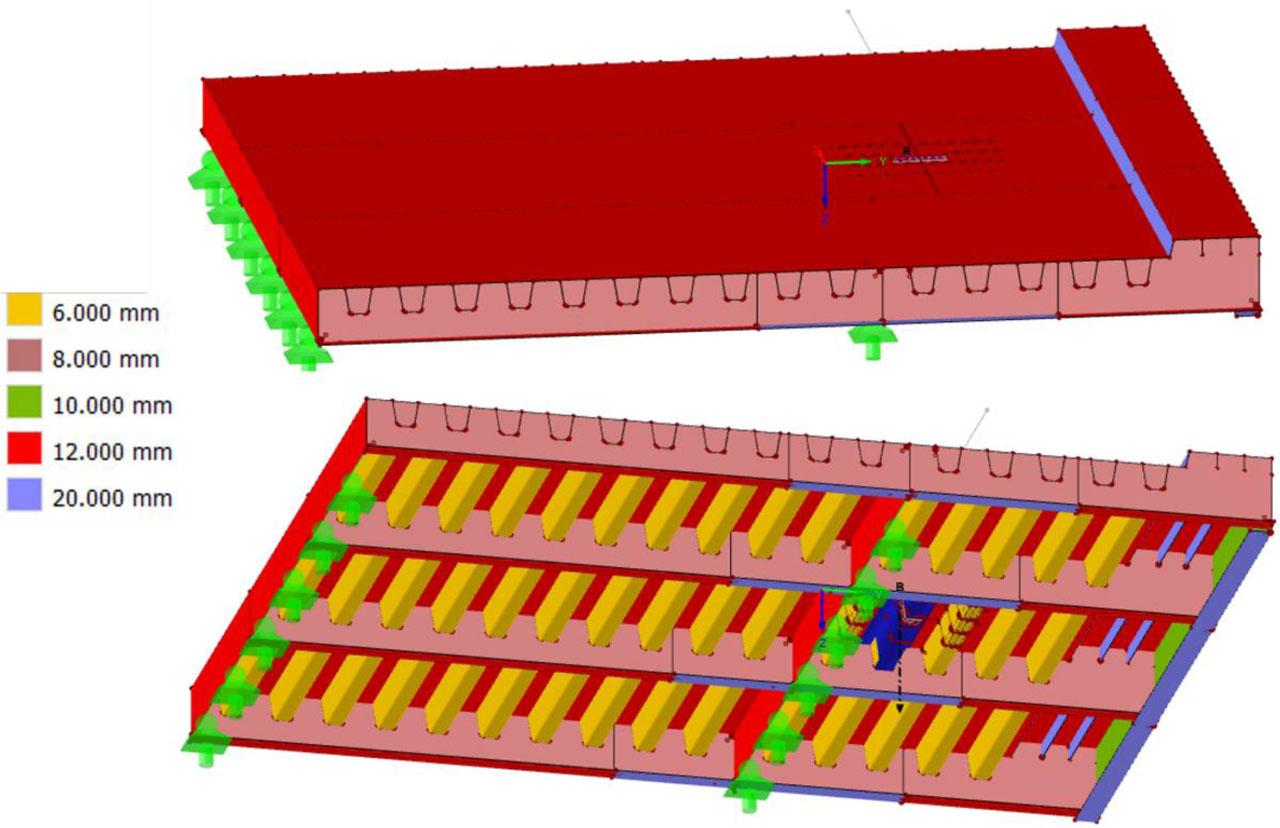
Numerical model of the orthotropic deck segment of the SNP Bridge
The partial factor for fatigue loads was taken as γFf=1.0, in accordance with prEN 1993-2:2024. The partial factor for fatigue resistance was set to γMf=1.0, following Table 4.1 (NDP) of FprCEN/TS 1993-1-901:2025, corresponding to the Damage Tolerant Design concept and a Low Consequence of Failure.
No complete loading history has been documented for the SNP Bridge since its commissioning in 1972, and historical traffic intensity records are unavailable. In its early years, the bridge primarily served heavy trucks engaged in the construction of the Petržalka residential district, while private vehicle and bus traffic was minimal. Upon completion of the housing estate, municipal public transport (MHD) buses became the predominant traffic load.
In addition to local effects, it is also necessary to determine the global stresses caused by the passage of the considered buses over the bridge. A two-dimensional beam model was created, based on the actual distribution of stiffness along the bridge length. The eccentricity of the load was taken into account by applying a torsional moment moving together with the vertical load representing the wheel loads. The largest tensile stresses in the bridge deck occur above the support on the Bratislava bridge side. However, they do not arise when the load is positioned directly above the support, but rather when the load is located between the cables in the bridge span-thus at a different position than the one causing the maximum local stresses. The global effect mainly influences the normal stresses in the longitudinal direction of the bridge, which were considered negligible, since the decisive stresses for the welds between the longitudinal stiffeners and the deck plate are the normal stresses in the transverse direction. Therefore, global structural effects were considered negligible and excluded from the analysis, with only local effects being evaluated.
The fatigue assessment accounted solely for loads generated by MHD buses, which operated consistently on the bridge. For simplicity, this bus traffic was assumed to have been present since the bridge’s opening. Freight transport, intercity buses, and passenger cars were excluded from the calculations due to their comparatively minor contribution to fatigue damage.
Based on publicly available specifications for vehicles used on regular MHD routes, the bus types operating on the SNP Bridge were identified. Table 1 presents these vehicles together with their operating on the bridge along with the estimated wheel loads.
Estimated loading and vehicle frequency (for the year 2020; image source: imhd.sk)
| Visualisation of the busses | Bus type | Number of vehicles per year in one direction | Estimated loading Surface load Front -> Back |
|---|---|---|---|
| Mercedes-Benz CapaCity | 59 072 | 143.8 kN/m2 | |
| 100.2 kN/m2 | |||
| 115.6 kN/m2 | |||
| 115.6 kN/m2 | |||
| Iveco Urbanway 12M | 84 765 | 158.1 kN/m2 | |
| 154.2 kN/m2 | |||
| SOR NB18 | 160 850 | 143.8 kN/m2 | |
| 115.6 kN/m2 | |||
| 154.2 kN/m2 | |||
Vehicle weights were determined for two loading conditions: an empty vehicle, as specified by the manufacturer, and a fully occupied vehicle at a density of 5 people/m2. The axle loads used in the calculations represent an intermediate value between these two extremes. The asphalt surfacing on the steel deck was considered solely as a load distribution medium for each wheel individually. This influence was accounted for in accordance with FprCEN/TS 1993-1-901:2025 using the load dispersal method. The wheel-asphalt contact dimensions were adopted from prEN 1991-2:2021.
Based on the division of traffic lanes on the bridge deck, the typical transverse wheel position was identified as the region between longitudinal stiffeners 2 and 3 in the cantilever portion of the deck. To incorporate potential variations in the transverse wheel path, the eccentricities shown in Figure 3 were applied. A step size of 150 mm was selected, corresponding to half the spacing between stiffener webs.
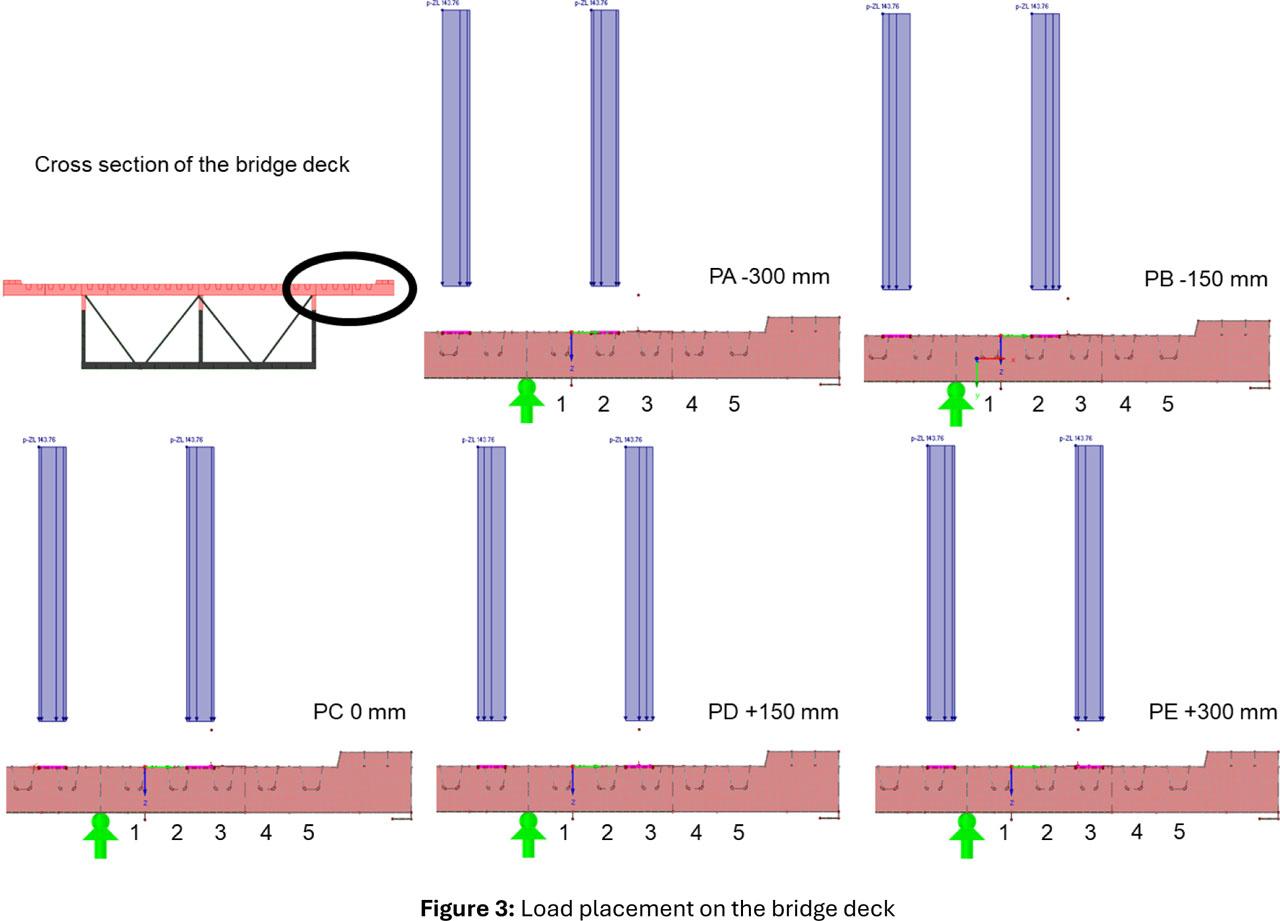
Load placement on the bridge deck
The nominal stress method involves a finite element simulation in which stresses are evaluated at the critical cross-section, without accounting for local stress concentrations. Fatigue life is then estimated by comparison with the Wöhler (SN) curve corresponding to the relevant detail category defined in EN 1993-1-9.
According to FprEN 1993-1-9:2024, Table 10.9, the appropriate detail category would be No.8, Cat. 63. However, this category requires: a ≥ t (not satisfied in this case), a pre-chamfered stiffener with the edge of the stiffener plate parallel to the deck plate (also not satisfied), and a weld gap g≤0.5mm (unknown). Consequently, Cat. 50 from Table 8.8 of EN 1993-1-9: 2005, Detail No. 8, was adopted instead. Due to the small weld size, the stress range was calculated directly in the weld, rather than in the stiffener web.
The calculation procedure is illustrated using the passage of an Iveco bus with a transverse eccentricity of +150 mm (i.e. the wheel axis located 150 mm from the axis of longitudinal stiffener 3 toward the outer web of the girder). The numerical model produced the stress distribution in the weld of the longitudinal stiffener, as shown in Figure 4.
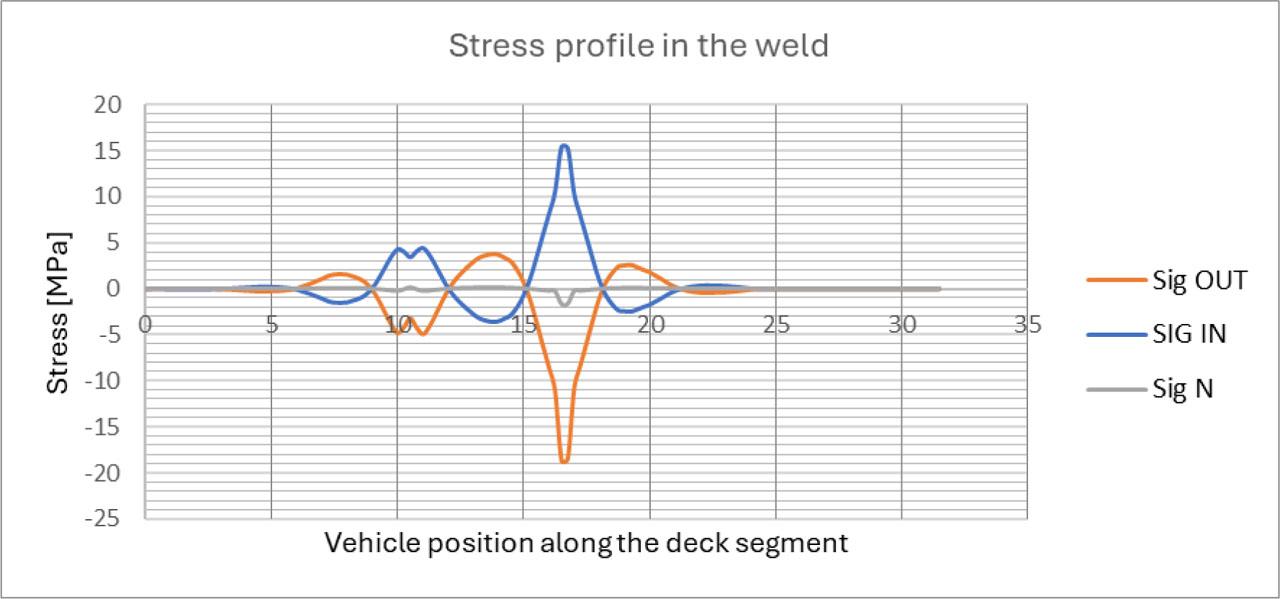
Iveco Urbanway, Passage with eccentricity +150 mm (PD), Nominal stresses in the weld of the longitudinal stiffener at mid-span (OUT – on the outer web surface, IN – on the inner web surface, N – only from axial force)
Using a proprietary reservoir method program, the stress range magnitudes were determined for the passage of a single bus over the bridge. The stress on the inner or outer side of the stiffener was used, depending on which side exhibited larger stress fluctuations. However, these variations did not differ significantly from each other, as can also be seen in Figure 4. The results for the case described above are presented in Table 2; stress ranges below 1 MPa were omitted.
Stress range magnitudes and number of cycles to failure at position PD (eccentricity +150 mm) from the Iveco Urbanway bus
| Stress range [MPa] | Number of cycles to failure |
|---|---|
| 33.37 | 8 205 608 |
| 19.96 | ∞ |
| 1.66 | ∞ |
From these results, the annual fatigue damage for all three bus types was calculated, enabling the estimation of the fatigue life of the stiffener-to-deck plate connection. Applying the nominal stress method, the fatigue life was estimated at approximately 30 years. The fatigue detail assignment for the weld between the longitudinal stiffener and the deck plate followed the approach proposed by Feldmann et al. (2019).
The hot-spot stress method captures local stress concentrations in weld regions not represented by nominal stresses. The detail model was developed following FprCEN/TS 1993-1-901:2025, considering fatigue cracks initiated at the root of single-sided welds. In the present case, the connection corresponds most closely to detail category C2b from FprCEN/TS 1993-1-901:2025, which guided the geometry choice and calculation procedure. Weld stress is not determined directly at the point of maximum stress; instead, it is derived from internal forces at point “C”, from which the stress amplitude is calculated according to FprCEN/TS 1993-1-901:2025 (Figure 5).
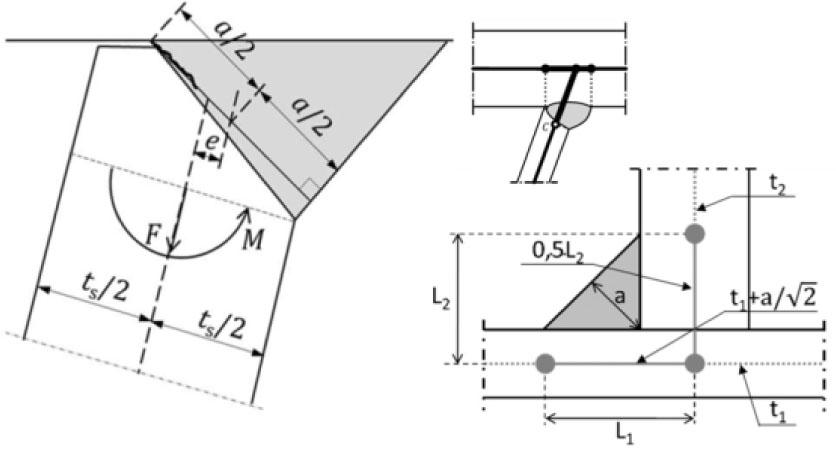
Detail of the weld connection between the bridge deck plate (12 mm) and the stiffener plate (6 mm) according to detail category C2b in FprCEN/TS 1993-1-901:2025
The influence of weld stiffness was accounted for by increasing the thickness of elements adjacent to the weld, following the approach illustrated in Figure A.1 of FprCEN/TS 1993-1-901:2025. For cracks initiating at the weld root into the weld, the resistance curve from Figure 7.2 was applied, with Δσ_(C,Table)=40 (cl.7.1(1) of FprCEN/TS 1993-1-901:2025|. A detail-specific factor f=3.5 was used for automatic welds to account for loading type and the load-shedding effect typical of orthotropic decks.
Axle passages of all three bus types were simulated. Internal forces were extracted at the weld location corresponding to the third stiffener of the bridge deck plate. The resulting stress distribution for the passage of the selected Iveco Urbanway bus is presented in Figure 6.
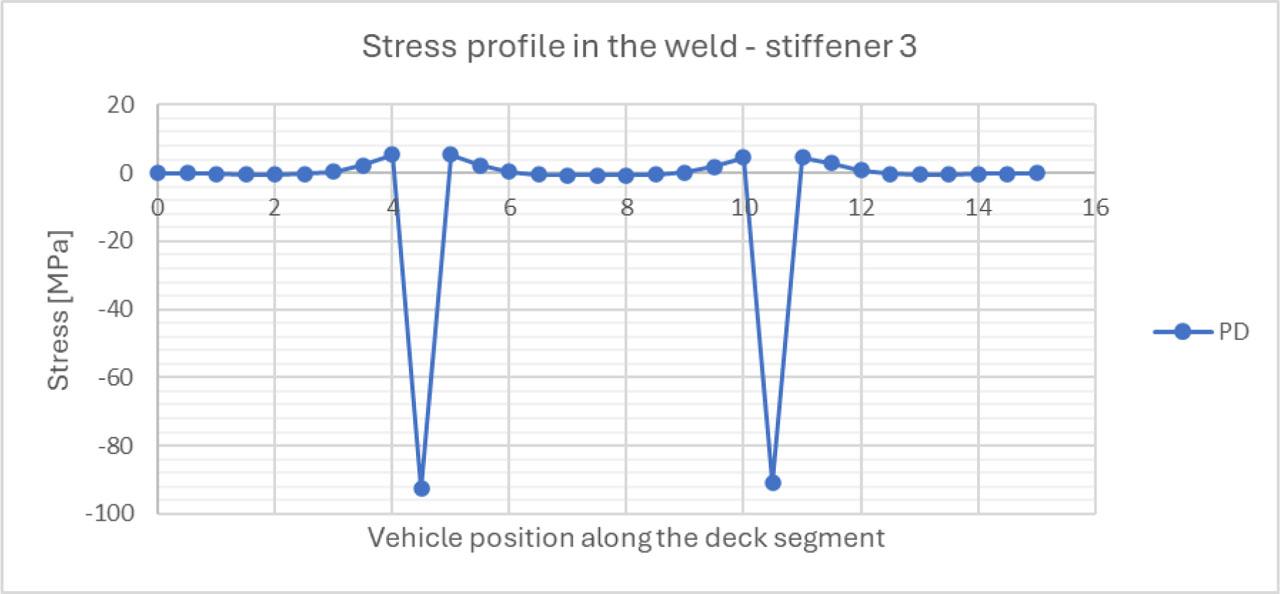
Iveco Urbanway, passage with eccentricity +150 mm (PD), Hot-spot stresses in the web of the longitudinal stiffener at mid-span
Once again, the stress range magnitudes during a single bus passage were determined using the reservoir method. Results are presented in Table 3.
Stress range magnitudes and number of cycles to failure at position PD (eccentricity +150 mm) from the Iveco Urbanway bus
| Stress range [MPa] | Number of cycles to failure |
|---|---|
| 98.02 | 1 880 473 |
| 95.28 | 1 185 100 |
| 5.24 | ∞ |
Similarly, stress ranges for the other bus types were determined. Using the hot-spot stress method, the fatigue life of the connection was estimated at 20 years.
In this method, the geometric notch in the weld area was explicitly represented in the finite element model. The notch was placed on the third stiffener, and stresses were evaluated directly at its edge during simulated bus passages. Both the crack-affected region and the notch were modeled as a solid 3D body composed of isotropic, linear elastic material. One of these 3D solids containing the notch measured 10 mm × 10 mm × 7 mm, while the entire 3D-solid region extended 13 cm along the bridge deck length and 60 cm across its width. The solids covered the full height of the stiffener. Because of the model’s complexity and level of detail, the surrounding bridge deck was modeled with shell elements. A hexahedral linear element type was used for meshing, with a refined element size of 0.15 mm in the notch region to ensure accuracy, given the high sensitivity of stresses to the geometry. The analysis was performed using the finite element software RFEM, developed by Dlubal Software GmbH.
The notch radius was set to r=1mm, applied to both weld toes and weld root. A keyhole was modeled with the weld root located on the circumference of the circle, following clause 8.2.5(3) of FprEN 1993-1-14:2025. Stress ranges were calculated using equivalent von Mises stresses (EVM). The corresponding detail categories, according to Table C.1 of FprEN 1993-1-9: 2024, were 225 principal stress (PS) and 200 (EVM). The notch detail is shown in Figure 7.
Detail of the connection between the longitudinal stiffener and bridge deck plate with an initiated notch
Bus passages were simulated as for the other methods. For illustration, the passage of the Iveco Urbanway bus at position PD is shown in Figure 8.

Iveco Urbanway, passage with eccentricity +150 mm (PD), Notch stresses in the web of the longitudinal stiffener at mid-span
In this study, the reservoir method was applied to determine the magnitudes of stress ranges induced by a single bus passage. Results are summarized in Table 4.
Stress range magnitudes and number of cycles to failure at position PD (eccentricity +150 mm) from the Iveco Urbanway bus
| Stress range [MPa] | Number of cycles to failure |
|---|---|
| 104.67 | 3 505 317 |
| 102.91 | 3 687 831 |
| 5.21 | ∞ |
Using the fatigue strength curves from FprEN 1993-1-9:2024, the number of cycles to failure was determined. Stress ranges were similarly calculated for the other bus types, and the fatigue life of the connection was evaluated using the notch stress method.
Table 5 summarizes the fatigue assessment methods applied and the corresponding estimated service life of the weld connecting the longitudinal stiffener to the bridge deck plate.
Comparison of estimated fatigue lives using three different methods
| Method | Expected lifespan [years] |
|---|---|
| Nominal stress method | 30 |
| Hot-spot stress method | 20 |
| Effective notch stress method | 26 |
The estimated fatigue lives obtained using the different assessment methods show variation due to differences in conservatism and treatment of local stress concentrations.
- ○
Nominal stress method: Relies on stresses from a global static analysis without considering local effects, such as geometric notches or weld details, estimating a fatigue life of 30 years.
- ○
Hot-spot stress method: Lead to a different fatigue life estimate due to discrepancies between the selected detail (C2b) and the actual geometry of the fabricated welds on the SNP Bridge. Deviations from the standard C2b detail reduce the estimated fatigue life to 20 years.
- ○
Effective notch stress method: Evaluates stresses at the weld root using a refined geometric model, giving a fatigue life of 26 years. This method provides the most detailed representation of local stress effects but is highly sensitive to model and mesh accuracy.
Each method has inherent limitations that should be considered when interpreting results:
- ○
Nominal stress method: Simple but may underestimate local effects in welded details.
- ○
Hot-spot stress method: Partially accounts for stress concentrations, but sharp notches and microgeometry are not captured.
- ○
Effective notch stress method: Most accurate, but computationally intensive and sensitive to modelling precision.
This study analysed a critical welded detail of the orthotropic deck of the SNP Bridge using three fatigue assessment methods. Predicted fatigue lives varied widely – from 20 years (hot-spot stress method) to 30 years (nominal stress method).
The nominal stress approach can be applied using a coarse beam or shell finite element model, but it does not capture local peak stresses and may therefore significantly overestimate fatigue life. The hot-spot method requires more refined FEM modelling with shell or solid elements. Stresses are extracted at specified distances from the weld toe (or root) and extrapolated to the crack location. The influence of weld stiffness must also be considered. This method offers a good balance between modelling effort and accuracy, which is why it is widely accepted in bridge engineering practice. The effective notch stress approach demands a very fine solid-element mesh at the expected crack location. It explicitly models the weld geometry and assumes a prescribed weld toe and root radius. Although this calculation is time-consuming, it provides the most realistic assessment of local effects. Each of these three approaches requires its own set of S-N curves.
The discrepancies in the predicted fatigue lives demonstrate that the choice of fatigue assessment method significantly affects service life evaluation. For modern assessments of welded details, particularly for repair design or critical bridge evaluation, higher-fidelity methods such as hot-spot stress or effective notch stress approaches are recommended.